《2007-2008年中国基本型乘用车市场渠道研究报告》首先从整个行业解读来2007年的汽车产销情况,并分厂商介绍了2007年国内产销前十的品牌销售情况。第二部分按照人均GDP、人均可支配收入、城市道路长度、城市公交车数量等与基本型乘用车相关的重点指标对国内的31个省市区域市场进行区域类别划分及评分,并对介绍国内10个城市的基本型乘用车市场现状及对城市车市做SWOT分析其前景。第三部分首先总结了目前国内厂商的渠道分地域分布特征,然后分别分厂商介绍其各自的渠道分布并突出其优势区域。最后一部分综合第二、三部分的市场竞争强度、市场大小、区域的品牌(厂商)偏好程度、区域的保健因素得分对车市的区域市场进行评分为厂商进行渠道拓展提供参考,并对基本型乘用车渠道变革进行相关分析。
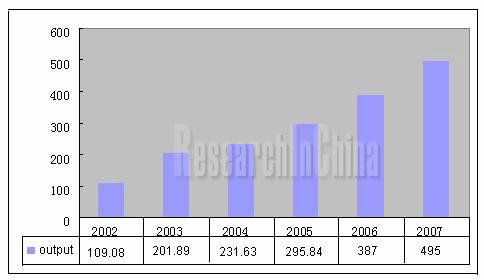
中国汽车工业正经历着一个快速的发展的时期。据中国汽车工业协会的统计,中国的基本型乘用车的产量从2002年的109.08万辆增长到2007年的495万辆,增长了385.92万辆,年复合增长率为35.33%。
图表 2002-2007年中国基本型乘用车产量(单位:万辆)

信息来源:中国汽车工业协会;整理:水清木华
中国基本型乘用车渠道也有明显的区域特点。以深圳车市为例,深圳2004年的基本乘用车市场为6.73万辆,到2007年增长到13.13万辆,年复合增长率为24.95%。
深圳汽车消费者影响因素前三位是价格35%,,安全性26%,品牌20%,而关于油耗方面深圳消费者相对于其它城市如北京、上海、成都、广州而言表现的比较漠视,只占了4%。
关于信息收集渠道而言深圳消费者表现着自己的特点,排在前三的分别是到4S店看车占33%、通过有经验朋友的介绍占27%以及试乘经历12%。
图表 2005-2007年深圳轿车销量前十厂家情况
单位:辆
|
排名 |
2005年厂家及销量 |
2006年厂家及销量 |
2007年厂家及销量 |
|
1 |
广州本田 |
13833 |
一汽丰田 |
15906 |
广州本田 |
16922 |
|
2 |
上海通用 |
12282 |
广州本田 |
13791 |
一汽丰田 |
16231 |
|
3 |
一汽丰田 |
8792 |
上海通用 |
13233 |
东风日产 |
11638 |
|
4 |
东风日产 |
6156 |
北京现代 |
8001 |
广州丰田 |
9409 |
|
5 |
北京现代 |
5929 |
东风日产 |
7256 |
一汽大众 |
8725 |
|
6 |
一汽大众 |
4596 |
一汽大众 |
5313 |
上海通用 |
8248 |
|
7 |
一汽轿车 |
4355 |
长安福特 |
4821 |
长安福特 |
5994 |
|
8 |
海南马自达 |
3310 |
奇瑞汽车 |
3987 |
东风本田 |
5876 |
|
9 |
东南汽车 |
3251 |
比亚迪汽车 |
3583 |
比亚迪 |
5498 |
|
10 |
奇瑞汽车 |
2686 |
华晨汽车 |
3386 |
北京现代 |
4993 |
信息来源:深圳车行网水清木华研究中心整理
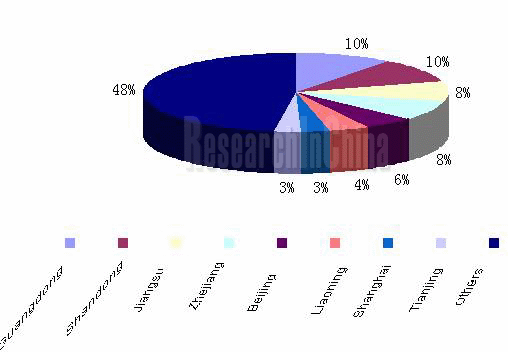
目前国内共有三万多家汽车经销商,4S店占了其三分之一以上。就不完全统计了国内的二十一家基本呈用车生产厂商的分品牌或厂商的按照省市区域的经销商网点共7604家。
根据国内厂商经销网点区域的分布数据,我们可以发现关于基本型乘用车的渠道特点:
特点一、乘用车的经销商分布,过于集中于经济发达的省市区域;
特点二、21家乘用车生产厂商的销售网络可以按照省市区域的相似性进行五类划分。第一、二类别的厂商品牌在经济发达地区网络分布较弱,而第三、四、五类别相对而言在经济发达地区较强;
特点三、乘用车生产厂商与区域经销商之间的选择存在着明显的差异;
特点四、经济落后地区的市场竞争程度明显高于经济发达地区。
图表 广东、山东、江苏等8重点经济省市的基本乘用车经销商的百分比
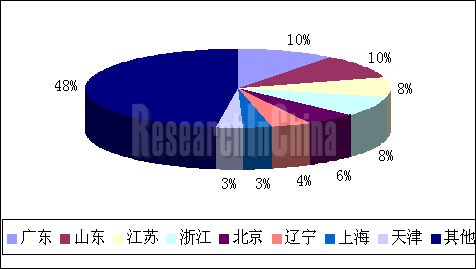
信息来源:水清木华研究中心
Abstract
The report first provides you with the output and sales of China’s auto industry in 2007 and then introduces China’s top ten brands in the year in terms of output and sales in the first chapter of the report. According to the key indicators in 31 provinces, autonomous regions and municipalities directly under the central government, related to passenger cars, including per capita GDP, per capita disposable income, urban road length, the number of city buses, the second chapter of the report divides China’s auto market into several regional ones with grades attached to each of them and makes SWOT analysis of urban auto markets in ten selected cities, to which the current market status ofpassenger cars and the future development of auto markets are provided. In the third chapter, the report summarizes the characteristics of regional distribution of local producers’ market channels and then gives you an introduction of their respective channel distribution with their own advantages in certain regions highlighted. Based on the scores on the intensiveness of market competition, market size and degree of regional preference for brands (manufacturers) in the second and third chapters, regional markets are graded to provide references for manufacturers in extending their channels in the last chapter, which also makes analysis of changes in market channels of passenger cars.
China’s auto industry is in the process of a rapid development. According to statistics of Chinese Association of Automobile Manufacturers (CAAM), the output of China passenger cars rose to 4.95 million units in 2007 from 1.09 million units in 2002, an increase of 3.8592 million units, representing the average annual growth rate of 35.33 percent.
Output of China Passenger Cars, 2002-2007 (unit: 10, 000)
Source: Chinese Association of Automobile Manufacturers
Market channels of China passenger cars have also obvious regional characteristics. TakeShenzhenCity as an example, the city had 67,300 passenger cars in 2004 and the figure rose to 131,300 in 2007, representing average annual growth rate of 24.95 percent.
The top tree factors influencing auto consumers in Shenzhen are in turn price (35%), safety (26%) and brands (20%). As to fuel consumption, compared with consumers of other cities like Beijing, Shanghai, Chengdu and Guangzhou, Shenzhen consumers are relatively indifferent to it, accounting for only 4 percent.
As far as information gathering channels are concerned, Shenzhen consumers have their own characteristics. The top three channels are: going to 4s shops to see cars, which accounts for 33 percent, inquiring it from friends with experiences, which accounts for 27 percent, and trial driving, which accounts for 12 percent.
Review of Top 10 Auto Manufacturers in Sales in Shenzhen, 2005-2007(Units)
|
Rank |
Manufactures and Output in 2005 |
Manufactures and Output in 2006 |
Manufactures and Output in 2007 |
|
01 |
Guangzhou Honda |
13833 |
FAW Toyota |
15906 |
Guangzhou Honda |
16922 |
|
02 |
Shanghai GM |
12282 |
Guangzhou Honda |
13791 |
FAW Toyota |
16231 |
|
03 |
FAW Toyota |
8792 |
Shanghai GM |
13233 |
Dongfeng Nissan |
11638 |
|
04 |
Dongfeng Nissan |
6156 |
Beijing Hyundai |
8001 |
GuangzhouToyota |
9409 |
|
05 |
Beijing Hyundai |
5929 |
Dongfeng Nissan |
7256 |
FAW-Volkswagen |
8725 |
|
06 |
FAW-Volkswagen |
4596 |
FAW-Volkswagen |
5313 |
Shanghai GM |
8248 |
|
07 |
FAW Car |
4355 |
Changan Ford |
4821 |
Changan Ford |
5994 |
|
08 |
Hainan Mazda |
3310 |
Chery Automobile |
3987 |
Dongfeng Honda |
5876 |
|
09 |
Dongnan Automobile |
3251 |
BYD Auto |
3583 |
BYD |
5498 |
|
10 |
Chery Automobile |
2686 |
Huachen Car |
3386 |
Beijing Hyundai |
4993 |
Source: ResearchInChina
At present, there are a total of more than 30,000 auto dealers in China and 4s shops account for over one thirds of them. According to incomplete statistics, China’s 21 local manufacturers of passenger cars have 7,604 sales outlets named after brands or producers.
Based on the data of the regional distribution of local producers’ sales outlets, we can see the characteristics of market channels, which are as follows.
1. Dealers of passenger car are excessively concentrated in developed provinces and municipalities.
2. The distribution network of the 21 passenger car manufacturers can be divided into five categories based on the similarity of provinces and municipalities. The distribution network of manufacturers’ brands in category 1 and 2 is relatively weak in developed areas, while that in category 3, 4 and 5 is comparatively strong in such areas.
3. There exist distinctive differences in choices between producers and regional dealers.
4. Market competition in less developed areas is more intensive than that in developed areas.
Table: Passenger Car Dealers in Eight Key Developed Areas Like Provinces of Guangdong, Shandong and Jiangsu
Source: ResearchInChina
第一章 2003-2007年中国基本型乘用车市场产销分析 6
1.1 2003-2007年中国基本型乘用车产量分析 7
1.2 2003-2007年中国基本型乘用车销量分析 8
1.3 2005-2007年中国基本型乘用车销量前十名企业分析 10
1.3.1 一汽大众 11
1.3.2上海大众 12
1.3.3上海通用 13
1.3.4奇瑞 14
1.3.5一汽丰田 15
1.3.6 东风日产 16
1.3.7广州本田 16
1.3.8 吉利 17
1.3.9 长安福特 18
1.3.10 神龙 19
第二章 2007年中国基本型乘用车销售重点区域分析 21
2.1 中国基本型乘用车市场的划分分析 21
2.1.1 基本型乘用车市场划分的依据 21
2.1.2 基本型乘用车市场区域类别的划分与分析 22
2.2 国内重点基本型乘用车城市市场分析 27
2.2.1 北京 27
2.2.2 上海 32
2.2.3 广州 35
2.2.4 深圳 39
2.2.5 成都 43
2.2.6 重庆 47
2.2.7 东莞 49
2.2.8 海口 51
2.2.9 福州 53
2.2.10 天津 55
第三章 2007年中国基本型乘用车销售渠道分析 58
3.1 中国汽车的销售渠道总体分析 58
3.2 国内汽车渠道的特点分析 60
3.3 主要汽车厂商分销渠道分析 70
3.3.1一汽大众 70
3.3.2一汽丰田 72
3.3.3上海大众 74
3.3.4 神龙汽车 77
3.3.5 上汽通用 79
3.3.6 东风日产 81
3.3.7 长安福特 83
3.3.8 奇瑞 85
3.3.9 吉利汽车 87
3.3.10 广州本田 89
3.3.11 北京现代 91
3.3.12 广东丰田 93
3.3.13 上海汽车 95
3.3.14 海南马自达 97
3.3.15 东南汽车 99
3.3.16 东风起亚悦达 101
3.3.17 天津一汽 103
3.3.18 比亚迪汽车 105
3.3.19 华晨金杯 107
3.3.20 长安汽车 109
3.3.21 长安铃木 111
3.3.22 南汽雅途 113
第四章 汽车生产厂商渠道趋势分析 116
4.1基本型乘用车区域市场渠道拓展策略分析 116
4.2汽车销售渠道变革分析 122
Contents
1. Analysis of Output and Sales of China Passenger Car Market, 2003-2007
1.1 Output of China Passenger Cars, 2003-2007
1.2 Sales of Passenger Cars in China, 2003-2007
1.3 Top 10 Passenger Car Producers in Terms of Sales, 2005-2007
1.3.1 FAW Volkswagen
1.3.2 Shanghai Volkswagen
1.3.3 Shanghai GM
1.3.4 Chery
1.3.5 FAW Toyota
1.3.6 Dongfeng Nissan
1.3.7Guangzhou Honda
1.3.8 Geely
1.3.9 Changan Ford
1.3.10 Citroen
2. Major Regional Sales of Passenger Cars in China in 2007
2.1 Market Division of China Passenger Cars
2.1.1 Market Division Basis of China Passenger Cars
2.1.2 Division of Regional Market of China Passenger Cars
2.2 Major Urban Markets of China Passenger Cars
2.2.1 Beijing
2.2.2 Shanghai
2.2.3 Guangzhou
2.2.4 Shenzhen
2.2.5 Chengdu
2.2.6 Chongqing
2.2.7 Dongguan
2.2.8 Haikou
2.2.9 Fuzhou
2.2.10 Tianjin
3. Distribution Channels of China Passenger Cars in 2007
3.1 Overall Analysis of China Auto Distribution Channels
3.2 Characteristics of China Auto Distribution Channels
3.3 Distribution Channels of China Major Auto Manufacturers
3.3.1 FAW-Volkswagen
3.3.2 FAW Toyota
3.3.3Shanghai Volkswagen
3.3.4 Citroen
3.3.5 SAIC-GM
3.3.6 Dongfeng Nissan
3.3.7 Changan Ford
3.3.8 Chery
3.3.9 Geely Car
3.3.10 Guangzhou Honda
3.3.11 Beijing Hyundai
3.3.12 Guangzhou Toyota
3.3.13 Shanghai Automotive
3.3.14 Hainan Mazda
3.3.15 Dongnan Automobile
3.3.16 Dongfeng Yuedakia 3.3.17 Tianjin FAW
3.3.18 BYD Auto
3.3.19 Huachen Jinbei
3.3.20 Changan Automobile
3.3.21 Changan Suzuki
3.3.22 Nanjing Soyat
4. Developing Trend of Market Channels of China Auto Manufacturers
4.1 Strategies for Extending Regional Market Channels of China Passenger Cars
4.2 Reform of China Auto Distribution Channels