|
|
|
报告导航:研究报告—
制造业—化工
|
|
2011年中国污水处理行业研究报告 |
 |
字数:2.3万 |
页数:75 |
图表数:74 |
|
中文电子版:7000元 |
中文纸版:3500元 |
中文(电子+纸)版:7500元 |
|
英文电子版:1900美元 |
英文纸版:2000美元 |
英文(电子+纸)版:2200美元 |
|
编号:ZJF23
|
发布日期:2011-06 |
附件:下载 |
 |
|
|
随着中国工业化水平的提高,污水排放量也出现不断上涨的趋势。2001年中国的污水排放量为428.4亿吨,到2010年这一数字已经达到617.3亿吨,平均每年大约增加18.9亿吨。2010年比2009年增长28.1亿吨,为2005年以来增长量最大的一年。 不断增加的污水主要来自生活污水的增加,2001-2010年期间,生活污水由227.7亿吨增加到379.8亿吨,平均每年增加约15.2亿吨,而工业污水每年的增加量不到它的1/4,约为3.7亿吨。 污水排放量的急剧增加给各级城市带来极大的负担,而另一方面也给污水处理行业带来机遇。近年来中国各地的污水处理厂建设发展很快,2003年中国污水日处理能力为4682万立方米,到2010年中国污水日处理能力已经增长到1.25亿立方米。
图:2005-2010年中国城市污水处理厂日处理能力(百万m3) 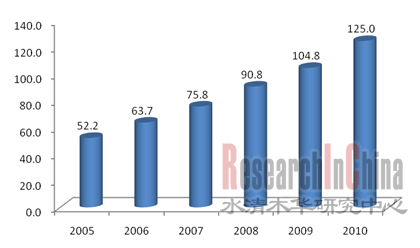 来源:国家环保局、水清木华研究中心 在污水处理厂建设方面,截至2010年中国累计建成城镇污水处理厂2,832座。正在建设的城镇污水处理项目达1,600个,总设计能力约3,900万立方米/日。 中国城市污水处理率由2005 年的52%提高到2010年的75%以上,预计将这一数字将在未来几年进一步提高到85%。加之污水处理费用的增加,以及大量落后的污水处理厂的退出和更新,污水处理市场潜力依然巨大。 首创股份(Beijing Capital Co., Ltd)在北京、天津、湖南、山西、安徽等14个省34个城市拥有水务项目,污水处理能力超过573万吨/日。 北控水务在北京、广东等城市拥有及经营70多座自来水和污水处理厂,实际污水处理能力253万吨/日。 桑德环保集团:污水处理相关业务由桑德环保集团出标获得污水处理项目,然后由桑德国际优先获取这些项目的EPC分包业务,两家公司同时也做BOT业务。该集团污水处理项目区域包括华中、北京以及内蒙。 碧水源(Origin Water)在大中型MBR污水处理项目中市场占有率排名第一。
With the advancement of industrialization in China, the sewage discharge also witnesses a rising trend, from 42.84 billion tons in 2001 to 61.73 billion tons in 2010, with an annual increase of approximately 1.89 billion tons on average. In 2010, it increased by 2.81 billion from a year earlier, the biggest growth since 2005. The increased sewage mainly comes from the growing domestic sewage. During 2001-2010, the domestic sewage rose from 22.77 billion tons to 37.98 billion tons, an average increase of roughly 1.52 billion tons each year, while the annual increase of industrial sewage is less than 1/4 of the former, about 370 million tons. The surge of sewage discharge brought along heavy burden on the cities at all levels, but it also created opportunities for the sewage treatment industry. In recent years, the sewage treatment plants around China saw a construction boom, and the daily sewage treatment capacity soared to 125 million m3 in 2010 from 46.82 million m3 in 2003.
Daily Treatment Capacity of Urban Sewage Treatment Plants in China, 2005-2010 (million m3) 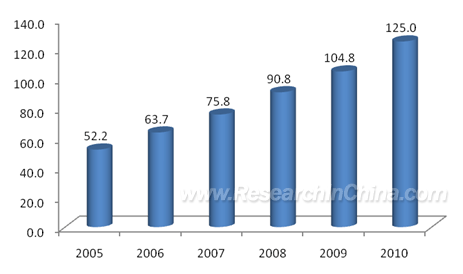 Source: Ministry of Environmental Protection of the People’s Republic of China; ResearchInChina Concerning the construction of sewage treatment plants, there had been 2,832 urban sewage treatment plants constructed by 2010, while another 1,600 projects are under construction, with the designed capacity of around 39.00 million m3/day. In China, the urban sewage treatment rate has rose from 52% in 2005 to over 75% in 2010, and it is expected to achieve 85% in the coming years. Moreover, the hike of the sewage treatment cost and the withdrawal and update of many laggard sewage treatment plants indicate still a large potential for the sewage treatment market. Beijing Capital Co., Ltd. owns water projects in 14 provinces and 34 cities including Beijing, Tianjin, Hunan, Shanxi and Anhui, with sewage treatment capacity in excess of 5.73 million tons/day. Beijing Enterprises Water Group Limited possesses and operates more than 70 tap water and sewage treatment plants in Beijing, Guangdong and other cities, with real sewage treatment capacity of 2.53 million tons/day. Beijing Sound Environment Group Co., Ltd.: for the business related to sewage treatment, Beijing Sound Environment Group Co., Ltd. will submit a tender to win the sewage treatment project, then Sound Global Limited has the priority to get EPC subcontracting business of these projects, meanwhile, the two companies also undertake BOT business. The Group’s sewage treatment projects cover Central China, Beijing and Inner Mongolia.
Beijing Originwater Technology Co., Ltd. (Origin Water) boasts No.1 market share amid the middle-and large-scale MBR sewage treatment projects.
第一章 中国水资源现状
1.1 中国水资源概况
1.1.1 中国水资源拥有概况
1.1.2 水资源利用情况
1.2 中国水资源污染情况
1.2.1 中国水污染现状
1.2.2 中国污水排放情况
第二章 中国污水处理行业现状
2.1 污水处理行业
2.1.1 污水处理市场分析
2.1.2 污水处理市场规模
2.2 污水处理厂
2.3 污水处理设备市场
2.4 污水处理行业政策导向
2.5 市场竞争特点
2.6 重点城市污水治理情况
第三章 污水处理行业技术与投资模式
3.1 污水处理技术介绍
3.2 污水处理行业投资模式
3.2.1 BOT模式
3.2.2 BT模式
3.2.3 TOT模式
第四章 重点企业分析
4.1 同方股份
4.2 北京城市排水集团
4.2.1 集团概况
4.2.2 集团污水处理业务概况
4.3 中国光大国际有限公司
4.3.1 公司概况
4.3.2 公司运营情况
4.3.3 污水处理业务情况
4.4 桑德环保
4.4.1 集团概况
4.4.2 桑德环境
4.4.3 桑德国际
4.5 创业环保
4.5.1 公司概况
4.5.2 公司经营情况分析
4.5.3 公司污水处理业务情况
4.6 首创股份
4.6.1 公司概况
4.6.2公司经营情况分析
4.6.3 首创股份污水处理业务情况
4.7 北控水务
4.7.1 公司概况
4.7.2公司经营情况分析
4.7.3 北控水务污水处理业务情况
4.8 南海发展
4.8.1 公司概况
4.8.2 公司经营情况分析
4.8.4 公司污水处理业务情况
4.9 武汉控股
4.9.1 公司概况
4.9.2公司经营情况分析
4.9.3 公司污水处理业务情况
4.10 重庆水务
4.10.1 公司概况
4.10.2 公司经营情况分析
4.10.3 公司污水处理业务情况
4.11 中原环保
4.11.1公司概况
4.11.2 公司经营情况分析
4.11.3 公司污水处理业务情况
4.12 洪城水业
4.12.1公司概况
4.12.2 公司经营情况分析
4.12.3 公司污水处理业务情况
4.13 兴蓉投资
4.13.1公司概况
4.13.2 公司经营情况分析
4.13.3 公司污水处理业务情况
4.14 碧水源
4.14.1 公司概况
4.14.2 公司经营情况分析
4.14.3 公司污水处理相关业务情况
4.15 联合环保技术
4.15.1 公司概况
4.15.2 公司经营情况分析
第五章 污水处理行业的机会与风险
5.1 污水处理行业投资机会
5.1.1 建设环保型社会带来的投资机会
5.1.2 市场准入放开带来的投资机会
5.1.3 污水处理费和排污费提高带来的投资机会
5.2 污水处理行业投资风险
5.2.1 地区经济发展及企业信用度
5.2.2 政府支持意愿
5.2.3 建设项目规划
5.3 对投资者的建议
5.3.1 重点投资方向
5.3.2 重点投资地区
5.3.3 防范风险的措施
5.4 对银行信贷的建议
5.4.1 信贷风险判断
5.4.2 信贷时机选择
5.4.3 信贷方式选择
1.Water Resources in China
1.1 Overview
1.1.1 Reserves of Water Resources in China
1.1.2 Utilization of Water Resources
1.2 Pollution of Water Resources in China
1.2.1 Status Quo
1.2.2 Sewage Discharge
2. Status Quo of China Sewage Treatment Industry
2.1 Sewage Treatment Industry
2.1.1 Analysis on Sewage Treatment Market
2.1.2 Size of Sewage Treatment Market
2.2 Sewage Treatment Plant
2.3 Sewage Treatment Equipment Market
2.4 Policy Guidance on Sewage Treatment Industry
2.5 Characteristics of Market Competition
2.6 Sewage Treatment in Key Cities
3. Technologies and Investment Modes of Sewage Treatment Industry
3.1 Technologies
3.2 Investment Modes
3.2.1 BOT
3.2.2 BT
3.2.3 TOT
4. Key Companies
4.1 Tsinghua Tongfang Water Engineering Co., Ltd.
4.2 Beijing Drainage Group Co., Ltd.
4.2.1 Profile
4.2.2 Sewage Treatment Business
4.3 China Everbright International Limited
4.3.1 Profile
4.3.2 Operation
4.3.3 Sewage Treatment Business
4.4 Beijing Sound Environment Group Co., Ltd.
4.4.1 Profile
4.4.2 Sound Environmental Resources Co., Ltd.
4.4.3 Sound Global
4.5 Tianjin Capital Environmental Protection Group Company Limited
4.5.1 Profile
4.5.2 Operation
4.5.3 Sewage Treatment Business
4.6 Beijing Capital Co., Ltd
4.6.1 Profile
4.6.2 Operation
4.6.3 Sewage Treatment Business
4.7 Beijing Enterprises Water Group Limited (BEWG)
4.7.1 Profile
4.7.2 Operation
4.7.3 Sewage Treatment Business
4.8 Nanhai Development Co., Ltd.
4.8.1 Profile
4.8.2 Operation
4.8.4 Sewage Treatment Business
4.9 Wuhan Sanzhen Industry Holding Co., Ltd.
4.9.1 Profile
4.9.2 Operation
4.9.3 Sewage Treatment Business
4.10 Chongqing Water Group Co, Ltd.
4.10.1 Profile
4.10.2 Operation
4.10.3 Sewage Treatment Business
4.11 Zhong Yuan Environment Protection Co., Ltd.
4.11.1 Profile
4.11.2 Operation
4.11.3 Sewage Treatment Business
4.12 Jiangxi Hongcheng Waterworks Co., Ltd.
4.12.1 Profile
4.12.2 Operation
4.12.3 Sewage Treatment Business
4.13 Chengdu Xingrong Investment Co., Ltd.
4.13.1 Profile
4.13.2 Operation
4.13.3 Sewage Treatment Business
4.14 Origin Water
4.14.1 Profile
4.14.2 Operation
4.14.3 Business Related to Sewage Treatment
4.15 United Envirotech Ltd.
4.15.1 Profile
4.15.2 Operation
5. Opportunities and Risks in Sewage Treatment Industry
5.1 Investment Opportunities
5.1.1 Opportunities from Building Environment-friendly Society
5.1.2 Opportunities from Market Access
5.1.3 Opportunities from Rise in Sewage Treatment Fee and Sewage Charge
5.2 Investment Risks
5.2.1 Regional Economic Development and Enterprise Credit Standing
5.2.2 Government’s Support Willing
5.2.3 Construction Project Planning
5.3 Suggestions to Investors
5.3.1 Key Investment Directions
5.3.2 Key Investment Regions
5.3.3 Risk Prevention Measures
5.4 Suggestions on Bank Credit
5.4.1 Judgment of Credit Risk
5.4.2 Selection of Credit Opportunities
5.4.3 Selection of Credit Ways
图:各国人均数资源占有量对比(m3)
图:2004-2010年中国水资源总量(m3 bln)
图:2004-2010年中国总供水量变化(m3 bln)
图:2004-2010年中国总用水量变化(m3 bln)
图:2004-2009年中国人均用水量(m3)
图:2004-2010年中国千元国内生产总值用水量(m3)
图:2009年中国主要河流水质类别比例
表:2009年中国主要湖泊水质情况
图:2004-2010年中国废污水排放总量(tonne bln)
图:2004-2010年中国工业废水和生活污水排放量对比(tonne bln)
图:2004-2009年中国治理废水投资总额(CNY bln)
图:2004-2010年中国城市污水处理厂日处理能力(m3 mln)
图:2004-2010年中国城市污水处理率
表:2009-2010年中国污水处理行业财务数据(CNY mln)
表:2009-2010年中国污水处理及再生利用市场规模
图:2003-2010年中国城市污水处理厂数量
表:2009年各省主要污水处理厂数量
表:2009年中国各省主要污水处理厂设计处理总能力及实际处理量
表:2009-2010年中国环保设备销售情况
表:2004-2010年上海污水排放与处理情况
表:2004-2009年广东省污水排放情况
表:2004-2009年广东省污水处理情况
图:中国各种污水处理工艺市场占比
图:清华同方水务工程公司旗下污水处理厂模式分布
表:清华同方水务工程公司污水处理厂列表
表:北京城市排水集团概况
表:北京城市排水集团旗下污水处理厂概况
图:2006-2010年光大国际营业额(HKD mln)
图:2006-2010年光大国际污水处理业务分行业营业额(HKD mln)
图:2006-2010年光大国际污水处理业务营业额(HKD mln)
表:中国光大国际有限公司主要污水处理厂列表
表:桑德环境主要业务范围
图:2006-2010年桑德环境营业状况变化(CNY mln)
图:2006-2010年桑德环境水务行业收入变化(CNY mln)
图:2006-2010年桑德环境主营业务分地区收入情况(CNY mln)
图:2006-2010年桑德国际营业状况变化(CNY mln)
图:2007-2010年桑德国际主要EPC业务收入变化(CNY mln)
图:2006-2010年天津创业环保营业收入与利润总额(CNY mln)
表:2006-2010年天津创业环保分行业主营业务收入(CNY mln)
表:2008-2010年天津创业环保分地区主营业务收入(CNY mln)
图:2006-2010年天津创业环保历年污水处理能力变化
表:创业环保污水处理厂列表
图:2006-2010年首创股份业务收入和利润状况(CNY mln)
图:2010年首创股份销售收入构成(CNY mln)
表:2010年首创股份销售地区构成
图:2005-2010年首创股份日水处理能力(K tonne)
表:截止2010年末的首创股份污水主要处理项目列表
图:2008-2010年北控水务业务收入和利润状况(HKD mln)
图:2010年北控水务营业收入构成(HKD mln)
图:2008-2010年北控水务污水日处理能力以及年处理量
表:2010年末的北控水务污水主要处理项目分布
图:2004-2010年南海发展业务收入及利润统计表(CNY mln)
图:2010年南海发展营业构成(CNY mln)
表:2009-2010年南海发展污水处理状况
表:目前南海发展主要的污水处理项目
图:2004-2010年武汉控股销售收入及利润变化(CNY mln)
图:2010年武汉控股业务构成(CNY mln)
图:2005-2010年武汉控股历年污水处理量变化(tonne mln)
图:2007-2010年重庆水务销售收入及利润变化(CNY mln)
图:2010年重庆水务业务构成(CNY mln)
图:2005-2010年重庆水务历年污水处理量变化(m3 mln)
图:2007-2010年中原环保销售收入及利润变化(CNY mln)
图:2010年中原环保业务构成(CNY mln)
图:2007-2010年中原环保污水处理业务收入(CNY mln)
图:2007-2010年洪城水业营业收入及利润变化(CNY mln)
图:2010年洪城水业业务构成(CNY mln)
图:2006-2010年洪城水业历年污水处理量变化(m3 mln)
图:2007-2010年兴蓉投资营业收入及利润变化(CNY mln)
表:兴蓉投资主要污水处理厂概况
图:2005-2010年碧水源营业收入及利润变化(CNY mln)
图:2010年碧水源业务构成(CNY mln)
图:2005-2010年碧水源MBR业务收入变化(CNY mln)
图:2009-2011财年联合环保技术经营业绩变化(USD K)
图:2010年联合环保技术收入构成(USD K)
Per Capital Water Resource Possession by Country
Total Water Reserves of China, 2004-2010
Total Water Supply of China, 2004-2010
Total Water Consumption of China, 2004-2010
Average per Capital Water Consumption in China, 2004-2009
Water Consumption Per 1,000 Yuan of GDP in China, 2004-2010
Proportions of Water Quality Types of Major Rivers in China, 2009
Water Quality of Main Lakes in China, 2009
Sewage Discharge Volume in China, 2004-2010
Discharge Volume of Industrial Wastewater and Domestic Sewage in China, 2004-2010
Total Investment in Sewage Treatment in China, 2004-2009
Daily Disposal Capacity of Urban Sewage Treatment Plants in China, 2005-2010
Urban Sewage Treatment Rate in China, 2004-2010
Financial Data of China Sewage Treatment Industry, 2009-2010
China Sewage Treatment and Recycling Market Size, 2009-2010
Number of Urban Sewage Treatment Plants in China, 2003-2010
Number of Sewage Treatment Plants in Provinces of China, 2009
Designed Processing Capacity and Real Treatment Volume of Main Sewage Treatment Plants in Provinces of China,. 2009
Sales of Environmental Protection Equipment in China, 2009-2010
Sewage Discharge and Disposal in Shanghai, 2004-2010
Sewage Discharge in Guangdong Province, 2004-2009
Sewage Disposal in Guangdong Province, 2004-2009
China Sewage Treatment Market by Technology
Modes of Sewage Treatment Plants of Tsinghua Tongfang Water Engineering Co., Ltd.
List of Sewage Treatment Plants of Tsinghua Tongfang Water Engineering Co., Ltd
Overview of Beijing Drainage Group
Sewage Treatment Plants Subordinated to Beijing Drainage Group
Turnover of China Everbright International Limited, 2006-2010
Sewage Treatment Business Turnover of China Everbright International Limited by Sector, 2006-2010
Sewage Treatment Business Turnover of China Everbright International Limited, 2006-2010
Main Sewage Treatment Plants of China Everbright International Limited
Main Business Scope of Sound Environment
Operation of Sound Environment, 2006-2010
Revenue from Water Sector of Sound Environment, 2006-2010
Operating Income of Sound Environment by Region, 2006-2010
Operation of Sound Global, 2006-2010
Revenue from Major EPC Business of Sound Global, 2007-2010
Operating Income and Total Profit of Tianjin Capital Environmental Protection Group Co., Ltd, 2006-2010
Operating Income of Tianjin Capital Environment Protection Group Co., Ltd by Sector, 2006-2010
Operating Income of Tianjin Capital Environment Protection Group Co., Ltd by Region, 2008-2010
Sewage Treatment Capability of Tianjin Capital Environmental Protection Group Co., Ltd, 2006-2010
Sewage Treatment Plants of Tianjin Capital Environmental Protection Group Co., Ltd
Operating Revenue and Profits of Beijing Capital, 2006-2010
Revenue Structure of Beijing Capital, 2010
Marketing Regions of Beijing Capital, 2010
Daily Water Treatment Capacity of Beijing Capital, 2005-2010
Main Treatment Projects of Beijing Capital as of the end of 2010
Operating Income and Profit of BEWG, 2008-2010
Operating Income Structure of BEWG, 2010
Daily Sewage Treatment Capacity and Annual Sewage Treatment of BEWG, 2008-2010
Main Treatment Projects of BEWG as of the end of 2010
Operating Income and Profit of Nanhai Development, 2004-2010
Business Structure of Nanhai Development, 2010
Sewage Treatment of Nanhai Development, 2009-2010
Main Sewage Treatment Projects of Nanhai Development at Present
Sales and Profit of Wuhan Sanzhen Industry Holding Co., Ltd, 2004-2010
Mix of Businesses of Wuhan Sanzhen Industry Holding Co., Ltd, 2010
Sewage Treatment Volume of Wuhan Sanzhen Industry Holding Co., Ltd, 2005-2010
Sales and Profit of Chongqing Water Group, 2007-2010
Mix of Businesses of Chongqing Water Group, 2010
Sewage Treatment Volumes of Chongqing Water Group, 2005-2010
Sales and Profit of Zhongyuan Environment Protection Co., Ltd , 2007-2010
Mix of Businesses of Zhongyuan Environment Protection Co., Ltd, 2010
Operating Income and Profit of Hongcheng Waterworks, 2007-2010
Mix of Businesses of Hongcheng Waterworks, 2010
Sewage Treatment Volumes of Hongcheng Waterworks, 2006-2010
Operating Income and Profit of Xingrong Investment, 2007-2010
Main Sewage Treatment Plants of Xingrong Investment
Operating Income and Profit of Origin Water, 2005-2010
Mix of Businesses of Origin Water, 2010
MBR Business Income of Origin Water, 2005-2010
Performance of United Envirotech Co., Ltd, FY2009-FY2011
Revenue Structure of United Envirotech Co., Ltd., 2010
如果这份报告不能满足您的要求,我们还可以为您定制报告,请 留言说明您的详细需求。
|