|
|
|
报告导航:研究报告—
制造业—汽车
|
|
2017-2021年中国汽车经销及汽车后市场行业研究报告 |
 |
字数:5.1万 |
页数:155 |
图表数:184 |
|
中文电子版:11000元 |
中文纸版:5500元 |
中文(电子+纸)版:11500元 |
|
英文电子版:3200美元 |
英文纸版:3400美元 |
英文(电子+纸)版:3500美元 |
|
编号:ZLC063
|
发布日期:2018-01 |
附件:下载 |
 |
|
|
近年来,在下游需求的推动下,中国新车和二手车销量均稳步增长。2017年1-11月,中国新车销量达2584万辆,同比增长3.6%;二手车交易量达1117万辆,同比增长达20%。
同时,中国汽车经销渠道也开始向多样化发展,4S店模式逐步被汽车电商、汽车超市等经营模式所替代,2016年中国4S店数量约22753家,同比减少147家,估计2017年继续减少至22550家。
目前,中国汽车经销行业竞争激烈,行业比较分散。2016年,中国汽车经销商百强汽车销量合计达783万辆,占汽车总销量(含二手车)的20.4%。截至2016年底,中国汽车经销商百强集团4S网点数量达6014家,约占全国4S店总量的26.4%。
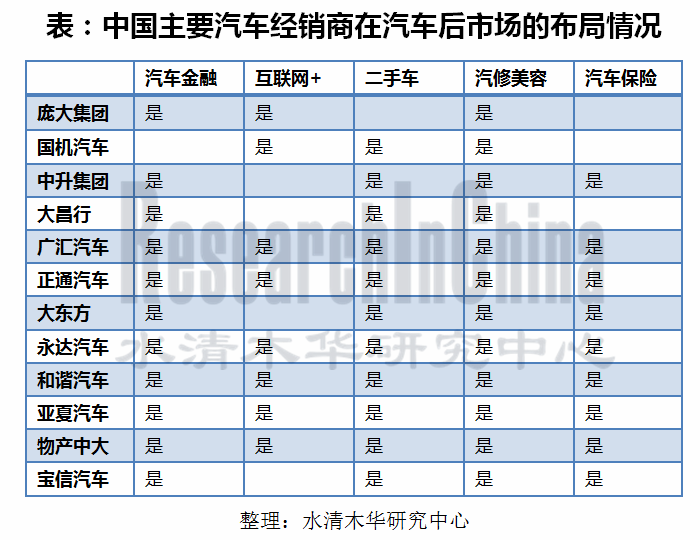
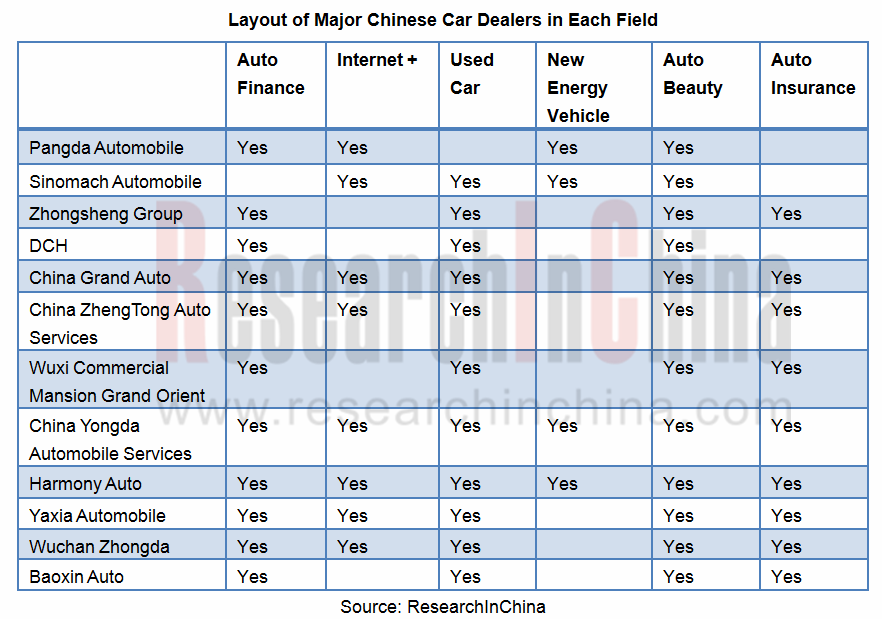
由于整车销售毛利率基本不到5%,而售后服务毛利率基本高达40%以上,近年来,中国汽车经销都纷纷拓展汽车后市场以满足盈利需求。
目前,中国汽车经销行业发展趋势主要表现为:
一、行业并购不断:目前,大型汽车经销商除新建部分汽车经销网点外,主要通过并购的方式实现经销网络扩张。如2017上半年,永达汽车收购9家4S店和1家城市展厅;宝信汽车收购6家4S店和1家展厅等;
二、汽车经销互联网化:互联网的深入发展带动人们生活消费习惯的改变,汽车电商迅速崛起。目前,除传统汽车经销商开始布局互联网+以外,其它一些企业也积极推出互联网+的汽车经销方式抢占市场。如:大搜车、瓜子二手车、优信、国美等企业纷纷推出线上购车服务。
三、汽车金融推动行业发展:汽车金融的迅速发展让更多的人买得起车,尤其是大搜车、瓜子二手车等推出的“零首付、一成首付”等新金融模式使得买车更为容易,带动了用户的购车欲望,推动了汽车经销行业的发展。
四、二手车销量增长:新车市场的发展使得汽车保有量稳步上升,为二手车的发展提供了发展空间。在二手车限迁政策以及二手车电商模式逐步成熟的推动下,中国二手车交易量将稳步增长,预计到2021年中国二手车交易有望达到2096万辆。
《2017-2021年中国汽车经销及汽车后市场行业研究报告》主要包括以下内容:
 中国汽车经销行业概况,包括经销模式、盈利模式、竞争格局及发展趋势分析; 中国汽车经销行业概况,包括经销模式、盈利模式、竞争格局及发展趋势分析;
中国新车销售、二手车销售、汽车金融、汽修美容及汽车保险市场分析,主要包括发展现状、市场规模、竞争格局、发展趋势分析等;
14家汽车经销企业分析,包括经营情况、营收构成、毛利率、汽车经销业务及汽车后市场业务分析。
In China, new car sales and used car sales have been growing progressively thanks to robust demand over recent years. From January to November of 2017, China sold 25.84 million new cars, edging up 3.6% year on year, and traded 11.17 million used cars, soaring by 20% year on year.
The channels for automotive distribution in China tend to be diversified. The 4S store mode has been by degrees replaced by business modes like automobile e-commerce and automobile supermarket, with the number of 4S stores in China decreasing by 147 from the total 22,753 in 2016 and expected to further drop to 22,550 in 2017.
There is currently a cut-throat competition in Chinese automotive distribution industry which features a low concentration ratio. In 2016, the automobile sales of top 100 Chinese car dealers footed up to 7.83 million units, seizing 20.4 percent of total automobile sales (inclusive of used cars). As of the end of 2016, the top 100 Chinese car dealers had been in possession of 6,014 4S outlets in all, accounting for 26.4 percent of national total number of 4S stores.
By comparison with car sales with the gross margin of less than 5%, the after-sale services enjoy a gross margin of at least 40%. It is in the recent years that Chinese car dealers have explored the lucrative automobile aftermarket successively.
Chinese automotive distribution industry is evolving towards:
i) Frequent mergers and acquisitions: the car dealer powers not also build new outlets but initiate M&As to expand their coverage. For instance, in the first half of 2017, China Yongda Automobile Services acquired nine 4S stores and one urban exhibition hall; and Baoxin Auto purchased six 4S stores and one exhibition hall.
ii) The networking of automotive distribution: the advancement of the internet leads to changes in the consumers’ habits; automobile e-commerce springs up. To date, the traditional car dealers have made presence in the Internet +, so have the other entrants to seize more market shares. Take example for souche.com, Guazi.com, xin.com, and GOME that have launched online car purchase services in succession.
iii) Automotive finance’ impetus: the burgeoning automotive finance makes cars affordable for more people, particularly the new means like “zero down payment” and “10% down payment” launched by souche.com and Guazi.com make a car purchase be a piece of cake, arouse more wishes to have a car, which beyond doubt facilitates the development of automotive distribution industry.
iv) A surge in used car sales: the growth of new car market conduces to a steady rise in car ownership, providing the space for the development of used cars. Being pushed forward by the policy of limited migration for used cars (limited migration refers to the fact that the cars with low emission standards in one place are limited to be migrated into another place in China; limited migration of used cars have been cancelled in more and more places across China) and the growing maturity of used car e-commerce, the used car trade will be on a steady rise in China, and a total of 20.96 million used cars will be traded in 2021.
China Automotive Distribution and Aftermarket Industry Report, 2017-2021 sheds light on the followings:
 China automotive distribution industry (distribution modes, profit models, competitive landscape and development trend); China automotive distribution industry (distribution modes, profit models, competitive landscape and development trend);
Analysis of new car sales, used car sales, automotive finance, car repair & beauty and automotive insurance markets (status quo, market size, competition, development tendency, etc.);
14 automotive distribution enterprises (operation, revenue structure, gross margin, automotive distribution business and automotive aftermarket business).
第一章 概述
1.1 发展历程
1.2 经销模式
1.2.1 主要营销模式
1.2.2 营销模式特点
1.2.3 进口汽车经销模式
1.3 汽车后市场
1.3.1 市场现状
1.3.2 主要渠道
1.3.3 发展现状
第二章 中国汽车经销行业概况
2.1 经销模式
2.1.1 乘用车经销模式
2.1.2 商用车经销模式
2.2 盈利模式
2.3 竞争格局
2.3.1 百强总体收入情况
2.3.2 企业经营对比
2.3.3 企业经销渠道对比
2.4 发展趋势
2.4.1 产业并购不断市场集中度进一步提升
2.4.2 加大力度拓展汽车后市场
2.4.3 汽车经销向“互联网+”发展
2.4.4 二胎政策推动行业发展
2.4.5 二手车销量增长
2.4.6 汽车金融的迅速发展推动汽车经销行业发展
2.4.7 4S店模式逐渐衰落
第三章 中国新车销售市场分析
3.1 汽车市场
3.1.1 产销量
3.1.2 销量结构
3.2 乘用车市场
3.2.1 产销量
3.2.2 销量结构
3.3 商用车市场
3.3.1 产销量
3.3.2 销量结构
3.4 新能源汽车
3.4.1 产销量
3.4.2 发展前景
第四章 中国二手车销售市场分析
4.1 市场现状
4.2 经销模式
4.3 交易情况
4.3.1 整体市场
4.3.2 市场结构
4.3.3 区域市场
4.4 竞争格局
4.5 发展前景
4.5.1 取消二手车限迁政策利好行业发展
4.5.2 二手车电商模式推进行业发展
4.5.3 二手车交易量预测
第五章 中国汽车金融市场分析
5.1 发展现状
5.2 市场规模
5.3 竞争格局
5.4 汽车金融公司经营情况
5.5 发展趋势
5.5.1 国内整车厂商加速布局汽车金融领域
5.5.2 汽车金融公司市场份额进一步增长
5.5.3 二手车金融业务快速增长
5.5.4 汽车金融产品进一步丰富
5.5.5 信用体系进一步完善推动汽车金融市场发展
5.5.6 汽车互联网金融成发展趋势
5.5.7 银行与企业合作推动汽车金融发展
5.5.8 行业竞争加剧
第六章 中国汽修美容市场分析
6.1 市场规模
6.2 投融资分析
6.3 竞争格局
6.4 渠道分析
6.5 区域分析
6.6 发展趋势
6.6.1 总体发展趋势
6.6.2 渠道发展趋势
6.7 互联网+汽修美容
6.7.1 发展现状
6.7.2 经营模式
6.7.3 竞争格局
第七章 中国汽车保险市场分析
7.1 发展现状
7.2 市场规模
7.3 竞争格局
第八章 中国主要汽车经销商
8.1 庞大集团
8.1.1 公司简介
8.1.2 经营模式及盈利模式
8.1.3 经营情况
8.1.4 营收构成
8.1.5 毛利率
8.1.6 布局情况
8.1.7 销量
8.1.8 客户情况
8.1.9 新能源汽车业务
8.1.10 汽车金融业务
8.1.11 其它汽车后市场业务
8.2 国机汽车
8.2.1 公司简介
8.2.2 经营情况
8.2.3 营收构成
8.2.4 毛利率
8.2.5 销量
8.2.6 进口汽车业务
8.2.7 汽车零售业务
8.2.8 汽车后市场业务
8.3 中升集团
8.3.1 公司简介
8.3.2 经营情况
8.3.3 营收构成
8.3.4 毛利率
8.3.5 销量
8.3.6 布局情况
8.3.7 发展动态
8.4 大昌行
8.4.1 公司简介
8.4.2 经营情况
8.4.3 营收构成
8.4.4 毛利率
8.4.5 汽车经销业务
8.4.6 布局情况
8.4.7 发展情况
8.5 广汇汽车
8.5.1 公司简介
8.5.2 经营情况
8.5.3 营收构成
8.5.4 毛利率
8.5.5 布局情况
8.5.6 汽车经销业务
8.5.7 二手车业务
8.5.8 其它汽车后市场业务
8.6 正通汽车
8.6.1 公司简介
8.6.2 经营情况
8.6.3 营收构成
8.6.4 毛利率
8.6.5 布局情况
8.6.6 汽车经销业务
8.6.7 汽车后市场业务
8.7 永达汽车
8.7.1 公司简介
8.7.2 经营情况
8.7.3 营收构成
8.7.4 毛利率
8.7.5 布局情况
8.7.6 汽车经销业务
8.7.7 汽车后市场业务
8.7.8 发展战略
8.8 大东方
8.8.1 公司简介
8.8.2 经营情况
8.8.3 营收构成
8.8.4 毛利率
8.8.5 汽车经销业务
8.9 宝信汽车
8.9.1 公司简介
8.9.2 经营情况
8.9.3 营收构成
8.9.4 毛利率
8.9.5 汽车经销业务
8.9.6 汽车后市场业务
8.10 和谐汽车
8.10.1 公司简介
8.10.2 经营情况
8.10.3 营收构成
8.10.4 毛利率
8.10.5 汽车经销业务
8.10.6 汽车金融业务
8.10.7 发展战略
8.11 亚夏汽车
8.11.1 公司简介
8.11.2 经营情况
8.11.3 营收构成
8.11.4 毛利率
8.11.5 汽车经销业务
8.11.6 汽车后市场业务
8.12 物产中大
8.12.1 公司简介
8.12.2 经营情况
8.12.3 营收构成
8.12.4 汽车经销业务
8.13 利星行
8.13.1 公司简介
8.13.2 汽车经销业务
8.14 恒信汽车
8.14.1 公司简介
8.14.2 汽车经销业务
1. Overview
1.1 Development History
1.2 Distribution Pattern
1.2.1 Main Marketing Models
1.2.2 Characteristics of Marketing Models
1.2.3 Imported Car Distribution Pattern
1.3 Automotive Aftermarket
1.3.1 Market Situation
1.3.2 Main Channels
1.3.3 Status Quo
2. Overview of Automotive Distribution Industry in China
2.1 Distribution Model
2.1.1 Passenger Car Distribution Model
2.1.2 Commercial Vehicle Distribution Model
2.2 Profit Model
2.3 Competitive Landscape
2.3.1 Revenue of Top 100 Companies
2.3.2 Comparison by Enterprises’ Operation
2.3.3 Comparison by Distribution Channels
2.4 Development Trends
2.4.1 Continuous Industrial M&As Further Raise Market Concentration
2.4.2 More Efforts to Expand Automotive Aftermarket
2.4.3 Automotive Distribution Heads towards "Internet +"
2.4.4 Second Child Policy Promotes the Development of the Industry
2.4.5 Used Car Sales Volume Grows
2.4.6 The Rapid Development of Automotive Finance Boosts the Development of Automotive Distribution Industry
2.4.7 4S Stores Decline Gradually
3 Sales Market of New Vehicle in China
3.1 Automobile Market
3.1.1 Output
3.1.2 Sales Structure
3.2 Passenger Car Market
3.2.1 Output & Sales Volume
3.2.2 Sales Structure
3.3 Commercial Vehicle Market
3.3.1 Output & Sales Volume
3.3.2 Sales Structure
3.4 New Energy Vehicles
3.4.1 Output and Sales Volume
3.4.2 Prospects
4 Chinese Used Car Sales Market
4.1 Market Situation
4.2 Distribution Model
4.3 Transaction
4.3.1 Overall Market
4.3.2 Market Structure
4.3.3 Regional Market
4.4 Competitive Landscape
4.5 Prospects
4.5.1 Cancellation of Used Car Immigration Restriction Policy Favors the Development of the Industry
4.5.2 Used Car E-Business Model Promotes Market Development
4.5.3 Forecast for Used Car Trading Volume
5 Chinese Automotive Finance Market
5.1 Status Quo
5.2 Market Size
5.3 Competitive Landscape
5.4 Operation of Auto Finance Companies
5.5 Development Trends
5.5.1 Domestic OEMs Accelerate Their Presence in Auto Finance Field
5.5.2 Market Share of Auto Finance Companies Grows Further
5.5.3 Used Car Financial Business Grows Rapidly
5.5.4 Auto Financial Products Becomes More Diversified
5.5.5 Improved Credit System Pushes the Development of Auto Finance Market
5.5.6 Internet Auto Finance Has Developed into a Trend
5.5.7 Cooperation between Banks and Enterprises Drives Auto Finance
5.5.8 Competition in Auto Finance Industry Intensifies
6 Chinese Auto Repair & Beauty Market
6.1 Market Size
6.2 Investment and Financing
6.3 Competitive Landscape
6.4 Analysis of Channels
6.5 Regional Analysis
6.6 Development Trend
6.6.1 Overall
6.6.2 Channels
6.7 Internet + Auto Repair & Beauty
6.7.1 Status Quo
6.7.2 Business Model
6.7.3 Competitive Landscape
7 Chinese Auto Insurance Market
7.1 Status Quo
7.2 Market Size
7.3 Competitive Landscape
8 Majors Car Dealers in China
8.1 PANGDA Automobile Trade Group Co., Ltd.
8.1.1 Profile
8.1.2 Business Model and Profit Model
8.1.3 Operation
8.1.4 Revenue Structure
8.1.5 Gross Margin
8.1.6 Layout
8.1.7 Sales Volume
8.1.8 Customers
8.1.9 New Energy Vehicle Business
8.1.10 Auto Finance Business
8.1.11 Other Automotive Aftermarket Business
8.2 Sinomach Automobile Co., Ltd.
8.2.1 Profile
8.2.2 Operation
8.2.3 Revenue Structure
8.2.4 Gross Margin
8.2.5 Sales Volume
8.2.6 Imported Car Business
8.2.7 Auto Retail Business
8.2.8 Auto Aftermarket Business
8.3 Zhongsheng Group Holdings Limited
8.3.1 Profile
8.3.2 Operation
8.3.3 Revenue Structure
8.3.4 Gross Margin
8.3.5 Sales Volume
8.3.6 Layout
8.3.7 Development Dynamics
8.4 Dah Chong Hong Holdings Limited
8.4.1 Profile
8.4.2 Operation
8.4.3 Revenue Structure
8.4.4 Gross Margin
8.4.5 Automotive Distribution Business
8.4.6 Layout
8.4.7 Development
8.5 China Grand Automotive Services Co., Ltd.
8.5.1 Profile
8.5.2 Operation
8.5.3 Revenue Structure
8.5.4 Gross Margin
8.5.5 Layout
8.5.6 Automotive Distribution Business
8.5.7 Used Car Business
8.5.8 Other Auto Aftermarket Business
8.6 China ZhengTong Auto Services Holdings Limited
8.6.1 Profile
8.6.2 Operation
8.6.3 Revenue Structure
8.6.4 Gross Margin
8.6.5 Layout
8.6.6 Automotive Distribution Business
8.6.7 Auto Aftermarket Business
8.7 China Yongda Automobile Services Holdings Limited
8.7.1 Profile
8.7.2 Operation
8.7.3 Revenue Structure
8.7.4 Gross Margin
8.7.5 Layout
8.7.6 Automotive Distribution Business
8.7.7 Auto Aftermarket Business
8.7.8 Development Strategy
8.8 Wuxi Commercial Mansion Grand Orient Co., Ltd.
8.8.1 Profile
8.8.2 Operation
8.8.3 Revenue Structure
8.8.4 Gross Margin
8.8.5 Automotive Distribution Business
8.9 Baoxin Auto Group
8.9.1 Profile
8.9.2 Operation
8.9.3 Revenue Structure
8.9.4 Gross Margin
8.9.5 Automotive Distribution Business
8.9.6 Auto Aftermarket Business
8.10 Harmony Auto
8.10.1 Profile
8.10.2 Operation
8.10.3 Revenue Structure
8.10.4 Gross Margin
8.10.5 Automotive Distribution Business
8.10.6 Auto Finance Business
8.10.7 Development Strategy
8.11 Yaxia Automobile
8.11.1 Profile
8.11.2 Operation
8.11.3 Revenue Structure
8.11.4 Gross Margin
8.11.5 Automotive Distribution Business
8.11.6 Automotive Aftermarket Business
8.12 Materials Industry Zhongda Group Co., Ltd.
8.12.1 Profile
8.12.2 Operation
8.12.3 Revenue Structure
8.12.4 Automotive Distribution Business
8.13 Lei Shing Hong
8.13.1 Profile
8.13.2 Automotive Distribution Business
8.14 Hengxin Automotive
8.14.1 Profile
8.14.2 Automotive Distribution Business
图:中国汽车经销发展历程
图:中国汽车经销主要方式
表:中国各类汽车营销模式特点对比
图:进口与国产汽车经营模式对比
图:汽车后市场细分行业
图:2015-2021E中国汽车后市场规模
图:中国乘用车4S店建设流程
图:汽车4S 店建设成本构成
图:中国汽车经销服务范围
图:中国经销商新车销售业务盈利模式
表:经销商各类型汽车盈利能力对比
图:2010-2017年中国汽车经销商百强总收入及同比增长率
图:2010-2016年中国收入百亿以上的汽车经销商数量
图:2010-2016年中国汽车经销商百强榜首集团收入
图:2010-2016年中国汽车经销商百强整车销售量
表:2017年中国汽车经销商集团百强榜TOP20
图:2015-2016年中国主要汽车经销商新车销量对比
表:2013-2017年中国主要汽车经销商营业收入对比
表:2013-2017年中国主要汽车经销商净利润对比
表:2013-2017年中国主要汽车经销商汽车销售毛利率对比
表:2013-2017年中国主要汽车经销商售后服务毛利率对比
图:2015-2017年中国主要汽车经销商4S店数量对比
表:中国汽车经销行业并购案例
表:中国主要汽车经销商在汽车后市场的布局情况
表:中国汽车经销行业布局互联网+案例
图:2016-2021E中国二手车交易量及同比增长率
表:2017年中国汽车金融布局案例
图:2010-2017年中国4S店数量
图:2011-2017年中国汽车产量及同比增长率
图:2011-2017年中国汽车销量及同比增长率
图:2016-2021E中国汽车产销量
表:2017年1-10月中国国内汽车品牌前十生产企业销量TOP10(分车型)
图:2011-2017年中国汽车销量结构(分类型)
图:2016-2021年中国汽车销量结构(分类型)
图:2011-2017年中国乘用车产量及同比增长率
图:2011-2017年中国乘用车销量及同比增长率
图:2016-2021E中国乘用车产销量
表:2011-2017年中国乘用车销量(分类型)
图:2011-2017年中国乘用车销量结构(分类型)
表:2017年1-10月中国乘用车品牌销量TOP10(分车型)
图:2011-2017年中国商用车产量及同比增长率
图:2011-2017年中国商用车销量及同比增长率
图:2016-2021E中国商用车产销量
图:2011-2017年中国商用车销量(分类型)
图:2011-2017年中国商用车销量结构(分类型)
图:2011-2017年中国新能源汽车产销量
表:2016-2017年中国新能源汽车销量(分类型)
表:2016-2017年中国新能源汽车产量(分类型)
图:2012-2017年中国二手车与新车交易量比
图:全球主要国家二手车与新车交易量比
图:二手车市场发展阶段
图:中国二手车主要交易模式
表:主要国家二手车交易模式
图:2011-2017年中国二手车交易量及同比增长率
表:2014-2017年中国二手车交易量占比(分类型)
图:2017年1-11月中国二手车交易量占比(按使用年限)
图:2017年1-11月中国二手车交易量占比(按价格范围)
图:2015-2017年中国二手车交易量(分地区)
图:2017年1-11月中国二手车交易量占比(分地区)
表:中国主要汽车经销商集团在二手车市场的布局情况
表:2017年中国主要二手车交易服务平台融资情况
图:2016-2021E中国二手车交易量及同比增长率
图:2015-2021E中国汽车金融渗透率
图:2014-2021E中国汽车金融行业市场规模
图:2016年中国汽车金融市场竞争格局
表:中国主要汽车金融公司
图:2016年中国主要汽车金融公司经营业绩对比
图:2013-2016年中国汽车金融公司总资产规模
图:2013-2016年中国汽车金融公司贷款金额(分类型)
图:2013-2016年中国汽车金融公司主要业务结构
图:2013-2016年中国汽车金融公司发放贷款的车辆数(分类型)
表:中国互联网企业布局汽车互联网金融案例
表:中国银行和企业合作布局汽车金融案例
图:2012-2021年中国汽修美容行业市场规模及同比增长率
表:2016-2017年汽修美容行业主要融资案例一览
图:中国汽修美容行业主要竞争者
表:中国主要线下汽修美容连锁企业
表:中国主要独立连锁汽修美容品牌对比
表:中国汽修美容不同渠道对比分析
表:中国重点区域汽修美容连锁品牌分布
图:网络汽修美容的相对优势
图:互联网维修养护平台主要经营模式
表:中国部分汽修美容网络平台项目一览
表:中国汽修美容网络平台项目区域分布
图:2010-2017年中国汽车保险保费收入及同比增长率
图:2017-2021E中国汽车保险保费收入及同比增长率
表:2017年1-10月中国车险公司收入排行榜TOP20
图:庞大集团4S店汽车采购模式
图:庞大集团4S店汽车销售模式
图:庞大集团4S店盈利模式
图:2013-2017年庞大集团营业收入及净利润
图:2014-2016年庞大集团营业收入(分业务)
图:2014-2016年庞大集团营业收入构成(分业务)
图:2014-2017年庞大集团毛利率
图:2012-2017年庞大集团经营网点数量(分类型)
截至2016年底庞大集团已开业门店分布情况
表:2015-2016年庞大集团整车销量及库存
表:2013-2016年庞大集团前五名客户销售收入及占比
表:庞大集团核心竞争力
图:2013-2017年国机汽车营业收入及净利润
表:2016年国机汽车非公开发行股票募集资金用途
图:2013-2016年国机汽车营业收入(分业务)
图:2013-2016年国机汽车营业收入构成(分业务)
表:2013-2016年国机汽车营业收入(分地区)
图:2013-2016年国机汽车主营业务毛利率
表:2015-2016年国机汽车销量及库存
图:中升集团主要合作厂家
图:2013-2017年中升集团营业收入及净利润
图:2013-2017年中升集团营业收入(分业务)
图:2013-2017年中升集团营业收入构成(分业务)
图:2013-2017年中升集团毛利率
图:2013-2016年中升集团毛利率(分业务)
图:2011-2017年中升集团新车销量及同比增长率
图:2011-2017年中升集团豪华品牌新车销量及占比
表:2014-2017年中升集团经销店数量(分地区)
图:2011-2017年中升集团经销店数量(分等级)
图:截至2016年底中升集团全国布局
图:2013-2017年大昌行营业收入及净利润
图:2013-2017年大昌行营业收入(分业务)
图:2013-2017年大昌行营业收入构成(分业务)
图:2013-2017年大昌行毛利率
图:大昌行汽车及汽车相关业务主要客户
图:2013-2017年大昌行汽车及相关业务收入(分地区)
图:2013-2017年大昌行汽车及相关业务收入构成(分地区)
表:2011-2016年大昌行汽车销量(分地区)
图:2011-2017年大昌行4S店和汽车陈列室数量
图:截至2017年6月30日大昌行4S和汽车陈列室数量(分品牌)
图:2014-2017年广汇汽车营业收入及净利润
表:2015-2016年广汇汽车营业收入构成(分业务)
表:2016年广汇汽车营业收入(分地区)
表:2015-2016年广汇汽车毛利率(分业务)
图:截至2017年6月30日广汇汽车营业网点分布
表:截至2017年6月30日广汇汽车4S店数量(分类型)
图:2014-2017年广汇汽车新车销量
图:2015-2017年广汇汽车二手车代理交易台次
图:2015-2017年广汇汽车售后维修进场台次
图:2015-2017年广汇汽车融资租赁发生台次
图:2013-2017年正通汽车营业收入及净利润
图:2013-2017年正通汽车营业收入(分业务)
图:2013-2017年正通汽车营业收入构成(分业务)
图:2013-2017年正通汽车毛利率(分业务)
图:截至2017年6月30日正通汽车经销网点分布
表:截至2017年6月30日正通汽车经营网点数量(分类型)
图:2013-2017年正通汽车新车销量(分类型)
图:2013-2017年正通汽车新车销售额(分类型)
图:永达汽车业务产业链
图:2013-2017年永达汽车营业收入及净利润
表:2013-2017年永达汽车营业收入(分业务)
表:2013-2017年永达汽车营业收入构成(分业务)
图:2013-2017年永达汽车毛利率
图:2013-2017年永达汽车毛利率(分业务)
表:截至2017年6月30日永达汽车经营网点数量
图:截至2017年6月30日永达汽车全国经营网点分布情况
图:截至2017年6月30日永达汽车覆盖品牌范围
图:2013-2017年永达汽车新车销量(分类型)
图:2013-2017年大东方营业收入及净利润
图:2013-2017年大东方主营业务收入(分业务)
图:2013-2017年大东方主营业务收入构成(分业务)
图:2013-2017年大东方毛利率(分业务)
表:大东方汽车销售及服务主要业务及经营模式
图:2013-2017年大东方汽车销售及服务收入及占比
图:2013-2017年宝信汽车营业收入及净利润
图:2013-2017年宝信汽车营业收入(分业务)
图:2013-2017年宝信汽车营业收入构成(分业务)
图:2013-2017年宝信汽车毛利率(分业务)
图:2014-2017年宝信汽车新车销量(分类型)
图:2013-2017年宝信汽车汽车销售收入(分类型)
图:2013-2017年和谐汽车营业收入及净利润
图:2013-2017年和谐汽车营业收入(分业务)
图:2013-2017年和谐汽车营业收入构成(分业务)
图:2013-2017年和谐汽车毛利率(分业务)
图:2013-2017年和谐汽车新车销量
图:2017上半年和谐汽车新车销量构成(分产品)
图:2013-2017年亚夏汽车营业收入及净利润
表:2013-2017年亚夏汽车营业收入(分业务)
表:2013-2017年亚夏汽车营业收入构成(分业务)
图:2013-2017年亚夏汽车毛利率(分业务)
图:2012-2016年亚夏汽车汽车销量及同比增长率
图:2014-2017年物产中大营业收入及净利润
表:2014-2017年物产中大营业收入(分业务)
图:2014-2017年物产中大整车销售收入及占比
图:2014-2017年元通汽车营业收入及净利润
图:恒信汽车经营网络
图:恒信汽车主要经营品牌
Development History of Automotive Distribution in China
Major Means of Automotive Distribution in China
Comparison: Characteristics of Different Automotive Distribution Modes
Comparison: Business Model of Imported Cars and China-made Cars
Automotive Aftermarket Segments
China’s Automotive Aftermarket Size, 2015-2021E
Procedures for Constructing Passenger Car 4S Shop in China
Cost Structure for Constructing 4S Shop
Service Scope of Automotive Distribution in China
Profit Model of New Car Sales of Dealers in China
Dealers’ Profitability from Different Car Models
Total Revenue of Top 100 Dealers in China, 2010-2017
Number of Car Dealers with the Revenue of over RMB10 billion in China, 2010-2016
Revenue of the Ranking No.1 among Top 100 Car Dealers in China, 2010-2016
Vehicle Sales Volume of Top 100 Car Dealers in China, 2010-2016
Top 20 Car Dealers by Revenue in China, 2017
New Car Sales Volume Comparison between Chinese Car Dealers, 2015-2016
Revenue Comparison between Major Chinese Car Dealers, 2013-2017
Net Income Comparison between Major Chinese Car Dealers, 2013-2017
Automobile Sales Gross Margin of Major Chinese Car Dealers, 2013-2017
After-sales Service Gross Margin of Major Chinese Car Dealers, 2013-2017
Comparison between Major Chinese Car Dealers by Number of 4S Shops, 2015-2017
M&A Cases in China Automotive Distribution Industry, 2016-2017
Cases of Automotive Distribution Industry's Layout on Internet + in China, 2015-2017
China’s Used Car Trading Volume, 2016-2021E
Number of 4S Shops in China, 2010-2017
China’s Automobile Output, 2011-2017
China’s Automobile Sales Volume, 2011-2017
China’s Automobile Output and Sales Volume, 2016-2021E
Sales Volume of Top 10 Automotive Brands in China by Type, Jan.-Oct. 2017
China’s Automobile Sales Volume Structure (by Type), 2011-2017
China’s Automobile Sales Volume Structure (by Type), 2016-2021E
China’s Passenger Car Output, 2011-2017
China’s Passenger Car Sales Volume, 2011-2017
China’s Passenger Car Output and Sales Volume, 2016-2021E
China’s Passenger Car Sales Volume (by Type), 2011-2017
China’s Passenger Car Sales Volume Structure (by Type), 2011-2017
Sales Volume of Top 10 Passenger Car Brands in China by Type, Jan.-Oct. 2017
China’s Commercial Vehicle Output, 2011-2017
China’s Commercial Vehicle Sales Volume, 2011-2017
China’s Commercial Vehicle Output & Sales Volume, 2016-2021E
China’s Commercial Vehicle Sales Volume (by Type), 2011-2017
China’s Commercial Vehicle Sales Volume Structure (by Type), 2011-2017
China’s New Energy Vehicle (EV&PHEV) Output and Sales Volume, 2011-2017
China’s New Energy Vehicle (EV&PHEV) Sales Volume (by Type), 2016-2017
China’s New Energy Vehicle (EV&PHEV) Output (by Type), 2016-2017
Ratio of Used Cars to New Cars in China, 2012-2017
Ratio of Used Cars to New Cars in Major Countries
Development Stages of Used Car Market
Main Trade Modes for Used Cars in China
Trade Modes for Used Cars in Major Countries
Trading Volume and YoY Growth Rate of Used Cars in China, 2011-2017
Proportion of Used Car Trading Volume in China (by Type), 2014-2017
Proportion of Used Car Trading Volume in China (by Service Life), Jan.-Nov. 2017
Proportion of Used Car Trading Volume in China (by Price Range), Jan.-Nov. 2017
China’s Used Car Trading Volume (by Region), 2015-2017
China’s Used Car Trading Volume Structure (by Region), Jan.-Nov. 2017
Layout of Major Chinese Car Dealers in Used Car Market
Financing of Major Chinese Used Car Trading Service Platforms, 2017
China’s Used Car Trading Volume, 2016-2021E
Penetration of Auto Finance in China, 2015-2021E
Auto Finance Market Size in China, 2014-2021E
Competition Pattern of Auto Finance Market in China, 2016
Major Auto Finance Companies in China
Operating Results of Major Auto Finance Companies in China, 2016
Total Assets of Auto Finance Companies in China, 2013-2016
Loans of Auto Finance Companies in China (by Type), 2013-2016
Main Business Structure of Auto Finance Companies in China, 2013-2016
Number of Automobiles (by Type) that Received Loans from Auto Finance Companies in China, 2013-2016
Cases of Chinese Internet Firms that Make Layout in Internet Auto Finance
Cases of Banks and Enterprises that Work Together to Make Layout in Auto Finance
Market Size of China’s Auto Repair & Beauty Industry, 2012-2021E
Main Financing Cases of Auto Repair & Beauty Industry, 2016-2017
Major Competitors in China’s Auto Repair & Beauty Industry
Major Offline Auto Repair & Beauty Chain Enterprises in China
Comparison between Main Independent Chain Auto Repair & Beauty Brands in China
Comparison between Auto Repair & Beauty Channels in China
Distribution of Auto Repair & Beauty Chain Brands in China’s Key Areas
Relative Advantages of Network Auto Repair & Beauty
Main Business Models of Internet Platforms for Repair and Maintenance
Some Auto Repair & Beauty Network Platform Projects in China, 2015
Regional Distribution of Auto Repair & Beauty Network Platform Projects in China, 2015
China’s Automotive Insurance Premium Income, 2010-2017
China’s Automotive Insurance Premium Income, 2017-2021E
Top 20 Auto Insurance Companies by Revenue, Jan.-Oct.2017
Procurement Model of Pangda Automobile’s 4S Shops
Sales Model of Pangda Automobile’s 4S Shops
Profit Model of Pangda Automobile’s 4S Shops
Revenue and Net Income of Pangda Automobile, 2013-2017
Revenue of Pangda Automobile (by Business), 2014-2016
Revenue Structure of Pangda Automobile (by Business), 2014-2016
Gross Margin of Pangda Automobile, 2014-2017
Number of Pangda Automobile’s Business Outlets (by Type), 2012-2017
Regional Distribution of Opened Outlets of Pangda Automobile by End 2016
Vehicle Sales Volume and Inventory of Pangda Automobile, 2015-2016
Revenue and % of total Revenue from Top Five Customers of Pangda Automobile, 2013-2016
Core Competitiveness of Pangda Automobile
Revenue and Net Income of Sinomach Automobile, 2013-2017
Purpose of Raised Fund through Private Offering of Sinomach Automobile, 2016
Revenue of Sinomach Automobile (by Business), 2013-2016
Revenue Structure of Sinomach Automobile (by Business), 2013-2016
Revenue of Sinomach Automobile (by Region), 2013-2016
Gross Margin of Sinomach Automobile (by Business), 2013-2016
Sales Volume and Inventory of Sinomach Automobile, 2015-2016
Major Cooperative Manufacturers of Zhongsheng Group
Revenue and Net Income of Zhongsheng Group, 2013-2017
Revenue of Zhongsheng Group (by Business), 2013-2017
Revenue Structure of Zhongsheng Group (by Business), 2013-2017
Gross Margin of Zhongsheng Group, 2013-2017
Gross Margin of Zhongsheng Group (by Business), 2013-2016
New Car Sales Volume of Zhongsheng Group, 2011-2017
Luxury Brand New Car Sales Volume and % of Total Sales Volume of Zhongsheng Group, 2011-2017
Number of Zhongsheng Group’s Outlets (by Region), 2014-2017
Number of Zhongsheng Group’s Outlets (by Grade), 2011-2017
National Layout of Zhongsheng Group, by end of 2016
Revenue and Net Income of DCH, 2013-2017
Revenue of DCH (by Business), 2013-2017
Revenue Structure of DCH (by Business), 2013-2017
Gross Margin of DCH, 2013-2017
Automobile & Automobile-related Business Cutomers of DCH
Revenue of DCH's Automobile and Automobile-related Business (by Region), 2013-2017
Revenue Structure of DCH's Automobile and Automobile-related Business (by Region), 2013-2017
Automobile Sales Volume of DCH (by Region), 2011-2016
Number of DCH’s 4S Shops and Showrooms, 2011-2017
Number of DCH’s Showrooms by Brand, as of the end of Jun.30, 2017
Revenue and Net Income of China Grand Auto, 2014-2017
Revenue of China Grand Auto (by Business), 2015-2016
Revenue of China Grand Auto (by Region), 2016
Gross Margin of China Grand Auto (by Business), 2015-2016
Number of Outlets of China Grand Auto by Region, by Jun 30, 2017
Number of China Grand Auto’s 4S Shops (by Type), ass of Jun.30, 2017
New Car Sales Volume of China Grand Auto, 2014-2017
Number of Vehicles through Used Car Agent Transaction of China Grand Auto, 2015-2017
Number of Times with After-sales Maintenance of Chian Grand Auto, 2015-2017
Number of Vehicles with Financial Leasing Business of China Grand Auto, 2015-2017
Revenue and Net Income of ZhengTong Auto, 2013-2017
Revenue of ZhengTong Auto (by Business), 2013-2017
Revenue Structure of ZhengTong Auto (by Business), 2013-2017
Gross Margin of ZhengTong Auto (by Business), 2013-2017
National Layout of ZhengTong Auto, as of Jun.30, 2017
Number of ZhengTong Auto’s Business Outlets (by Type), as of Jun.30, 2017
New Car Sales Volume of ZhengTong Auto (by Brand), 2013-2017
New Car Revenue of ZhengTong Auto (by Brand), 2013-2017
Industry Chain of Yongda Auto Business
Revenue and Net Income of Yongda Auto, 2013-2017
Revenue of Yongda Auto (by Business), 2013-2017
Revenue Structure of Yongda Auto (by Business), 2013-2017
Gross Margin of Yongda Auto, 2013-2017
Gross Margin of Yongda Auto (by Business), 2013-2017
Number of Outlets of Yongda Auto (by Type), as of June 30, 2017
Outlet Distribution of Yongda Auto in China, as of June 30, 2017
Brand Coverage of Yongda Auto, As of June 30, 2017
New Passenger Car Sales Volume of Yongda Auto (by Type), 2013-2017
Revenue and Net Income of Grand Orient, 2013-2017
Revenue of Grand Orient (by Business), 2013-2017
Revenue Structure of Grand Orient (by Business), 2013-2017
Gross Margin of Grand Orient by Business, 2013-2017
Automobile Sales & Services and Business Model of Grand Orient
Revenue and % of Automobile Sales & Services of Grand Orient, 2013-2017
Revenue and Net Income of Baoxin Auto Group, 2013-2017
Revenue of Baoxin Auto Group (by Business), 2013-2017
Revenue Structure of Baoxin Auto Group (by Business), 2013-2017
Gross Margin of Baoxin Auto Group (by Business), 2013-2017
Sales Volume of Baoxin Auto Group (by Type), 2014-2017
Revenue of Automobile Sales of Baoxin Auto Group (by Type), 2013-2017
Revenue and Net Income of Harmony Auto, 2013-2017
Revenue of Harmony Auto (by Business), 2013-2017
Revenue Structure of Harmony Auto (by Business), 2013-2017
Gross Margin of Harmony Auto (by Business), 2013-2017
New Car Sales Volume of Harmony Auto, 2013-2017
New Car Sales Structure of Harmony Auto by Brand, 2017H1
Revenue and Net Income of Yaxia Automobile, 2013-2017
Revenue Breakdown of Yaxia Automobile by Business, 2013-2017
Revenue Structure of Yaxia Automobile by Business, 2013-2017
Gross Margin of Yaxia Automobile by Business, 2013-2017
Automobile Sales Volume of Yaxia Automobile, 2012-2016
Revenue and Net Income of Materials Industry Zhongda Group Co., Ltd., 2014-2017
Revenue of Materials Industry Zhongda Group Co., Ltd. (by Business), 2014-2017
Vehicle Sales Revenue and % of Total Revenue of Materials Industry Zhongda Group Co., Ltd., 2014-2017
Revenue and Net Income of Zhejiang Materials Industry Yuantong Automobile Group, 2014-2017
Operationn Network of Hengxin Automotive
Cooperated Brands of Hengxin Automotive
如果这份报告不能满足您的要求,我们还可以为您定制报告,请 留言说明您的详细需求。
|