|
|
|
报告导航:研究报告—
农业与食品—农业
|
|
2007-2008年中国玉米及其种业研究报告 |
 |
字数:2.5万 |
页数:65 |
图表数:50 |
|
中文电子版:6000元 |
中文纸版:3000元 |
中文(电子+纸)版:6500元 |
|
英文电子版:1600美元 |
英文纸版:1500美元 |
英文(电子+纸)版:1900美元 |
|
编号:FC006
|
发布日期:2008-03 |
附件:下载 |
 |
|
|
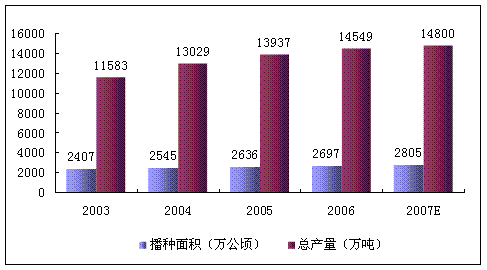
2008年2月国家粮油信息中心估计:2007年玉米播种面积2805万顷,较2006年增加108万公顷,增幅达到4.00%。由于玉米种植效益上升,东北春玉米和华北夏玉米面积均有增长。预计20007/2008年度(2007年10月-2008年9月)玉米产量为1.48亿吨,较2006年增长251万吨3%。
图:2003-2006年玉米播种面积及总产量变化趋势

来源:水清木华研究中心
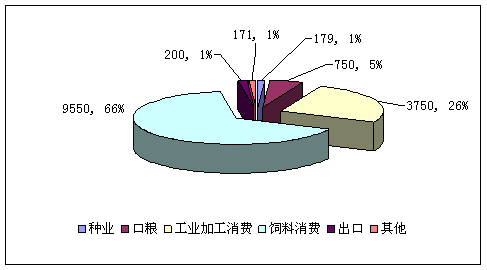
玉米消费主要来自于玉米口粮、饲料、工业消费、种业和出口四个方面,预计2007/2008年度国内总消费达到1.46亿吨,其中饲料和工业消费占国内玉米消费总量的90%。根据国家出台的“十一五”政策:工业消费用量规模不得超过玉米消费总量的26%,饲料用量年增长要保持在4.7%左右。预计2007/2008年玉米工业消费量不会出现大幅度上扬,饲料行业在2007年下半年的恢复形势下,需求量将会进一步上升。
图:2007/2008年中国玉米消费占比变化趋势(单位:万吨)

来源:水清木华研究中心
本报告依据国家统计局、中国粮油信息中心、国家海关总署、等国家权威渠道数据,对玉米作物及种业的市场现状、主要政策、供需情况、重点公司进行了研究,并预测了2007/2008年度玉米及其种业的供需状况及发展趋势。
第一章 玉米作物市场现状 1.1 玉米作物发展现状 1.2 行业法规
第二章 中国玉米供给现状
2.1 黄淮海平原夏玉米区
2.1.1 河南玉米供给现状
2.1.2 山东玉米供给现状
2.2 北方春玉米区
2.2.1 东三省供给现状
2.2.2 内蒙古玉米供给现状
2.2.3 宁夏玉米供给现状
2.3 西南山地玉米区
2.3.1 四川玉米供给现状
2.3.2 云南玉米供给现状
2.3.3 贵州玉米供给现状
2.4 南方丘陵玉米区
2.4.1 广东玉米供给现状
2.4.2 福建玉米供给现状
2.4.3 浙江玉米供给现状
2.4.4 江西玉米供给现状
2.5 西北灌溉玉米区
2.5.1 新疆玉米供给现状
2.5.2 甘肃玉米供给现状
2.6 青藏高原玉米区
2.6.1 青海玉米供给现状
2.6.2 西藏玉米供给现状
第三章 玉米消费分析
3.1 种业需求
3.1.1 我国西北制种基地
3.1.2 我国东北制种基地
3.1.3 我国华北制种基地
3.1.4 玉米种子的主要需求类型
3.2 口粮需求
3.3 工业加工消费
3.4 饲料消费
3.5 玉米进出口消费
第四章 玉米供需状况
4.1 玉米种业供需分析
4.1.1 玉米制种供需
4.1.2 2007年杂交玉米种子市场价格
4.2 玉米供需状况
4.2.1 玉米供需分析
4.2.2 中国玉米市场价格
第五章 玉米种业主要企业介绍
5.1 北京奥瑞金种业股份有限公司
5.1.1 公司简介
5.1.2 主营业务结构
5.2 山东登海种业有限公司(002041)
5.2.1 公司简介
5.2.2 主营业务结构
5.3 甘肃省敦煌种业股份有限公司 (600354)
5.3.1 公司简介
5.3.2 主营业务结构
5.4 山西屯玉种业科技股份有限公司
5.4.1 公司简介
5.4.2 主营业务结构
5.5 万向德农股份有限公司(600371)
5.5.1 公司简介
5.5.2 主营业务结构
5.6 中种集团
5.6.1 公司简介
5.6.2 主营业务结构
5.7 四川国豪种业有限公司
5.7.1 公司简介
5.7.2 主营业务结构
5.8 黑龙江北大荒种业集团有限公司
5.8.1 公司简介
5.8.2 主营业务结构
5.9 合肥丰乐种业股份有限公司
5.9.1 公司简介
5.9.2 主营业务结构
5.10 三北种业有限公司
5.10.1 公司简介
5.10.2 主营业务结构
5.11 辽宁丹玉种业科技有限公司
5.11.1 公司简介
5.11.2 主营业务结构
5.12 河南农科院种业有限公司
5.12.1 公司简介
5.12.2 主营业务结构
5.13 河北省承德裕丰种业有限公司
5.13.1 公司简介
5.13.2 主营业务结构
5.14 辽宁东亚种业有限公司
5.14.1 公司简介
5.14.2 主营业务结构
第六章 玉米作物及其种业发展趋势
表:中国六大种植区主要省份及产量占比
表:2008年农业部主导玉米推广品种
表:2001-2005年郑单958推广面积
表:2005-2008年玉米口粮需求变化趋势
表:2005-2008年玉米工业加工消费量变化趋势
表:2001-2008年饲料玉米消耗量变化趋势
表:2007-2008年玉米制种面积、产量、库存变化趋势
表:2007年全国各地育种面积增加数量
表:2007年全国杂交玉米主要品种市场价格
表:2007-2008年国内玉米价格走势 单位
表:2007-2008年各地玉米市场价格对比表
表:北京奥瑞金种业主要产品列表
表:2007年登海种业十大列表股东
表:2007年登海种业主营业务收入情况
表:20007年登海种业盈利能力分析
表:20007年登海种业资产管理能力分析
表:20007年登海种业偿债能力分析
表:2007年敦煌种业十大股东
表:2007年敦煌种业主营业务收入情况
表:20007年敦煌种业盈利能力分析
表:20007年敦煌种业资产管理能力分析
表:20007年敦煌种业偿债能力分析
表:山西屯玉投资公司列表
表:山西屯玉玉米主要品种列表
表:万向德农十大股东列表
表:2007年万向种业主营业务收入情况
表:20007年万向种业盈利能力分析
表:20007年万向种业资产管理能力分析
表:20007年万向种业偿债能力分析
表:中种集团合作伙伴列表
图:2003-2006年玉米播种面积及总产量变化趋势
图:2003-2006年河南省玉米种植面积及总产量变化趋势
图:2003-2006年山东玉米种植面积及总产量
图:2003-2006年吉林玉米种植面积及总产量变化趋势
图:2003-2006年黑龙江玉米种植面积及总产量变化趋势
图:2003-2006年辽宁玉米种植面积及总产量变化趋势
图:2003-2006年内蒙古玉米种植面积及总产量变化趋势
图:2003-2006年宁夏玉米种植面积及总产量变化趋势
图:2003-2006年四川玉米种植面积及总产量变化趋势
图:2003-2006年云南玉米种植面积及总产量变化趋势
图:2003-2006年贵州玉米种植面积及总产量变化趋势
图:2003-2006年广东玉米种植面积及总产量变化趋势
图:2003-2006年福建玉米种植面积及总产量变化趋势
图:2003-2006年浙江玉米种植面积及总产量变化趋势
图:2003-2006年江西玉米种植面积及总产量变化趋势
图:2003-2006年新疆玉米种植面积及总产量变化趋势
图:2003-2006年甘肃玉米种植面积及总产量变化趋势
图:2003-2006年青海玉米种植面积及总产量变化趋势
图:2003-2006年西藏玉米种植面积及总产量变化趋势
图:2000-2007年淀粉、酒精产品消耗玉米数量变化趋势
图:2006-2007年蛋鸡配合饲料价格走势
图:2007年1-12月玉米出口量变化趋势
图:2007年玉米出口目的地比例图
图:2006-2008年全国玉米制种面积,产量和库存情况
图:2007-2008年国内玉米价格走势
China Corn & Corn Seed Industry Report, 2007-2008
Pages 70 Release Date: March.2008
PDF (US$): 1,600 Hard Copy (US$): 1,500
Abstract
It was estimated by China National Grain and Oils Information Centre in February, 2008 that China’s cultivated areas of corn were about 28.05 million hectares in 2007, up 4% against the previous year, or increasing by 1.08 million hectares. The cultivated areas of spring corn in Northeast China and summer corn in North China both increased, due to a rise in profit of corn planting. According to the estimation, China’s corn output is expected to reach 148 million tons in the period of October, 2007 to September, 2008, up 3% against 2006, or an addition of 2.51 million tons.
Changes of Cultivated Areas and Total Output, 2003-2006
Source: ResearchInChina
China’s corn consumption mainly covers the five aspects of food,feed, industrial consumption, seed industry and export. It was predicted that China’s domestic consumption in the period of October, 2007 to September, 2008 will total 146 million tons, among which, the feed and industrial consumption will account for 90% of the total. According to the Eleventh Five-Year Plan (2006-2010): the proportion of industrial consumption should not surpass 26% of the total and the feed consumption should maintain an annual growth rate of around 4.7% during the period of 2006-2010. It was predicted that China’s industrial consumption of corn in the period of October, 2007 to September, 2008 won’t have a big increase, however, the demand of feed industry for corn is expected to have a further rise, due to the recovery of feed industry in the second half of 2007.
Proportions of China Corn Consumption, Oct 2007-Sep 2008
Based on the authoritative and abundant information from the National Bureau of Statistics, the China National Grain and Oils Information Centre and the General Administration of Customs of China, this report makes an in-depth study on the current situation, market situation, main policies and key companies of corn & corn seed industry and forecasts the market situation and development trend of the industry in the period of October, 2007 to September, 2008.
Contents
1. Market Status of China Corn Crops
1.1 Status quo
1.2 Laws and regulations
2. China Corn Supply Situation
2.1 Summer Corn Regions of Huang-Huai-Hai Plain
2.1.1 Corn supply in Henan province
2.1.2 Corn supply in Shandong province
2.2 Spring corn regions in North China
2.2.1 Corn supply in three provinces in Northeast China
2.2.2 Corn supply in Inner Mongolia Autonomous Region
2.2.3 Corn supply in Ningxia Hui Autonomous Region
2.3 Corn regions in mountainous areas in Southwest China
2.3.1 Corn supply in Sichuan province
2.3.2 Corn supply in Yunnan province
2.3.3 Corn supply in Guizhou province
2.4 Corn regions in hilly areas in South China
2.4.1 Corn supply in Guangdong province
2.4.2 Corn supply Fujian province
2.4.3 Corn supply in Zhejiang province
2.4.4 Corn supply in Jiangxi province
2.5 Irrigated corn regions in Northwest China
2.5.1 Corn supply in Xinjiang Uygur Autonomous Region
2.5.2 Corn supply in Gansu province
2.6 Corn regions in Qinghai-Tibet Plateau
2.6.1 Corn supply in Qinghai province
2.6.2 Corn supply in Tibet Autonomous Region
3. Analysis of Corn Consumption
3.1 Demand of seed industry
3.1.1 Seed production base in Northwest China
3.1.2 Seed production base in Northeast China
3.1.3 Seed production base in North China
3.1.4 Main types of corn seed demand
3.2 Food consumption
3.3 Industrial consumption
3.4 Feed consumption
3.5 Import & export consumption
4 Corn Supply and Demand
4.1 Supply and demand of corn seed industry
4.1.1 Supply and demand of corn seed production
4.1.2 Market prices of hybrid corn seeds in 2007
4.2 Situation of corn supply and demand
4.2.1 Analysis of corn supply and demand
4.2.2 Market prices of China corn
5 Key Corn Seed Enterprises
5.1 Beijing Origin Seed Technology Inc.
5.1.1 Company profile
5.1.2 Main business structure
5.2 Shandong Denghai Seeds Co., Ltd.(002041)
5.2.1 Company profile
5.2.2 Main business structure
5.3 Gansu Dunhuang Seed Co., Ltd. (600354)
5.3.1 Company profile
5.3.2 Main business structure
5.4 Shanxi Tunyu Seed Industry Co., Ltd.
5.4.1 Company profile
5.4.2 Main business structure
5.5 WanXiang Doneed Co., Ltd.(600371)
5.5.1 Company profile
5.5.2 Main business structure
5.6 China National Seed Group Corp.
5.6.1 Company profile
5.6.2 Main business structure
5.7 Sichuan Guohao Seed Co., Ltd.
5.7.1 Company profile
5.7.2 Main business structure
5.8 Beidahuang Seed Group Corporation
5.8.1 Company profile
5.8.2 Main business structure
5.9 Hefei Fengle Seed Co., Ltd.
5.9.1 Company profile
5.9.2 Main business structure
5.10 Sanbei Seed Co., Ltd.
5.10.1 Company profile
5.10.2 Main business structure
5.11 Liaoning Danyu Seed Science & Technology Joint-stock Co., Ltd.
5.11.1 Company profile
5.11.2 Main business structure
5.12 Henan Academy of Agricultural Sciences Seed Co., Ltd.
5.12.1 Company profile
5.12.2 Main business structure
5.13 Hebei Chengde Yufeng Seed Co., Ltd.
5.13.1 Company profile
5.13.2 Main business structure
5.14 Liaoning Dongya Seed Co., Ltd.
5.14.1 Company profile
5.14.2 Main business structure
6. Development Trend of Corn & Corn Seed Industry
Selected Charts
Major provinces covered by six large plant areas in China and each output ratio
Corn breeds recommended by Ministry of Agriculture of the People’s Republic of China in 2008
Changing trend of demand for corn ration, 2005-2008
Changing trend of consumption on corn industry processing, 2005-2008
Changing trend of consumption on corn feed, 2001-2008
Cultivated areas, output and inventory of corn, 2007-2008
Market price of main hybrid corn breeds in China, 2007
Trend of China corn price, 2007-2008
Comparison of corn market price in each region, 2007-2008
Product catalog of Beijing Origin Seed Technology Inc.
List of shareholders of Shandong Denghai Seeds Co., Ltd. in 2007
Main business income of Shandong Denghai Seeds Co., Ltd. in 2007
Profitability of Shandong Denghai Seeds Co., Ltd. in 2007
Asset Management Ability of Shandong Denghai Seeds Co., Ltd. in 2007
Debt-paying ability of Gansu Dunhuang Seed Co., Ltd.
List of shareholders of WanXiang Doneed Co., Ltd.
Product catalog of Shanxi Tunyu Seed Industry Co., Ltd.
Main business income of WanXiang Doneed Co., Ltd. in 2007
Profitability of WanXiang Doneed Co., Ltd. in 2007
Asset management ability of WanXiang Doneed Co., Ltd. in 2007
Debt-paying ability of WanXiang Doneed Co., Ltd. in 2007
Partners of China National Seed Group Corporation
Cultivated areas and total output of corn, 2003-2007
Cultivated areas and total output of corn in Shandong province, 2003-2007
Cultivated areas and total output of corn in Jilin province, 2003-2007
Cultivated areas and total output of corn in Hei Long Jiang province, 2003-2007
Cultivated areas and total output of corn in Liaoning province, 2003-2007
Changing trend of corn export in 2007
Export destinations in2007
Cultivated areas, output and inventory of China corn, 2006-2008
Trend of China corn price, 2007-2008
如果这份报告不能满足您的要求,我们还可以为您定制报告,请 留言说明您的详细需求。
|