|
报告导航:研究报告—
制造业—材料
|
|
2007-2008年中国稀土行业研究报告 |
 |
字数:3.9万 |
页数:70 |
图表数:45 |
|
中文电子版:6000元 |
中文纸版:5500元 |
中文(电子+纸)版:7000元 |
|
英文电子版:1700美元 |
英文纸版:1600美元 |
英文(电子+纸)版:2000美元 |
|
编号:EY001
|
发布日期:2008-04 |
附件:下载 |
 |
|
|
根据2006年美国地质研究局数据,世界稀土基础储量为15400万吨。储量排名依次为中国、独联体、美国、澳大利亚和印度,其中中国占据了57%。目前全球稀土库存量可静态使用1.5 年,全球稀土储量能够可静态供应200 年以上。
尽管中国依旧是处于资源储量第一的位置,但中国稀土资源占全球资源的份额却在下降。 与1998 年相比,人均拥有稀土量由33g/人下降到21g/人。
2007年,国家对稀土矿产品和冶炼分离产品生产实行指令性计划管理。稀土矿产品产量为12.08万吨(以REO计,下同),比上年减少8.83%。稀土冶炼分离产品产量12.60万吨(含废料回收所得近1.8万吨),比上年减少19.75%。
图:2000-2007年我国稀土产品出口情况
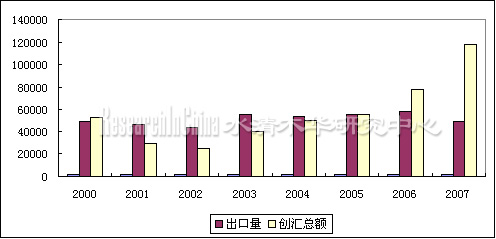
来源:中国稀土行业协会
2007年,我国稀土产品出口量为4.90万吨(含稀土磁体),比上年减少14.93%,出口金额达到11.79亿美元,比上年增长51.00%。稀土磁体出口到69个国家和地区,出口量达到21532吨(实物),出口金额达到4.15亿美元,分别比上年增长91.43%和36.96%。出口量排在前10位的国家和地区是香港、美国、日本、新加坡、德国、泰国、韩国、意大利、荷兰和芬兰。
本研究报告依据中国稀土行业协会、中国稀土学会、中国石油化工行业协会、国家海关总署、国家信息中心和国家统计局等权威渠道数据。
According to the data of the U.S. Geological Survey released in 2006, the basic reserves of rare earth in the world amounted to 154 million tons. China’s rare earth reserves account for 57% of the world’s total, ranking the first, followed by Commonwealth of Independent States, U.S.A., Australia and India. Currently, the global rare earth inventories can last for 1.5 years in static use and the world’s rare earth reserves may last for more than 200 years in static use.
Although China has the largest rare earth reserves in the world, its share of rare earth resources in the global total is on the downward trend. China's per capita possession of rare earth has dropped to 21g/person from 33g/person in 1998.
In 2007,China carried out mandatory management plan on the production of rare earth products and smelting & separating rare earth products. In the year, the output of rare earth products was 120,800 tons, (by REO,the same hereinafter),down 8.83% year on year, and the output of smelting and separating rare earth products was 126,000 tons (including nearly 18,000 tons from waste recovery),down 19.75% year on year.
China Export of Rare Earth Products, 2000 to 2007
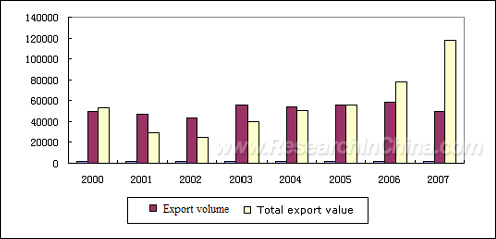
Source: The Chinese Associate of Rare Earth Industry
In 2007,China’s export volume of rare earth products (rare-earth magnet included) was 49,000 tons, down 14.93% year on year, but the export value reached US$1,18 billion,up 51% year on year. Among the total exports, the export volume of rare-earth magnet, exporting to 69 countries and regions, reached 21,532 tons, nearly doubling against the pervious year, and the export value was US$415 million,up 36.96% year on year. The top nations and regions in terms of China’s export volume were Hong Kong and USA, Japan, Singapore, German, Thailand, Korea, Italy, Holland and Finland.
The report is based on the authoritative data from the Chinese Associate of Rare Earth Industry, the Chinese Society of Rare Earths, the China Petroleum and Chemical Industry Association, the General Administration of Customs of China, the State Information Center and the National Bureau of Statistics of China and the information from financial reports of some key companies.
第一章 行业发展概述
1.1 我国稀土行业发展概况
1.1.1 稀土行业背景分析
1.1.2 我国稀土行业发展历程
1.2 稀土行业特征分析
1.2.1 稀土的特点
1.2.2 稀土产业的特点
1.3 稀土行业产业政策分析
1.3.1 稀土行业的宏观调控力度进一步加强
1.3.2 稀土出口税率上升
1.3.3 部分地区稀土行业结构调整成绩显著
第二章 我国稀土资源分析
2.1 我国稀土资源概况
2.2 我国稀土资源开发策略
2.2.1 我国资源优势趋弱
2.2.2 发达国家做法借鉴
2.2.3 采选收率有待提高
2.2.4 国外稀土资源利用
2.2.5 扩大储备保持优势
第三章 我国稀土行业发展分析
3.1 2006 年我国稀土行业发展现状
3.1.1 行业概况
3.1.2 产业结构
3.1.3 竞争能力
3.2 2007 年我国稀土行业市场分析
3.2.1 市场概况
3.2.2 价格分析
3.2.3 供求分析
3.3 2006-2007 年我国稀土出口分析
3.3.1 出口现状
3.3.2 发展趋势
3.4 2007年我国稀土行业存在的问题
3.4.1 稀土资源浪费和生态破坏严重
3.4.2 工厂规模偏小,装备落后
3.4.3 科研投入不足,产品高端化受制约
3.4.4 自主知识产权意识不强
3.4.5 缺乏宏观引导和稀土产业政策
第四章 主要产区稀土行业分析
4.1 内蒙古稀土行业
4.1.1 内蒙古稀土行业发展概况
4.1.2 内蒙古稀土行业产业结构
4.1.3 包头稀土行业发展现状
4.2 中国南部稀土行业
4.2.1 南方行业概况
4.2.2 南方稀土矿山
4.2.3 南方稀土分离
4.2.4 南方稀土金属及其它
4.2.5 南方稀土发展趋势
4.3 江西稀土行业
4.3.1 江西稀土行业概况
4.3.2 赣州市稀土产业发展
4.3.3 赣州市稀土产业布局
4.3.4 赣州市稀土工业发展对策
4.4 部分其它省市稀土行业
4.4.1 四川稀土工业
4.4.2 安徽稀土产业
第五章 稀土主要应用领域分析
5.1 催化
5.2 永磁体
5.3 发光材料
5.4 玻璃
5.5 抛光粉
5.6 冶金
5.7 陶瓷
5.8 稀土农用
第六章 稀土重点企业分析
6.1 中科三环
6.1.1 公司简介
6.1.2 2007年财务分析
6.1.3 公司整体经营分析
6.1.4 公司优劣势分析
6.1.5 公司发展战略分析
6.2 宁波韵升
6.2.1 公司简介
6.2.2 2007年财务分析
6.2.3 公司整体经营分析
6.2.4 公司发展战略分析
6.3 安泰科技
6.3.1 公司简介
6.3.2 2007年财务分析
6.3.3 公司发展发展战略分析
6.4 江西南方稀土高技术股份有限公司
6.4.1 公司简介
6.4.2 经营特色
第七章 稀土行业发展预测
7.1 稀土行业发展预测
7.1.1 稀土行业及产品发展方向
7.1.2 稀土市场前景分析
7.1.3 稀土行业前景展望
7.2 稀土行业发展的对策
1. Overview of Rare Earth Industry
1.1 Development of China rare earth industry
1.1.1 Background
1.1.2 Development history
1.2 Characteristics of rare earth industry
1.2.1 Characteristics of rare earth
1.2.2 Characteristics of rare earth industry
1.3 Rare earth industry policies
1.3.1 Enhancing macro-control of rare earth industry
1.3.2 Export tax rate of rare earth on rise
1.3.3 Great achievements in adjusting industry structure in some regions
2. China Rare Earth Resources
2.1 General overview
2.2 Development strategies of rare earth resources
2.2.1 Weakening advantage in resource
2.2.2 Solutions from developed countries
2.2.3 Mining and dressing yield to be improved
2.2.4 Utilization of overseas rare earth resources
2.2.5 Expanding reserves
3. Development of China Rare Earth Industry
3.1 China rare earth industry development in 2006
3.1.1 Industry overview
3.1.2 Industrial structure
3.1.3 Competitiveness
3.2 China rare earth market in 2007
3.2.1 Market overview
3.2.2 Price
3.2.3 Supply and demand
3.3 China rare earth exports in 2006-2007
3.3.1 Export
3.3.2 Development trend
3.4 Problems in the industry in 2007
3.4.1 Serious waste of rare earth resources and great damages to ecological environment
3.4.2 Plants with outdated equipment and small production scale
3.4.3 Inadequate investment in scientific research
3.4.4 Weak consciousness in safeguarding proprietary intellectual property rights
3.4.5 Lack of policies to control healthy development of rare earth industry
4. Key Rare Earth Areas
4.1 Rare earth industry in Inner Mongolia Autonomous Region
4.1.1 Development overview
4.1.2 Industrial structure
4.1.3 Development of rare earth industry in Baotou
4.2 Rare earth industry in South China
4.2.1 Industry overview
4.2.2 Rare earth mines
4.2.3 Separation of rare earth
4.2.4 Rare earth metals and others
4.2.5 Development trend
4.3 Rare earth industry in Jiangxi province
4.3.1 Industry overview
4.3.2 Development of rare earthy in Ganzhou City
4.3.3 Industry distribution in Ganzhou City
4.3.4 Development policies on rare earth industry in Ganzhou City
4.4 Rare earth industry in some provinces
4.4.1 Rare earth industry in Sichuan province
4.4.2 Rare earth industry in Anhui province
5. Key application fields
5.1 Catalysis
5.2 Permanent-magnet (PM)
5.3 Luminescent material
5.4 Glass
5.5 Polishing powder
5.6 Metallurgy
5.7 Ceramics
5.8 Agriculture
6. Key companies
6.1 Zhongke Sanhuan High-Tech Co.,Ltd
6.1.1 Company profile
6.1.2 Financial analysis of 2007
6.1.3 Operation state
6.1.4 Advantages and disadvantages
6.1.5 Development strategies
6.2 Ningbo Yunsheng Co., Ltd.
6.2.1 Company profile
6.2.2 Financial analysis of 2007
6.2.3 Operation state
6.2.4 Development strategies
6.3 Advanced Technologies &Materials Co., Ltd.
6.3.1 Company profile
6.3.2 Financial analysis of 2007
6.3.3 Development strategies
6.4 Jiangxi South Rare Earth Hi-Tech Co., Ltd.
6.4.1 Company profile
6.4.2 Operation characteristics
7. Forecast of Rare Earth Industry Development and Proposals
7.1 Development forecast
7.1.1 Development trend
7.1.2 Market prospect
7.1.3 Development prospect
7.2 Measures on the industry development
表 1 部分稀土出口暂定税率调整表
表 2 2006年6月稀有、稀土及其它商品出口情况
表 3 2007年11月中国稀土产品出口情况
表 4 2008年稀土出口企业名单
表 5 包头稀土产业主要产品和生产能力
表 6 南方矿主要省份产量情况
表 7 中国主要分离南方离子稀土矿稀土企业的规模能力
表 8 1997-2006年烧结钕铁硼磁体的产值变化情况
表 9 1997-2006年烧结钕铁硼磁体的价格变化情况
表 10 钕铁硼产品专利权期限情况
表 11 近年来我国稀土抛光粉的品种与质量状况
表 12 2007年中科三环获利能力分析
表 13 2007年中科三环资本结构分析
表 14 2007 年中科三环发展能力分析
表 15 2007 年中科三环现金流量分析
图 1 2000-2007年我国稀土产品出口情况
图 2 1995-2007碳酸稀土价格走势图 单位:元/公斤
图 3 钕铁硼行业SWOT 分析
图 4 我国钕铁硼产能的集中度情况
图 5 金属钕和氧化钕的出口价
图 6 上市公司钕铁硼业务毛利率情况
图 7 中科三环公司产能和高端产品比重不断上升
图 8 中科三环公司单季度收入、净利润和毛利率情况
图 9 中科三环公司生产成本构成
图 10 国内钕铁硼生产企业产量对比
图 11 全球烧结钕铁硼永磁材料产量增长情况及中国产量占比
图 12 中国烧结钕铁硼市场规模预测 单位:亿元
图 13 中国粘结钕铁硼市场规模预测 单位:亿元
表 16 中科三环与日本企业部分成本对比
表 17 中科三环与国际竞争对手产品价格
表 18 中科三环公司产品与主要客户
表 19 2007年宁波韵升获利能力分析
表 20 2007 年宁波韵升经营能力分析
表 21 2007年宁波韵升偿债能力分析
表 22 公司发展能力分析
表 23 2007 年安泰科技获利能力分析
表 24 2007年安泰科技经营能力分析
表 25 2007年安泰科技资本结构分析
表 26 2007 年安泰科技发展能力分析
表 27 2007年安泰科技现金流量分析
图 14 2006年以来主要稀土产品价格走势
表 28 某些器件所用稀土新材料
图 15 白云鄂博矿稀土金属元素成分比例
图 16 钕铁硼原材料比例
图 17 2005-2007年国内市场金属钕和氧化钕价格走势图
Table1 Adjustment of temporary export tax rate of some rare earth products
Table 2 Export of rare metals, rare earth and other commodities on June 2006
Table 3 Export of China rare earth products on Nov.2007
Table 4 List of enterprises exporting rare earth in 2008
Table 5 Major products and productivity of Baotou rare earth industry
Table 6 Rare earth output in some southern provinces
Table 7 Scale and productivity of rare earth mines and companies in separating rare earth ion in China South
Table 8 Output value of Sintered NdFeB Magnet from 1997 to 2006
Table 9 Prices of Sintered NdFeB Magnet from 1997 to 2006
Table 10 Time limits of NdFeB Magnet products
Table 11 Varieties and quality of China rare earth polishing powder in recent years
Table 12 Profitability analysis of Zhongke Sanhuan High-Tech Co., Ltd in 2007
Table 13 Capital structure of Zhongke Sanhuan High-Tech Co., Ltd in 2007
Table 14 Development capability of Zhongke Sanhuan High-Tech Co., Ltd in 2007
Table 15 Cash flow of Zhongke Sanhuan High-Tech Co., Ltd in 2007
Chart1 Export of China rare earth products from 2000 to 2007
Chart 2 Price trend of rare earth carbonate from 1995 to 2007 Unit:Yuan/kg
Chart 3 SWTO analysis of NdFeB industry
Chart 4 Concentration degree of production capability of China NdFeB industry
Chart 5 Overseas prices of neodymium metal and neodymium oxide
Chart 6 Gross profit margin in NdFeB business of listed companies
Chart 7 Productivity and senior products of Zhongke Sanhuan High-Tech Co., Ltd.
Chart 8 Revenue, net profit and gross profit margin in the first and third quarters of Zhongke Sanhuan High-Tech Co., Ltd.
Chart 9 Production cost structure of Zhongke Sanhuan High-Tech Co., Ltd.
Chart 10 Outputs of domestic NdFeB enterprises
Chart 11 Outputs of global Sintered NdFeB permanent magnet materials and share China had
Chart 12 Forecast of market scale of China Sintered NdFeB Unit:1 billion Yuan
Chart 13 Forecast of market scale of China Bonded NdFeB Unit:1 billion Yuan
Table 16 Cost structures of Zhongke Sanhuan High-Tech Co., Ltd. and some Japanese companies
Table 17 Products’ prices and international rivals of Zhongke Sanhuan High-Tech Co., Ltd. Table 18 Main products and clients of Zhongke Sanhuan High-Tech Co., Ltd.
Table 19 Profitability analysis of Ningbo Yunsheng Co., Ltd. in 2007
Table 20 Operation capability of Ningbo Yunsheng Co., Ltd. in 2007
Table 21 Credit capacity of Ningbo Yunsheng Co., Ltd. in 2007
Table 22 Development capability
Table 23 Profitability analysis of Advanced Technology &Materials Co., Ltd.in 2007
Table 24 Operation capability of Profitability analysis of in 2007
Table 25 Capital structure of Profitability analysis of in 2007
Table 26 Development capability of Profitability analysis of in 2007
Table 27 Cash flow of Profitability analysis of in 2007
Chart 14 Price trend of main rare earth products since 2006
Table28 Rare earth new materials used in some devices
Chart 15 Elementary composition of rare earth metal of Baiyun Ebo Mine
Chart 16 Raw material proportion of NdFeB
Chart 17 Price trend of neodymium metal and neodymium oxide in domestic from 2005 to 2007
如果这份报告不能满足您的要求,我们还可以为您定制报告,请 留言说明您的详细需求。
|