|
报告导航:研究报告—
制造业—能源矿产
|
|
2007-2008年中国固体废弃物处理行业研究报告 |
 |
字数:2.0万 |
页数:66 |
图表数:85 |
|
中文电子版:6000元 |
中文纸版:3000元 |
中文(电子+纸)版:6500元 |
|
英文电子版:1600美元 |
英文纸版:1500美元 |
英文(电子+纸)版:1900美元 |
|
编号:FY065
|
发布日期:2008-06 |
附件:下载 |
 |
|
|
“十一五”规划期间,中国环保投资力度继续加大,计划投资达13750亿元,比“十五”期间增长64%,环保投入将占同期GDP的1.5%以上。
根据ERM的预测和分析,中国将是全球环保产业增长最快的国家之一。中国环保总局初步测算表明,“十一五”期间,中国环保产业可望保持15%-17%的年均增长速度,2010年环保产业的年收入总值将达到8800-10000亿元。
中国固废处理行业开始于20世纪80年代初,目前在整个环保业中的比重不到10%。随着国家对固废污染控制的重视,中国固废处理行业的发展潜力将逐渐释放。“十一五”期间,中国固废处理行业的年均增长率可望达到15%以上。
2006年,中国进行无害化处理(主要通过填埋、堆肥和焚烧等手段)的城市垃圾量为7872.6万吨,少于2005年,生活垃圾无害化处理率达到53.05%,高于2005年。2010年,中国的城市垃圾无害化处理率将达到60%以上,届时预计城市垃圾处理行业规模将达2000亿元左右。
图:2003-2006中国城市生活垃圾处理量及无害化处理率
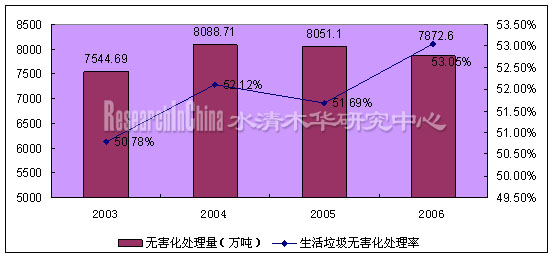
整理:水清木华研究中心
2006年,中国工业固体废物综合利用量、贮存量和处置量分别为9.26、2.24和4.29亿吨,工业固体废物利用率达61%,逐年提高。另一方面,工业固废每年的贮存量都在2亿吨以上,工业固废存量压力仍然巨大。
自2004年以来,中国固废处理设备产量总体保持快速增长态势。2008年前2个月,中国固废处理设备产量为357台(座),比2007年同期增长30.8%。2007年全年,中国固废处理设备产量达4707台(座),同比激增83.4%。产量的快速增长表明固废处理设备需求旺盛。
截至2006年底,中国城市垃圾焚烧发电厂已经有60多座,拟建和在建的还有50多座。在中国环保“十一五”发展规划中,垃圾发电是国家今后重点扶持的几个领域之一。而2006年,中国城市垃圾焚烧处理量仅占总处理量的15%,其中焚烧发电量占城市垃圾总处理量的8%,比例偏低,发展前景十分广阔。
本研究报告依据中国国家统计局、中国环境保护部、国家发展与改革委员会、中国建设部、中国机械工业联合会、中国环保产业协会等权威渠道数据,并借鉴了其它研究机构的公开研究结果,部分重点企业数据主要来自公司年报和公司主页。
During the 11th Five-Year Plan period (2006-2010), China will continue to put more efforts to increase its investment in environmental protection and its total investment is expected to reach CNY1.375 trillion, up 64% compared to the 10th Five-Year Plan period (2001-2005). The investment in environmental protection will take up at least 1.5% of China’s GDP in the same period.
According to the forecast and the analysis made by ERM, China will be one of the countries with the fastest growth in environment protection industry. The primary estimation of China’s Ministry of Environmental Protection shows that China’s environment protection industry is expected to have an average annual growth rate of 15% to 17% in the five years and its output value is forecast to total CNY880 billion to CNY1 trillion in 2010.
China’s solid waste treatment industry originated in early 1980s. At present, its proportion amounts to less than 10% of the total output value of China’s entire environmental protection industry. As China attaches more and more attention to the solid waste control, development potential in China solid waste treatment industry will be gradually released. In the period 2006-2010, China’s solid waste treatment industry is forecast to have an average annual growth rate of more than 15%.
In 2006, China’s urban refuse treated by biosafety disposal, mainly including landfill, composting and incineration, reached 78.73 million tons, less than that in 2005. China’s biosafety treatment rate of living refuse stood at 53.05%, higher than that in 2005. The biosafety treatment rate of urban refuse in China is expected to exceed 60% in 2010, when the market size of China urban refuse treatment industry is forecast to reach around CNY200 billion.
Urban Living Refuse Treatment Volume and Biosafety Treatment Rate in China 2003-2006
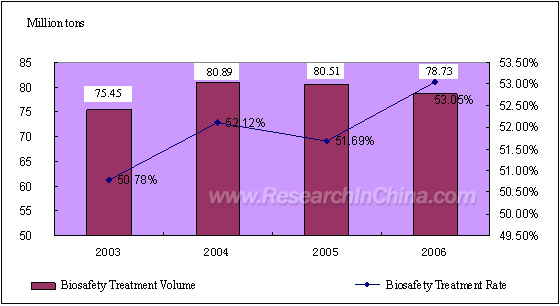
Source: ResearchInChina
In 2006, China’s comprehensive utilization, storage and disposal of industrial solid waste were 926 million tons, 224 million tons and 429 million tons respectively. China’s utilization rate of industrial solid waste reached 61%, indicating a continuous growth year by year. On the other hand, China’s storage volume of industrial solid waste exceeds 200 million tons each year, implying that China is still under great pressure in storage of industrial solid waste.
Since 2004, China’s production of equipment to dispose industrial solid waste has generally maintained a momentum of rapid growth. In the first two months of 2008, China’s production of solid waste treatment equipment was 357 units, up 30.8% year on year. In 2007, China’s production of solid waste treatment equipment reached 4,707 sets, up 83.4% year on year. The rapid growth in production shows that China’s demand for solid waste treatment equipment is quite strong.
By the end of 2006, China has had 60 refuse-fired power plants and another 50 refuse-fired power plants either under construction or in the pipeline. According to the National Eleventh Five-Year Plan for Environmental Protection, refuse-fired power plant is one of the sectors with key support from the central government.
In 2006, China’s Volume of urban refuse treatment through incineration took up only 15% of the total disposal volume and China’s urban refuse treatment volume by refuse-fired power plants accounted for 8% of the total disposal volume, a low proportion, showing a bright future for the development of refuse-incinerated power generating industry.
The report is based on the authoritative statistics from the Ministry of Environmental Protection, the National Bureau of Statistics, the National Development and Reform Commission, the Ministry of Housing and Urban-Rural Development, the China Machinery Industry Federation and the China Association of Environmental Protection Industry, and some research findings publicized by some research institutes as well as some information from websites and financial reports of several key listed companies.
第一章 固体废弃物处理行业概述
1.1 固体废弃物处理行业定义
1.2 固废处理行业主要特点
1.3 固废处理行业细分
1.4 固废处理行业产业链
1.5 固废处理行业发展的关键驱动因素
第二章 中国固废处理行业发展环境分析
2.1 行业背景
2.2 政策环境
2.3 中国环保“十一五”规划分析
第三章 中国城市生活垃圾处理现状分析
3.1 “十一五”城市垃圾处理相关规划
3.2 中国城市生活垃圾处理总体分析
3.2.1 中国城市生活垃圾产生量统计
3.2.2 中国城市生活垃圾处理情况统计
3.3 中国城市生活垃圾处理技术及其发展分析
3.3.1 中国城市生活垃圾处理常用技术
3.3.2 中国城市生活垃圾处理量技术构成
3.3.3 中国城市生活垃圾填埋技术发展趋势分析
3.3.4 中国城市生活垃圾堆肥技术发展趋势分析
3.3.5 中国城市生活垃圾焚烧技术发展趋势分析
3.4 中国城市生活垃圾处理区域分析
3.4.1 中国城市生活垃圾产生量区域分析
3.4.2 中国城市生活垃圾处理量区域分析
3.4.3 中国城市生活垃圾处理率区域分析
第四章 中国工业固体废物处理现状分析
4.1 中国工业固废处理总体分析
4.1.1 中国工业固体废物产生量统计
4.1.2 中国工业固体废物处理情况统计
4.2 中国工业固废处理区域分析
4.2.1 中国工业固体废物产生情况地区分析
4.2.2 中国工业固体废物综合利用情况地区分析
4.2.3 中国工业固体废物贮存和处置情况地区分析
4.3 中国工业固废处理下游行业分析
4.3.1 中国工业固体废物产生的主要行业
4.3.2 中国工业固体废物综合利用主要行业
4.3.3 中国工业固体废物贮存和处置主要行业
4.4 中国危险废物产生和处理情况统计
第五章 中国固废处理重点子行业分析
5.1 中国固废处理设备行业分析与预测
5.1.1 中国固废处理设备产量分析
5.1.2 中国固废处理设备产量区域分析
5.1.3 竞争状况分析
5.1.4 中国固废处理设备行业发展趋势分析
5.2 中国垃圾发电行业分析
5.2.1 中国垃圾发电行业现状与发展趋势
5.2.2 中国垃圾发电行业收入状况分析
5.2.3 中国垃圾发电行业竞争状况
第六章 中国固废处理行业投资与风险分析
6.1 投资机会分析
6.2 行业风险分析
第七章 重点企业分析
7.1 合加资源
7.1.1 公司简介
7.1.2 主营业务构成分析
7.1.3 固废处理工程业务分析
7.1.4 固废处理设备业务分析
7.1.5 公司重点财务指标分析
7.1.6 公司发展预测
7.2 上海环境集团有限公司
7.2.1 公司简介
7.2.2 公司资产状况分析
7.2.3 公司盈利状况分析
7.2.4 竞争优势分析
7.3 南海发展
7.3.1 公司简介
7.3.2 固废处理业务分析及预测
7.4 泰达股份
7.4.1 公司简介
7.4.2 固废处理业务分析
7.4.3 竞争优势分析
7.5 华光股份
7.5.1 公司简介
7.5.2 固废处理业务分析
7.5.3 竞争优势
7.6 金州环境股份有限公司
7.6.1 公司简介
7.6.2 公司主要固废项目介绍
7.6.3 竞争优势
7.7 中宜环能技术有限公司
7.7.1 公司简介
7.7.2 公司固废处理业务介绍
7.7.3 竞争优势分析
7.8 光大环保
7.8.1 公司简介
7.8.2 公司固废处理业务介绍
7.9 杭州锦江集团
7.9.1 公司简介
7.9.2 公司固废处理业务介绍
7.10 浙江伟明集团
7.10.1 公司简介
7.10.2 公司固废处理业务介绍
第八章 总结
8.1 政策背景小结
8.2 中国城市生活垃圾处理状况小结
8.2.1 总体状况
8.2.2 填埋处理走势
8.2.3 堆肥处理走势
8.2.4 焚烧处理走势
8.3 中国工业固废处理状况小结
8.3.1 工业固废处理总体状况
8.3.2 危险废物处理总体状况
8.4 中国固废处理设备行业小结
8.5 中国垃圾焚烧发电行业小结
8.6 重点企业小结
8.6.1 合加资源
8.6.2 南海发展
8.6.3 泰达股份
1. Overview of Solid Waste Treatment Industry
1.1 Industry Definition
1.2 Main Characteristics
1.3 Segmented Industries
1.4 Industry Chain
1.5 Key Driver for Industry Development
2. Development Environment of China Solid Waste Treatment Industry
2.1 Background
2.2 Policy Environment
2.3 the National Eleventh Five-Year Plan for Environmental Protection
3. Status Quo of China Urban Refuse Treatment
3.1 Plans Related to Urban Refuse Treatment in 11th Five-Year Plan
3.2 General Situation of China’s Urban Living Refuse Treatment
3.2.1 Total Volume of Urban Living Refuse Produced in China
3.2.2 Treatment of City Living Refuse in China
3.3 China Urban Refuse Treatment Technology and Its Development
3.3.1 Common Technology
3.3.2 Technical Structure of China Urban Refuse Treatment Volume
3.3.3 Development Trend of China Urban Refuse Landfill Technology
3.3.4 Development Trend of China Urban Refuse Composting Technology
3.3.5 Development Trend of China Refuse Incineration Technology
3.4 China Urban Living Refuse Treatment by Region
3.4.1 Volume of China Urban Living Refuse Produced by Region
3.4.2 Volume of China Urban Living Refuse Treated by Region
3.4.3 Treatment Rates of China Urban Living Refuse by Region
4. Status Quo of China Industrial Solid Waste Treatment
4.1 General Situation of Industrial Solid Waste Treatment
4.1.1 Volume of China Industrial Solid Waste Produced
4.1.2 China Industrial Solid Waste Treatment
4.2 China Industrial Solid Waste Treatment by Region
4.2.1 China Industrial Solid Waste Generated by Region
4.2.2 Comprehensive Utilization of China Industrial Solid Waste by Region
4.2.3 China Storage & Disposal of Industrial Solid Waste by Region
4.3 Downstream Sector of China Industrial Solid Waste Treatment Industry
4.3.1 Main Industries Generating Industrial Solid Waste in China
4.3.2 Main Industries with Comprehensive Utilization of Industrial Solid Waste in China
4.3.3 Main Industries Storing and Disposing Industrial Solid Waste in China
4.4 Generation and Treatment of Hazardous Waste in China
5. Key Segmented Industries of China Solid Waste Treatment Industry
5.1 China Solid Waste Treatment Equipment Industry and Its Forecast
5.2 Output of China Solid Waste Treatment Equipment Industry
5.1.2 Production of Solid Waste Treatment Facility Industry in China by Region
5.1.3 Competition Status
5.1.4 Development Trend of China Solid Waste Treatment Equipment Industry
5.2 China Refuse-fired Power Generation Industry
5.2.1 Status Quo of the Industry and Development Trend
5.2.2 Revenue of China Refuse-fired Power Generation Industry
5.2.3 Competition Status
6. Investment and Risk in China Solid Waste Treatment Industry
6.1 Investment Opportunities
6.2 Risks
7. Key Companies
7.1 Eguard Resources Development Co., Ltd.
7.1.1 Company Profile
7.1.2 Main Business Structure
7.1.3 Business on Solid Waste Treatment Project
7.1.4 Business on Solid Waste Treatment Facility
7.1.5 Key Financial Indicators
7.1.6 Development Forecast
7.2 Shanghai Environment Group Co., Ltd
7.2.1 Company Profile
7.2.2 Assets of the Company
7.2.3 Profitability Status
7.2.4 Competition Strength
7.3 Nanhai Development Co., Ltd
7.3.1 Company Profile
7.3.2 Solid Waste Treatment Business and Its Forecast
7.4 Tianjin Teda Co., Ltd
7.4.1 Company Profile
7.4.2 Solid Waste Treatment Business
7.4.3 Competition Strength
7.5 Wuxi Huaguang Boiler Co., Ltd
7.5.1 Company Profile
7.5.2 Solid Waste Treatment Business
7.5.3 Competition Strength
7.6 Jinzhou Environment Co., Ltd
7.6.1 Company Profile
7.6.2 Solid Waste Treatment Business
7.6.3 Competition Strength
7.7 China Ecological Technology Co., Ltd
7.7.1 Company Profile
7.7.2 Solid Waste Treatment Business
7.7.3 Competition Strength
7.8 Everbright Environment
7.8.1 Company Profile
7.8.2 Solid Waste Treatment Business
7.9 Hangzhou Jinjiang Group
7.9.1 Company Profile
7.9.2 Solid Waste Treatment Business
7.10 Zhejiang Weiming Group
7.10.1 Company Profile
7.10.2 Solid Waste Treatment Business
8. Summarization
8.1 Policy Background
8.2 China Urban Living Refuse Treatment
8.2.1 General Situation
8.2.2 Landfill Treatment and Its Development Trend
8.2.3 Composting Treatment and Its Development Trend
8.2.4 Incineration Treatment and Its Development Trend
8.3 Summarization of China Industrial Solid Waste
8.3.1 General Situation of Industrial Solid Waste Treatment
8.3.2 General Situation of Hazardous Waste Treatment
8.4 Summarization of China Solid Waste Treatment Equipment Industry
8.5 Summarization of China Refuse-fired Power Generation Industry
8.6 Summarization of Key Companies
8.6.1 Eguard Recourses Development Co., Ltd
8.6.2 Nanhai Development Co., Ltd
8.6.3 Tianjin Teda Co., Ltd
图:固体废物分类(按来源)
图:固废处理行业产业链示意图
图:中国环保产业所处的发展阶段
图:固废处理行业在全球环保业中的地位
表:固废处理行业政策的目标
图:“十一五”规划中国环保产业投资增长情况
表:“十一五”规划期间中国固废处理投资情况
图:“十一五”规划期间中国固废处理投资分布
表:“十一五”期间中国城市垃圾无害化处理设施投资规划
表:2003-2006中国城市生活垃圾清运量统计
图:2003-2006中国城市生活垃圾清运量及增长情况
表:2003-2006中国城市生活垃圾处理量和处理能力
图:2003-2006中国城市生活垃圾处理量及无害化处理率
表:中国常用的城市垃圾处理技术
图:2006中国城市生活垃圾处理量技术构成
表:2003-2006中国城市垃圾填埋厂数、处理能力和处理量走势
图:2003-2006中国城市垃圾填埋厂数走势图
图:2003-2006中国城市垃圾填埋处理能力走势图
图:2003-2006中国城市垃圾填埋处理量走势图
表:2003-2006中国城市垃圾堆肥厂数、处理能力和处理量走势
图:2003-2006中国城市垃圾堆肥厂数走势图
图:2003-2006中国城市垃圾堆肥处理能力走势图
图:2003-2006中国城市垃圾堆肥处理量走势图
表:2003-2006中国城市垃圾焚烧厂数、处理能力和处理量走势
图:2003-2006中国城市垃圾焚烧厂数走势图
图:2003-2006中国城市垃圾焚烧处理能力走势图
图:2003-2006中国城市垃圾焚烧处理量走势图
表:2006年中国城市垃圾清运量排名前10位省市
表:2006年中国城市垃圾处理量排名前10位省市
表:2006年中国城市垃圾处理率排名前10位省市
表:2003-2006年中国工业固体废物产生量统计
图:2003-2006年中国工业固体废物产生量及增长情况
表:2003-2006年中国工业固体废物处理量统计
图:2003-2006年中国工业固体废物处理情况走势图
表:2006年中国工业固体废物产生前10名省市
表:2006年中国工业固体废物综合利用前10名省市
表:2006年中国工业固体废物贮存和处置量前10名省市
表:2006年中国工业固体废物产生量前10名行业
表:2006年中国工业固体废物综合利用量前10名行业
表:2006年中国工业固体废物贮存和处置量前10名行业
表:2001-2006年中国危险废物产生和处理情况统计
图:2001-2006年中国危险废物产生和处理情况走势图
表:已通过复核的第一批危险废物处置设施建设项目简况
表:已通过复核的第一批医疗废物处置设施建设项目简况
表:2004-2008年中国固废处理设备产量统计
图:2004-2008年中国固废处理设备产量走势图
表:2007年中国固废处理设备产量前10名省市
图:2007年中国固废处理设备产量区域构成图
表:中国部分固废处理设备企业名单
图:中国重点发展的环保设备领域
图:2020年中国环保设备行业产值规划
图:2000年和2010年环保设备行业产值结构对比
表:2008年中国重点地区垃圾焚烧发电厂投运、在建及拟建情况
图:2001-2010年中国垃圾发电装机容量发展趋势
表:2007年中国各地垃圾焚烧发电厂上网电价情况统计
图:2007年合加资源主营业务收入构成图(按行业)
图:2007年合加资源毛利构成图(按行业)
图:2007年合加资源主营业务收入构成图(按地区)
图:2007年合加资源毛利构成图(按地区)
表:2004-2007年合加资源固废处理工程业务收入和毛利
图:2004-2007年合加资源固废处理工程业务收入及变动趋势
图:2004-2007年合加资源固废处理工程业务毛利率变动趋势
表:2004-2007年合加资源固废处理设备业务收入和毛利
图:2004-2007年合加资源固废处理设备业务收入及变动趋势
图:2004-2007年合加资源固废处理设备业务毛利率变动趋势
表:2004-2007年合加资源重要财务指标
图:2004-2007年合加资源收入与利润变动趋势
图:2005-2007年合加资源成长能力变动趋势
图:2005-2007年合加资源盈利能力变动趋势
表:合加资源承建的固废项目一览
表:上海环境集团主要垃圾处理运营中心
表:2006-2007年南海发展垃圾发电业务收入和营业利润
图:2006-2010年南海发展垃圾处理能力增长趋势
图:2006-2009年南海发展垃圾发电收入增长预测
表:泰达股份主要固废处理项目
表:2005-2007年泰达股份垃圾发电业务收入与营业利润情况
图:2005-2007年泰达股份垃圾发电业务收入与营业利润变动趋势
图:200t/d以上级别垃圾锅炉主要生产企业和市场份额
图:华光股份电站锅炉销售收入主要构成
表:惠联垃圾发电项目收入与利润预测表
表:金州环境股份有限公司主要固废项目一览
表:光大环保已投资的固废项目
表:杭州锦江集团已投产的垃圾发电厂
表:浙江伟明集团垃圾发电厂一览
图:“十一五”规划中国环保产业投资增长情况
图:2003-2006中国城市生活垃圾清运量及增长情况
图:2003-2006中国城市生活垃圾处理量及无害化处理率
图:2003-2006中国城市垃圾填埋处理量走势图
图:2003-2006中国城市垃圾堆肥处理量走势图
图:2003-2006中国城市垃圾焚烧处理量走势图
图:2003-2006年中国工业固体废物产生量及增长情况
图:2003-2006年中国工业固体废物处理情况走势图
图:2001-2006年中国危险废物产生和处理情况走势图
图:2004-2008年中国固废处理设备产量走势图
图:2001-2010年中国垃圾发电装机容量发展趋势
图:2004-2007年合加资源收入与利润变动趋势
图:2006-2009年南海发展垃圾发电收入增长预测
图:2005-2007年泰达股份垃圾发电业务收入与营业利润变动趋势
Classification of Solid Wastes by Sources
Solid Waste Treatment Industry Chain
Development Phase of China Environmental Protection
Position of Solid Waste in Global Environmental Protection
Target of Solid Waste Treatment Policy
Investment Growth in China Environmental Protection Industry in 2006-2010
China Investment in Solid Waste Treatment in 2006-2010
Distribution of China Investment in Solid Waste Treatment in 2006-2010
China Investment in Urban Refuse Biosafety Treatment Facilities in 2006-2010
Volume of China Urban Living Refuse Removed in 2003-2006
Volume of China Urban Living Refuse Removed and Its Changes in 2003-2006
Volume of China Urban Living Refuse Disposed and Its Disposal Capacity in 2003-2006
Disposal Volume and Disposal Rate of China Urban Living Refuse by Biosafety Treatment, 2003-2006
Common Technology Adopted by China
2006 China Urban Living Refuse Treatment Volume by Different Technologies
Number of Refuse Landfill Yards, Disposing Capacity and Disposal Volume in 2003-2006
Number of Refuse Landfill Yards in China in 2003-2006
Disposing Capacity of Refuse Landfill Yards in China, 2003-2006
Disposal Volume of Refuse Landfill Yards in China, 2003-2006
Number of Compost Plants, Disposing Capacity and Disposal Volume in 2003-2006
Number of Refuse Compost Plants in China, 2003-2006
Disposing Capacity of Refuse Compost Plants in China, 2003-2006
Disposal Volume of Refuse Compost Plants in China, 2003-2006
Number of Refuse Incineration Plants, Disposing Capacity and Disposal Volume, 2003-2006
Disposing Capacity of Refuse Incineration Plants in China, 2003-2006
Disposal Volume of Refuse Incineration Plants in China, 2003-2006
China Top Ten Provinces/Cities in Volume of Urban Refuse Removed in 2006
China Top Ten Provinces/Cities in Volume of Urban Refuse Disposed in 2006
China Top Ten Provinces/Cities in Disposal Rate of Urban Refuse in 2006
Volume of Industrial Solid Waste Produced in China, 2003-2006
Volume of Industrial Solid Waste Produced in China and Its Changes, 2003-2006
Disposal Volume of Industrial Solid Waste in China, 2003-2006
China Industrial Solid Waste Disposal in 2003-2006
China Top Ten Provinces/Cities in Volume of Industrial Solid Waste Produced in 2006
China Top Ten Provinces/Cities in Volume of Industrial Solid Waste Stored & Treated in 2006
China Top Ten Industries in Comprehensive Utilization of Industrial Solid Waste in 2006
China Top Ten Industries in Volume of Industrial Solid Waste Stored & Treated in 2006
Hazardous Waste Generation and Treatment in China, 2001-2006
Hazardous Waste Generation and Treatment in China and Its Changes, 2001-2006
First Batch of Hazardous Waste Disposal Projects under Construction
First Batch of Medical Waste Disposal Projects under Construction
Production Trend of Solid Waste Treatment Facility in China, 2004-2008
China Top Ten Provinces/Cities in Production of Solid Waste Disposal Equipment in 2007
Some Solid Waste Disposal Equipment Producers in China
China’s Key Development Field of Environmental Protection Equipment
Output Value of China Environmental Protection Equipment Industry through 2020
Contrast of Output Value of China Environmental Protection Industry in 2000-2010
Refuse-fired Power Plants in Operation or under Construction in Key Regions, 2008
Installed Capacity of China’s Refuse-fired Power Plants in 2001-2010
Feed-in Tariffs of China Refuse-fired Power Plants in Each Regions in 2007
Eguard Main Business Revenue by Industry
Eguard Gross Profit by Industry
Eguard Main Business Revenue by Region
Eguard Gross Profit by Region
Revenue & Gross Profit of Eguard Solid Waste Disposal Projects, 2004-2007
Revenue Changes of Eguard Solid Waste Disposal Projects, 2004-2007
Gross Profit Changes of Eguard Solid Waste Disposal Projects, 2004-2007
Revenue & Gross Profit of Eguard Solid Waste Disposal Equipment Business, 2004-2007
Gross Profit Changes of Eguard Solid Waste Disposal Equipment Business, 2004-2007
Eguard Key Financial Indicators, 2004-2007
Changes of Eguard Revenue and Profit, 2004-2007
Eguard Growing Ability and Its Changing Trend, 2004-2007
Eguard Profitability and Its Changing Trend, 2004-2007
Eguard Solid Waste Disposal Projects
Main Refuse Disposal Operation Centers of Shanghai Environment Group
Revenue and Operation Profit of Nanhai Refuse-fired Power Generation Business, 2006-2007
Nanhai Refuse Disposing Capacity and Its Growth Trend, 2006-2010
Forecast of Revenue Growth of Nanhai Refuse-fired Power Generation Business, 2006-2009
Main Solid Waste Treatment Projects of Tianjin Teda Co., Ltd.
Sales Revenue Structure of Utility Boilers of Wuxi Huaguang Boiler Co.
Forecast of Revenue and Profit of Huilian Refuse-fired Power Generation Projects
Main Solid Waste Disposal Projects of Golden State Environment Group Corp.
Solid Waste Disposal Projects Invested by Everbright Environmental Protection Engineering and Technology (Shenzhen) Co., Ltd.
Revenue and Profit of Tianjin Teda Refuse-fired Power Generation Business, 2005-2007
如果这份报告不能满足您的要求,我们还可以为您定制报告,请 留言说明您的详细需求。
|