|
|
|
报告导航:研究报告—
TMT产业—电信
|
|
2008年上半年中国手机出口市场研究报告 |
 |
字数:3.8万 |
页数:131 |
图表数:90 |
|
中文电子版:8500元 |
中文纸版:4250元 |
中文(电子+纸)版:9000元 |
|
英文电子版:2500美元 |
英文纸版:2300美元 |
英文(电子+纸)版:2800美元 |
|
编号:CA057
|
发布日期:2008-08 |
附件:下载 |
 |
|
|
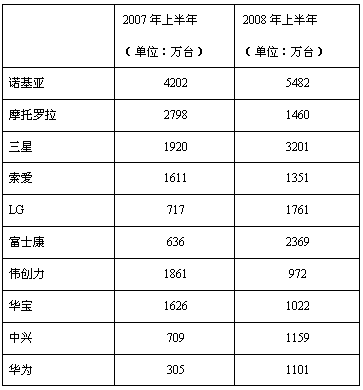
2008年上半年中国手机出口大约为2.48亿部,出口金额为147亿美元,平均出口价格为59.3美元。
2007年,中国地区输出了大约全球51%的手机;其次是东欧,主要是波兰、爱沙尼亚、罗马尼亚,主要厂商是诺基亚和索尼爱立信。印度则输出了11%的手机,主要厂商是三星、LG和诺基亚,以CDMA为主。
2008年上半年主要手机出口企业出口量统计

中国手机出口目的地(按出口数量排名)主要是香港、美国、印度、匈牙利、新加坡、德国、俄罗斯、印度尼西亚、巴基斯坦等。
本报告数据来源于中国海关和信息产业部,对手机出口市场现状、出口企业、主要出口目的地等进行了深入研究。
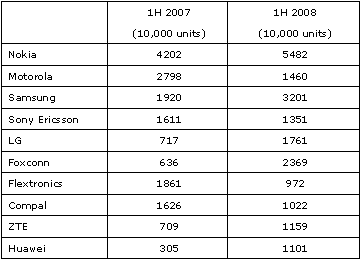
In the first half year of 2008, China’s mobile phone export volume reached 248 million units and its export value totaled US$14.7 billion, meaning that the average price per unit was US$59.3.
In 2007, China’s mobile phone export accounted for around 51% of the global total, followed by Eastern Europe including mainly Poland, Estonia and Romania, which exported handsets with brands of Nokia and Sony-Ericsson. Indian mobile phone export took up 11% of the global total, and its exports were mainly CDMA handsets with brands of Samsung, LG and Nokia.
Export Volume of Key Mobile Phone Manufacturers, 1H2008

Source: ResearchInChina
In order of export volume, Hong Kong, the U.S.A., India, Hungary, Singapore, Germany, Russia, Indonesia and Pakistan were on the top list of China’s mobile phone export destinations.
Based on the authoritative statistics from the General Administration of Customs and the Ministry of Industry and Information Technology, this report makes an in-depth analysis of the current situation of mobile phone export market, mobile phone export companies and major export destinations.
第一章:全球及中国手机产业概况
1.1、2007年全球手机市场现状
1.2、中国手机市场
1.3、中国手机产业概况
第二章:中国手机出口概况
第三章:主要出口企业研究
3.1、富士康
3.2、诺基亚
3.3、摩托罗拉
3.3、三星
3.4、索尼爱立信
3.5、LG
3.6、伟创力
3.7、华为
3.8、中兴通讯
3.9、华冠通讯
3.10、华宝
3.11、TCL
3.12、波导
3.13、富港电子
3.14、东莞航天电子
3.15、西可通信
第四章:中国手机主要出口国家其市场研究
4.1、印度
4.2、新加坡
4.3、俄罗斯联邦
4.4、印度尼西亚
4.5、巴基斯坦
4.6、尼日利亚
4.7、泰国
4.8、阿联酋
4.9、委内瑞拉
4.10、巴西
4.11、澳大利亚
4.12、越南
4.13、土耳其
4.14、西班牙
4.16、非洲概述
4.17、其他
4.17.1、尼泊尔
4.17.2、、叙利亚
4.17.3、南非
4.17.4、罗马尼亚
4.17.5、法国
4.17.6、德国
4.17.7、墨西哥
4.17.8、韩国、匈牙利、香港、美国
1. Overview of Global and China’s Mobile Phone Industry
1.1 Global Mobile Phone Market, 2007
1.2 China’s Mobile Phone Market
1.3 Overview of China’s Mobile Phone Industry
2. China’s Mobile Phone Export
3. Key Mobile Phone Exporting Companies
3.1 Foxconn
3.2 Nokia
3.3 Motorola
3.3 Samsung
3.4 Sony Ericsson
3.5 LG
3.6 Flextronics
3.7 Huawei
3.8 ZTE
3.9 Arima
3.10 Compal
3.11 TCL
3.12 Bird
3.13 Foxlink
3.14 Dongguan Aerospace Electronics Limited
3.15 CK-Telecom
4. Key Export Destinations
4.1 India
4.2 Singapore
4.3 Russian Federation
4.4 Indonesia
4.5 Pakistan
4.6 Nigeria
4.7 Thailand
4.8 United Arab Emirates
4.9 Venezuela
4.10 Brazil
4.11 Australia
4.12 Vietnam
4.13 Turkey
4.14 Spain
4.16 Africa
4.17 Other Regions
4.17.1 Nepal
4.17.2 Syria
4.17.3 South Africa
4.17.4 Romania
4.17.5 France
4.17.6 Germany
4.17.7 Mexico
4.17.8 South Korea, Hungary, Hong Kong and USA
2005-2011年全球手机出货量统计及预测
2007年手机地区出货量比例统计
2007年上半年中国手机主要品牌市场占有率
1999-2008年中国手机出口量统计及预测
2002-2008年中国手机出口金额统计及预测
富士康2004-2007年员工数与员工平均收入
富士康2005、2006年地域收入结构
2003年到2007年富士康国际收入与毛利率统计
FIH产品开发流程
2005年3季度到2008年2季度诺基亚手机地域出货量结构统计
2005年3季度到2008年2季度诺基亚手机出货量与平均销售价格统计
2005年3季度到2008年2季度诺基亚手机销售额与运营利润率统计
诺基亚2005年3季度到2008年2季度每季度手机中国地区出货量统计
2008年上半年诺基亚中国手机出口地域比例结构
摩托罗拉06年1季度到08年2季度手机销售额与运营利润率统计
摩托罗拉06年1季度到08年2季度手机出货量与市场占有率统计
三星2001-2007年手机出货量与年增幅统计与预测
三星2005年1季度到2008年2季度每季度手机出货量统计
2005年1季度到2008年2季度三星手机出口平均价格与运营利润率统计
2008年上半年三星中国手机出口地域比例结构
2005年1季度到2008年2季度索尼爱立信出货量与平均销售价格统计
2006年1季度到2008年2季度索尼爱立信收入与运营利润率统计
2008年索爱中国手机出口地域比例解雇
2001-2007年LG手机出货量与年增幅统计及预测
2005年4季度到2008年2季度LG手机每季度出货量(按制式)
2006年1季度到2008年2季度LG手机每季度销售额与运营利润统计
2006年1季度到2008年2季度LG 手机部门地域收入结构
LG 2006年2季度到2008年2季度销售额、平均价格统计
2008年上半年LG中国手机出口地域结构比例
伟创力2006年1季度到2008年1季度收入与运营利润率统计
伟创力2005年4季度到2008年2季度产品收入结构
伟创力核心战略
2008年华为集团手机出口地域结构比例
2008年上半年手机出口地域结构比例
华冠通讯组织结构
华冠全球布局
2002-2009年华冠通讯收入与毛利率统计及预测
华冠通讯大陆投资结构图
华冠通讯研究人力资源分布
华冠通讯智能手机路线图
2008年上半年华冠中国公司手机出口地域结构比例
华宝公司结构
2001-2008年华宝通讯营业收入与毛利率统计与预测
2008年上半年华宝中国公司手机出口地域结构比例
TCL通讯组织结构图
2002年-2007年TCL通讯收入与毛利率统计
2002-2007年TCL通讯研发、销售、行政支出统计
2008年上半年TCL中国公司手机出口地域结构比例
波导股份结构
2000年-2007年波导手机历年销量
2008年上半年富港中国公司手机出口地域结构比例
2008年上半年印度进口中国手机各厂家的比例(按进口量)
2008年上半年新加坡进口中国手机各厂家的比例(按进口量)
2008年上半年俄罗斯联邦进口中国手机各厂家的比例(按进口量)
2008年上半年印度尼西亚进口中国手机各厂家的比例(按进口量)
2008年上半年巴基斯坦进口中国手机各厂家的比例(按进口量)
尼日利亚手机主要厂家市场占有率
2008年上半年尼日利亚进口中国手机各厂家的比例(按进口量)
2008年上半年泰国进口中国手机各厂家的比例(按进口量)
2008年上半年阿联酋进口中国手机各厂家的比例(按进口量)
2008年上半年委内瑞拉进口中国手机各厂家的比例(按进口量)
2008年上半年巴西进口中国手机各厂家的比例(按进口量)
2008年上半年澳大利亚进口中国手机各厂家的比例(按进口量)
2008年上半年墨西哥进口中国手机各厂家的比例(按进口量)
2008年上半年土耳其进口中国手机各厂家的比例(按进口量)
2008年上半年土耳其进口中国手机各厂家的比例(按进口量)
非洲各国手机普及率
2002-2012非洲手机用户统计及预测
2007年3季度非洲主要国家手机用户数统计
2008年上半年南非进口中国手机各厂家的比例(按进口量)
2008年上半年罗马尼亚进口中国手机各厂家的比例(按进口量)
2008年上半年法国进口中国手机各厂家的比例(按进口量)
2008年上半年德国进口中国手机各厂家的比例(按进口量)
2008年上半年墨西哥进口中国手机各厂家的比例(按进口量)
2007年1季度、2008年1季度全球五大手机厂家市场占有率
2007年全球前14大手机品牌厂家销量
2007年全球排名前15位手机厂家产量(单位:百万部)
2007年、2008年1季度中国40家主要手机厂家产量、销售额、基频提供者
2008年上半年前20大手机出口集团手机出口量统计
2008年上半年48家主要手机出口企业出口量统计
中国手机出口量前35位国家排名及平均出口价格
2008年上半年各海关手机出口量统计
伟创力中国生产基地一览表
2004-2007年华冠年产能统计与预测
华冠通讯大陆投资公司简介
华冠通讯大陆企业2007年财务状况一览
TCL通讯2005年2季度到2008年1季度手机销量与销售额统计
2005、2006、2007年波导销量、销售额、平均价格统计
波导子公司简介与2007年业绩
Global Mobile Phone Shipment and Its Forecasts, 2005-2011
Proportions of Regional Mobile Phone Shipment, 2007
Market Shares of China’s Main Mobile Phone Brands, 1H2007
Statistics & Forecasts of China Mobile Phone Export Volume, 1999-2008
Statistics & Forecasts of China’s Mobile Phone Export Value, 2002-2008
Foxconn’s Employee Quantity and Average Salary, 2004-2007
Foxconn’s Regional Revenue Structure, 2005-2006
Foxconn’s Global Revenue and Gross Profit, 2003-2007
FIH Product Development Process
Nokia Mobile Phone’s Regional Shipment Structure, Q3 2005-Q2 2008
Nokia Handset Shipment and Average Selling Prices, 3Q2005-2Q2008
Nokia Handset Sales and Operating Profit Rates, 3Q2005-2Q2008
Nokia Shipment in China, 3Q2005-2Q2008
Proportions of Nokia Handset Export Regions in China, H1 2008
Motorola Handset Sales and Operating Profit Rates, Q1 2006-Q2 2008
Motorola Handset Shipment and Market Shares, Q1 2006-Q2 2008
Samsung Handset Shipment and Growth Margin, 2001-2007
Samsung Handset Shipment by Quarter, Q1 2005-Q2 2008
Samsung Average Price of Handset Export & Profit Rates, 1Q2005-2Q2008
Samsung Export Regions in China, H1 2008
Proportions of Samsung Handset Export Regions in China, 1H2008
Sony-Ericsson Shipment and Average Selling Prices, Q1 2005-Q2 2008
Sony-Ericsson Revenue and Operating Profit Rates, Q1 2006-Q2 2008
Proportions of Sony-Ericsson Export Regions in China, 2008
LG Shipment and Growth Margins, 2001-2007
LG Mobile Phone Shipment by Mode, Q4 2005-Q2 2008
LG Handset Sales and Operating Profit Rate by Quarter, Q1 2006-Q2 2008
LG Handset Revenue Structure by Region, Q1 2006-Q 2 2008
Proportions of LG Export Regions in China, H1 2008
Flextronics Revenue and Operating Profit Rates, Q1 2006-Q1 2008
Flextronics Revenue Structure, Q4 2005-Q2 2008
Flextronics Core Strategy
Proportions of Huawei Handset Export Destinations, 2008
Company Structure of Arima
Global Layout of Arima
Arima Revenue and Gross Profit and Forecast, 2002-2009
Arima Human Resource Distribution
Proportions of Arima (China) Handset Export Destinations, H1 2008
Company Structure of Compal
Compal Operating Revenue and Gross Profit and Forecast, 2001-2008
Proportions of Compal (China) Handset Export Destinations, H1 2008
Company Structure of TCL Communication Technology Holdings Ltd.
Revenue and Gross Profit of TCL Communication, 2002-2007
R&D, Sales and Administrative Expense of TCL Communication, 2002-2007
Proportions of TCL Communication Handset Export Destinations, H1 2008
Bird Equity Structure
Bird Handset Sales, 2000-2007
Proportions of Foxlink (China) Handset Export Destinations, H1 2008
Proportions of Indian Import Handsets from Chinese Producers (by Import Volume), 1H2008
Proportions of Singapore Import Handsets from Chinese Producers (by Import Volume), 1H2008
Proportions of Russia Import Handsets from Chinese Producers (by Import Volume), 1H2008
Proportions of Indonesia Import Handsets from Chinese Producers (by Import Volume), 1H2008
Proportions of Pakistan Import Handsets from Chinese Producers (by Import Volume), 1H2008
Market Shares of Nigeria’s Key Mobile Phone Manufacturers
Proportions of Thailand Import Handsets from Chinese Producers (by Import Volume), 1H2008
Proportions of United Arab Emirates Import Handsets from Chinese Producers (by Import Volume), 1H2008
Proportions of Venezuelan Import Handsets from Chinese Producers (by Import Volume), 1H2008
Proportions of Brazilian Import Handsets from Chinese Producers (by Import Volume), 1H2008
Proportions of Australia Import Handsets from Chinese Producers (by Import Volume), 1H2008
Proportions of Mexican Import Handsets from Chinese Producers (by Import Volume), 1H2008
Proportions of Turkish Import Handsets from Chinese Producers (by Import Volume), 1H2008
Popularity Rate of Mobile Phone in Africa
Statistics & Forecast of African Mobile Phone Subscribers, 2002-2012
Proportions of South Africa Import Handsets from Chinese Producers (by Import Volume), 1H2008
Proportions of Romania Import Handsets from Chinese Producers (by Import Volume), 1H2008
Proportions of France Import Handsets from Chinese Producers (by Import Volume), 1H2008
Proportions of Germany Import Handsets from Chinese Producers (by Import Volume), 1H2008
Market Shares of Global Five Big Handset Producers, 1Q2007-1Q2008
Sales of Global Top 14 Mobile Phone Manufacturers, 2007
Output of Global Top 15 Mobile Phone Manufacturers, 2007
Export Volume of Top 20 Handset Export Companies, 1H2008
Export Volume of 48 Key Handset Export Companies, 1H2008
Top 35 Export Nations of China Handsets In Terms of Export Volume and Average Price per Unit of the Exports
Flextronics Production Bases in China
Arima Annual Production Capacity, 2004-2007
Companies in Mainland China Invested by Arima
Handset Sales Volume & Sales Value of TCL Communication, 2Q2005-1Q2008
Sales Volume & Sales Value of Bird Handsets and Average Price, 2005-2007
Bird Performance in 2007
如果这份报告不能满足您的要求,我们还可以为您定制报告,请 留言说明您的详细需求。
|