|
报告导航:研究报告—
金融与服务业—金融业
|
|
2008年中国证券业兼并重组研究报告 |
 |
字数:3.1万 |
页数:73 |
图表数:70 |
|
中文电子版:7500元 |
中文纸版:3750元 |
中文(电子+纸)版:8000元 |
|
英文电子版:1800美元 |
英文纸版:1700美元 |
英文(电子+纸)版:2100美元 |
|
编号:FY083
|
发布日期:2008-09 |
附件:下载 |
 |
|
|
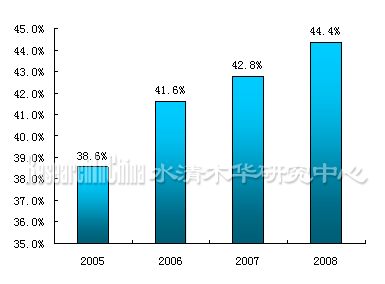
中国证券公司的数量由2004 年的134家下降到2008 年的107 家,通过证券公司的托管、收购使排名靠前的证券公司市场份额出现跨跃式增长。行业内证券公司的规模已经开始拉开差距,但是市场竞争仍然十分激烈,行业内占主导地位的券商并未形成。
中国证券公司的赢利主要依赖于证券经纪业务和自营的证券投资业务。而经纪业务和自营业务都依赖于股市的好坏,这也是中国券商的局限性。而对于赢利比较稳定的投行业务及资产管理业务,外资券商相对于国内券商来说,具有明显的优势。
图:经纪业务前十位券商所占市场份额

数据整理:水清木华研究中心
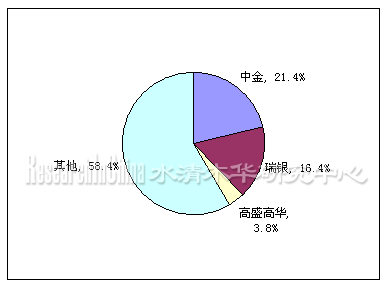
截止到2008年8月,国内合资券商有7家:分别是中金公司、高盛高华、瑞银证券、中银国际、华欧国际、海际大和、瑞信方正证券。其中经营情况较好的是中金、瑞银和高盛高华,在2007年A股IPO项目中,这三家所占的份额就达到41.6%。
图:2007年A股IPO项目中合资券商所占份额

数据整理:水清木华研究中心
经营较好的这三家合资公司都属于一方掌握控制权的情况,比如中金中的中资方,瑞银和高盛高华中的外资方。而对于其他中外双方在管理上没有明确的主导方的合资公司,赢利情况并不理想。2007年还出现合资券商长江巴黎百富勤合资双方分手的情况。
本报告依据证监会、证券行业协会、证券公司年报等权威数据以及案例进行研究,对中国证券行业兼并重组的现状、政策环境、并购案例及重点证券公司进行了分析,并指出了中国证券行业兼并重组的趋势及其中的风险。
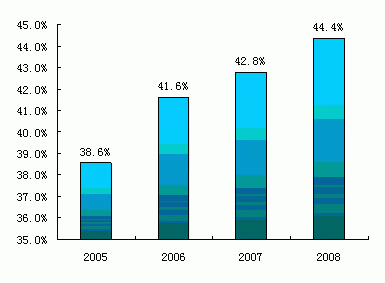
China Securities Companies' number declined to 107 in 2008 from 134 in 2004. Meanwhile market share of top securities companies had realized leaping growth through entrusting and acquisitions. There has been a large scale gap among companies; however, the market competition is still intense and the king has not emerged yet.
China securities companies mainly gain profit from brokerage service and self-operations, which both simply depend on the performance of stock market, but for the services such as investment banking and asset management, foreign competitors have obvious advantages.
Market Share Distribution of Top 10 Securities Companies by Brokerage Service

Source: ResearchInChina
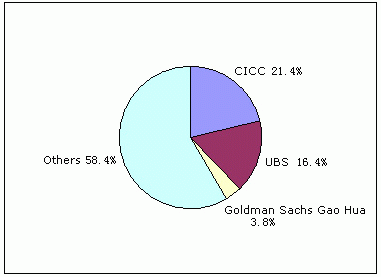
By Aug 2008, China has seven joint venture brokers as follows: CICC, Goldman Sachs Gao Hua, UBS, BOC, CESL, Daiwa SMBC-SSC Securities and CS Founder Securities. Among which, CICC, Goldman Sachs Gao Hua and UBS together shared 41.6% of IPO projects in China stock market.
Market Share Distribution of Joint Venture Securities Companies
by IPO Projects in China Stock Market, 2007

Source: ResearchInChina
Moreover, the control power of the top three is held by one party, for example, CICC is controlled by China side but UBS and Goldman Sachs Gao Hua are controlled by foreign side. As for others without clear dominators, they had a less profitability.
Based on authoritative statistics of CSRC and China Securities Industry Association, this report analyses the status quo of china securities industry merger and acquisitions, as well as the political environment, M&A cases and key companies, and also points out the M&A trends and risks.
第一章 中国证券市场发展概况
1.1 市场规模
1.1.1 股票市场
1.1.2 债券市场
1.1.3 期货市场
1.2 影响证券市场长期发展的因素
1.2.1 宏观经济基本面
1.2.2 证券市场的改革
1.2.3 人民币升值
1.3 中国证券业的政策分析
第二章 中国证券市场的竞争格局
2.1 中国证券公司概况
2.1.1 规模及数量
2.1.2 业务构成
2.1.3 盈利情况
2.2 行业集中度
2.3 合资券商
2.4 证券市场的潜在竞争者
第三章 中国证券业参股并购现状
3.1 上市公司投资证券业的趋势分析
3.2 中国证券业兼并重组的趋势
3.3 中国证券业兼并重组的障碍
第四章 中国主要证券公司竞争力及兼并重组趋势分析
4.1 中信证券
4.1.1 公司的运营情况
4.1.2公司在行业中的地位
4.1.3 公司兼并重组案例
4.1.4 公司的市场网络
4.2 海通证券
4.2.1 公司的运营情况
4.2.2 公司在行业中的地位
4.2.3 公司的兼并重组项目
4.2.4 公司的市场网络
4.3 国泰君安
4.3.1 公司的运营情况
4.3.2 公司在行业中的地位
4.3.3 公司的市场网络
4.4 广发证券
4.4.1 公司的运营情况
4.4.2 公司在行业中的地位
4.4.3 公司的兼并重组项目
4.4.4 公司的市场网络
4.5 银河证券
4.5.1 公司的运营情况
4.5.2 公司在行业中的地位
4.5.3 公司的兼并重组项目
4.5.4 公司的市场网络
4.6 申银万国
4.6.1 公司的运营情况
4.6.2 公司在行业中的地位
4.6.3 公司的兼并重组项目
4.6.4 公司的市场网络
4.7 国信证券
4.7.1 公司的运营情况
4.7.2 公司在行业中的地位
4.7.3 公司的兼并重组项目
4.7.4 公司的市场网络
4.8 光大证券
4.8.1 公司的运营情况
4.8.2 公司在行业中的地位
4.8.3 公司的兼并重组项目
4.8.4 公司的市场网络
4.9 东方证券
4.9.1 公司的运营情况
4.9.2 公司在行业中的地位
4.9.3 公司的兼并重组项目
4.9.4 公司的市场网络
4.10 招商证券
4.10.1 公司的运营情况
4.10.2 公司在行业中的地位
4.10.3 公司的兼并重组项目
4.10.4 公司的市场网络
第五章 外资券商进入中国的模式分析
5.1 高盛高华
5.1.1 进入模式
5.1.2 高盛在合资公司中的地位及公司的业务范围
5.1.2 高盛高华的运营情况
5.2 中金公司
5.2.1 合资方式
5.2.2 中金的运营情况
5.2.3 合资的困境
5.3 瑞银证券
5.3.1 重组北京证券
5.3.2 瑞银在合资证券中的地位
5.3.3 瑞银证券的运营情况
5.4 瑞信方正证券
5.4.1 合资方式
5.4.2 合资方方正证券的相关情况
5.4.3 瑞信方正的管理
第六章 中国建立合资券商的风险及趋势分析
6.1 合资券商的退出案例
6.2 合资证券的风险分析
6.3 建立合资券商的趋势分析
第七章 总结
1. Overview of China Securities Market
1.1 Market Scale
1.1.1 Stock Market
1.1.2 Bond Market
1.1.3 Futures Market
1.2 Influential Factors of Securities Market Long-term Development
1.2.1 Macroeconomic Conditions
1.2.2 Securities Market Reform
1.2.3 RMB Appreciation
1.3 Policy Analysis
2. Competition Pattern of China's Securities Industry
2.1 Overview of China Securities Companies
2.1.1 Scale and Numbers
2.1.2 Business Structure
2.1.3 Profitability
2.2 Industry Concentration
2.3 Joint Venture Securities Companies
2.4 Potential Competitors
3. M&A of China's Securities Industry
3.1 Investment Trend
3.2 M&A Trend
3.3 M&A Obstacles
4.Competitiveness and M&R Analysis of Major Securities Companies
4.1 CITIC Securities Co., Ltd (CITICS)
4.1.1 Business Operation
4.1.2 Market Position
4.1.3 M&R Cases
4.1.4 Marketing Networks
4.2 Haitong Securities Co., Ltd
4.2.1 Business Operation
4.2.2 Market Position
4.2.3 M&R Cases
4.2.4 Marketing Networks
4.3 Guotai Junan Securities Co., Ltd. (GTJA)
4.3.1 Business Operation
4.3.2 Market Position
4.3.3 Marketing Networks
4.4 GF Securities Co., Ltd (GF)
4.4.1 Business Operation
4.4.2 Market Position
4.4.3 M&R Cases
4.4.4 Marketing Networks
4.5 China Galaxy Securities Co., Ltd
4.5.1 Business Operation
4.5.2 Market Position
4.5.3 M&R Cases
4.5.4 Marketing Networks
4.6 Shenyin & Wanguo Securities Co., Ltd. (SYWG)
4.6.1 Business Operation
4.6.2 Market Position
4.6.3 M&R Cases
4.6.4 Marketing Networks
4.7 Guosen Securities Co., Ltd
4.7.1 Business Operation
4.7.2 Market Position
4.7.3 M&R Cases
4.7.4 Marketing Networks
4.8 Everbright Securities Co., Ltd
4.8.1 Business Operation
4.8.2 Market Position
4.8.3 M&R Cases
4.8.4 Marketing Networks
4.9 Orient Securities Co., Ltd
4.9.1 Business Operation
4.9.2 Market Position
4.9.3 M&R Cases
4.9.4 Marketing Networks
4.10 China Merchants Securities Co., Ltd
4.10.1 Business Operation
4.10.2 Market Position
4.10.3 M&R Cases
4.10.4 Marketing Networks
5. Market Entry Mode of Foreign Securities Companies
5.1 Goldman Sachs Gao Hua Securities
5.1.1 Entry Mode
5.1.2 Goldman's Position in the Joint-venture and Business Scope
5.1.2 Operation Status
5.2 CICC
5.3 UBS Securities
5.4 CS Founder Securities
6. Risks and Trend of Establishing Joint Venture Securities Companies in China
6.1 Withdraw cases
6.2 Risks Analysis
6.3 Trend Analysis
7. Conclusion
图1-1 2000-2008年8月中国股票市场总市值
图1-2 2000-2008中国证券市场投资者开户数
图1-3 2000-2008中国股票市场上市公司数
图1-4 2007年债券发行类别
图1-5 2007各债券托管量占比
图1-6 2007各机构持有债券量占比
图1-7 2001-2008中国期货市场成交额
图1-8 07、08一季度三大交易所所占市场份额对比
图1-9 大小非解禁金额及规模的变化
图1-10 人民币长期升值趋势
图2-1 净利润排名前十名的证券公司的业务构成
图2-2 2000-2008上半年证券行业利润变化情况
图2-3 经纪业务前十位券商所占市场份额
图2-4 资产管理规模前五位公司所占市场份额
图2-5 2007年A股IPO项目中合资券商所占份额
图3-1 2000-2008证券业投资的地区分布
图4-1 2005-2007中信证券总资产及所有者权益增长情况
图4-2 海通证券业务构成
表1-1 我国期货交易市场与上市品种
表1-2 2007年期货交易所交易情况统计
表1-3 证监会关于券商开展业务的要求
表2-1 中国证券公司数量
表2-2 2005-2007年净资本排名前十位的创新类券商净资本情况
表2-3 2007年证券公司股票及债券承销金额排名TOP20
表2-4 2007年度证券公司营业收入和净利润
表2-5 2007年经纪业务排名前十位的证券公司
表2-6 2007年承销金额及市场份额前十大证券公司
表3-1 2000-2008年投资于证券业的年度走势
表3-2 2005年6月30日至2008年6月30日重点的投资项目
表4-1 2005-2007中信证券营业收入及利润增长情况
表4-2 2007年中信证券在行业中的排名
表4-3 中信证券2000至2008的主要参股并购项目
表4-4 中信证券的营业部数量及地区分布
表4-5 2005-2007年海通证券的主要财务数据
表4-6 2007年海通证券在行业中的排名
表4-7 海通证券2000-2008最新投资项目
表4-8 海通证券的营业部地区分布
表4-9 2006-2007国泰君安主要财务指标
表4-10 2007年国泰君安在行业中的排名
表4-11 国泰君安营业部数量及地区分布
表4-12 2006-2007年广发证券主要财务指标
表4-13 2007年广发证券在行业中的排名
表4-14 广发证券营业部数量及地区分布
表4-15 2007年银河证券主要财务指标
表4-16 2007年银河证券在行业中的排名
表4-17 银河证券的营业部数量和地区分布
表4-18 2006-2007年申银万国主要财务指标
表4-19 2007年申银万国在行业中的排名
表4-20 申银万国的营业部数量及分布
表4-21 2006-2007年国信证券主要财务指标
表4-22 2007年国信证券在行业中的排名
表4-23 国信证券的营业部数量及分布
表4-24 2005-2007光大证券主要财务指标
表4-25 2005-2007年光大证券各项指标在行业中的排名
表4-26 2007年光大证券在行业中的排名
表4-27 2006-2007年东方证券主要财务指标
表4-28 2007年东方证券在行业中的排名
表4-29 东方证券的营业部地区分布
表4-30 2006-2007年招商证券主要财务指标
表4-31 2007年招商证券在行业中的排名
表4-32 招商证券各地区营业部分布及其规模
表5-1 2006-2007高盛高华主要财务指标
表5-2 2007年高盛高华在行业中的排名
表5-3 2006-2007中金主要财务指标
表5-4 2007年中金在行业中的排名
表5-5 2006-2007华鑫证券主要财务指标
表5-6 2007年华鑫证券在行业中的排名
表5-7 2007年瑞银证券在行业中的排名
表5-8 2006-2007方正证券主要财务指标
表5-9 2007年方正证券在行业中的排名
Total Market Value of China Stock Market, 2000-2008
Number of Opening Account of China Securities Market, 2000-2008
Bond Types Issued in 2007
Trusteeship Proportion of Various Bonds, 2007
Bond Proportion Held by various Institutions, 2007
Trade Volume in China Futures Market, 2001-2008
RMB Appreciation Trend
Business Structure of the Top Ten Securities Companies by Net Profit
Profit of Securities Industry, 2000-1H2008
Market Share Distribution of the Top Five Securities Companies by Assets Management Scale
Securities Industry Investment by Region, 2000-2008
Growth of Total Assets and Shareholders' Equity of CITIC, 2005-2007
Business Structure of Haitong Securities
Trade Statistics of China Futures Exchanges, 2007
Requirements of CSRC for Brokers
Number of China Securities Companies
Net Capital of the Top Ten Innovating Brokers, 2005-2007
TOP 20 Securities Companies by Sales Volume of Stock and Bond, 2007
Operating Revenue and Net Profit of Securities Companies, 2007
Top Ten Securities Companies by Brokerage Service, 2007
Top Ten Securities Companies by Sales Volume and Market Share, 2007
Investment Trend of Securities Industry, 2000-2008
Key Investment Projects, Jun 30 2005-Jun 30 2008
Sales Revenue and Profit Growth of China Securities Industry, 2005-2007
Main Acquisition Projects of CITIC, 2000-2008
Regional Distribution and Number of CITIC's branches
Financial Result of Haitong Securities, 2005-2007
Haitong's New Investment Project, 2000-2008
Financial Result of Guotai Junan Securities, 2006-2007
如果这份报告不能满足您的要求,我们还可以为您定制报告,请 留言说明您的详细需求。
|