|
|
|
报告导航:研究报告—
金融与服务业—零售与日用
|
|
2008年中国外贸行业上市公司研究报告 |
 |
字数:3.2万 |
页数:101 |
图表数:126 |
|
中文电子版:3000元 |
中文纸版:1500元 |
中文(电子+纸)版:3500元 |
|
英文电子版:1099美元 |
英文纸版:999美元 |
英文(电子+纸)版:1399美元 |
|
编号:HJ001
|
发布日期:2009-05 |
附件:无 |
 |
|
|
进出口贸易一直是中国经济增长的引擎,典型的外向型经济结构致使中国经济的对外依存度不断加大,在开放经济的环境下国际经济、金融波动对国内的影响也随之加深。
本报告首先介绍了中国外贸行业的发展现状和未来趋势,然后详细分析了20家外贸重点公司的运营和营收情况、项目投资情况、主营构成、最新动态和未来走势等。
下面是对江苏国泰的分析图表示例:
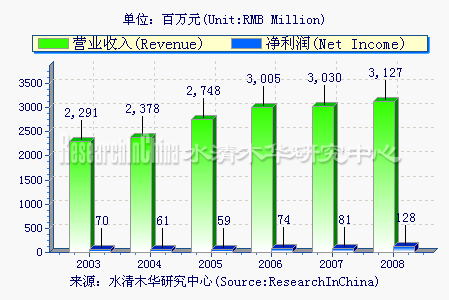
2003-2008年江苏国泰的营业额和利润走势
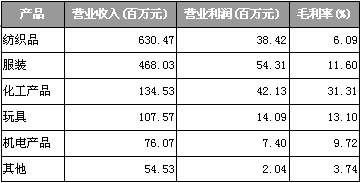
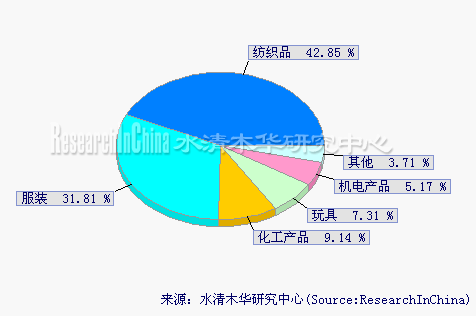
2008年江苏国泰按产品的收入结构
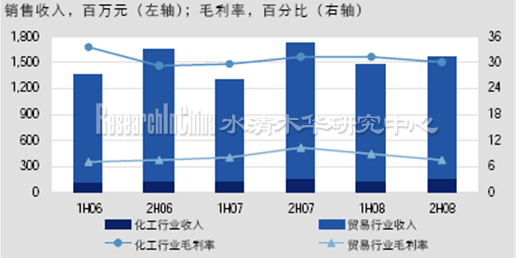
2006-2008江苏国泰业务结构
来源:公司公告
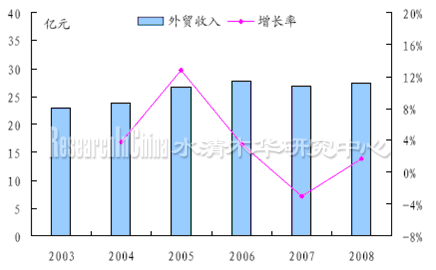
2003-2008年江苏国泰外贸收入及增长率
来源:公司财报
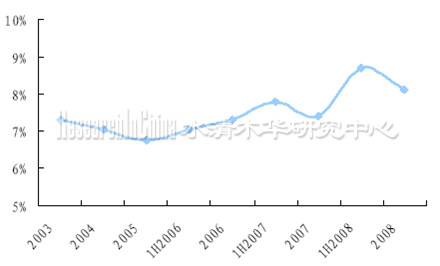
图: 2003-2008年江苏国泰外贸业务毛利率
来源:公司财报
The foreign trade is always the force for Chinese economic growth. The foreign-oriented economic structure leads Chinese economy highly relies on foreign trade.
This report gives an in-depth analysis of the status quo and future developments of Chinese foreign trade industry, and focus on the twenty key foreign trade companies in China.
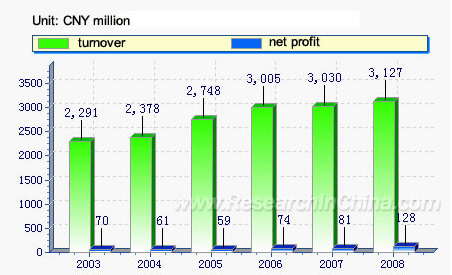
Turnover and Profit of Guotai International Group, 2003-2008
Source: ResearchInChina
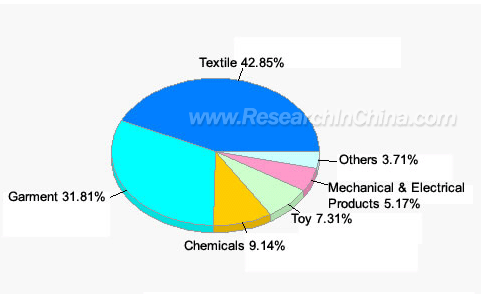
Revenue Structure by Product of Guotai International Group, 2008

Source: ResearchInChina
Business Structure of Guotai International Group, 2006-2008
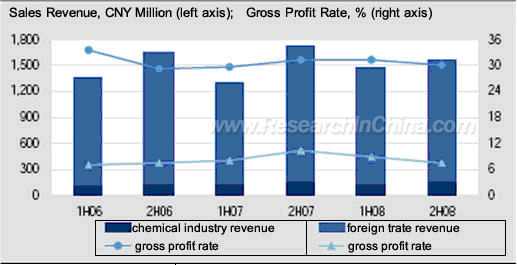
Source: Company Financial Statement
Foreign Trade Revenue and Growth Rate of Guotai International Group, 2003-2008
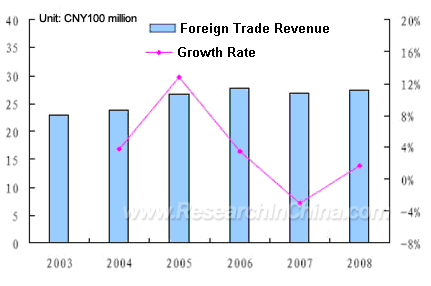
Source: Company Financial Statement
第一章 2008年中国外贸行业发展概述
1.1 中国外贸行业发展概况
1.2 中国外贸行业的市场现状
1.3 外贸行业上市公司总体数据分析
第二章 纺织服装类外贸公司分析
2.1 新华锦(600735)
2.1.1 公司简介
2.1.2 2003-2008年的运营和营收情况
2.1.3 项目投资情况
2.1.4 2007-2008年的主营构成分析
2.1.5 最新市场动向和未来发展走势
2.2 申达股份(600626)
2.2.1 公司简介
2.2.2 2003-2008年的运营和营收情况
2.2.3 项目投资情况
2.2.4 2007-2008年的主营构成分析
2.2.5 最新市场动向和未来发展走势
2.3 辽宁时代(600241)
2.3.1 公司简介
2.3.2 2003-2008年的运营和营收情况
2.3.3 项目投资情况
2.3.4 2007-2008年的主营构成分析
2.3.5 最新市场动向和未来发展走势
2.4 江苏国泰(002091)
2.4.1 公司简介
2.4.2 2003-2008年的运营和营收情况
2.4.3 项目投资情况
2.4.4 2007-2008年的主营构成分析
2.4.5 最新市场动向和未来发展走势
2.5 浙江东方(600120)
2.5.1 公司简介
2.5.2 2003-2008年的运营和营收情况
2.5.3 项目投资情况
2.5.4 2007-2008年的主营构成分析
2.5.5 最新市场动向和未来发展走势
2.6 弘业股份(600128)
2.6.1 公司简介
2.6.2 2003-2008年的运营和营收情况
2.6.3 项目投资情况
2.6.4 2007-2008年的主营构成分析
2.6.5 最新市场动向和未来发展走势
2.7 江苏舜天(600287)
2.7.1 公司简介
2.7.2 2003-2008年的运营和营收情况
2.7.3 项目投资情况
2.7.4 2007-2008年的主营构成分析
2.7.5 最新市场动向和未来发展走势
2.8 辽宁成大(600739)
2.8.1 公司简介
2.8.2 2003-2008年的运营和营收情况
2.8.3 项目投资情况
2.8.4 2007-2008年的主营构成分析
2.8.5 最新市场动向和未来发展走势
2.9 江苏开元(600981)
2.9.1 公司简介
2.9.2 2003-2008年的运营和营收情况
2.9.3 项目投资情况
2.9.4 2007-2008年的主营构成分析
2.9.5 最新市场动向和未来发展走势
第三章 冶金化工类外贸公司分析
3.1 中化国际(600500)
3.1.1 公司简介
3.1.2 2003-2008年的运营和营收情况
3.1.3 项目投资情况
3.1.4 2007-2008年的主营构成分析
3.1.5 最新市场动向和未来发展走势
3.2 五矿发展(600058)
3.2.1 公司简介
3.2.2 2003-2008年的运营和营收情况
3.2.3 项目投资情况
3.2.4 2007-2008年的主营构成分析
3.2.5 最新市场动向和未来发展走势
3.3 上海物贸(600822)
3.3.1 公司简介
3.3.2 2003-2008年的运营和营收情况
3.3.3 项目投资情况
3.3.4 2007-2008年的主营构成分析
3.3.5 最新市场动向和未来发展走势
第四章 2007-2008年综合类外贸上市公司分析
4.1 建发股份(600153)
4.1.1 公司简介
4.1.2 2003-2008年的运营和营收情况
4.1.3 项目投资情况
4.1.4 2007-2008年的主营构成分析
4.1.5 最新市场动向和未来发展走势
4.2 厦门国贸(600755)
4.2.1 公司简介
4.2.2 2003-2008年的运营和营收情况
4.2.3 项目投资情况
4.2.4 2007-2008年的主营构成分析
4.2.5 最新市场动向和未来发展走势
4.3 如意集团(000626)
4.3.1 公司简介
4.3.2 2003-2008年的运营和营收情况
4.3.3 项目投资情况
4.3.4 2007-2008年的主营构成分析
4.3.5 最新市场动向和未来发展走势
4.4 兰生股份(600826)
4.4.1 公司简介
4.4.2 2003-2008年的运营和营收情况
4.4.3 项目投资情况
4.4.4 2007-2008年的主营构成分析
4.4.5 最新市场动向和未来发展走势
4.5 中大股份(600704)
4.5.1 公司简介
4.5.2 2003-2008年的运营和营收情况
4.5.3 项目投资情况
4.5.4 2007-2008年的主营构成分析
4.5.5 最新市场动向和未来发展走势
4.6 中成股份(000151)
4.6.1 公司简介
4.6.2 2003-2008年的运营和营收情况
4.6.3 项目投资情况
4.6.4 2007-2008年的主营构成分析
4.6.5 最新市场动向和未来发展走势
4.7 银泰股份(600683)
4.7.1 公司简介
4.7.2 2003-2008年的运营和营收情况
4.7.3 项目投资情况
4.7.4 2007-2008年的主营构成分析
4.7.5 最新市场动向和未来发展走势
4.8 大连国际(000881)
4.8.1 公司简介
4.8.2 2003-2008年的运营和营收情况
4.8.3 项目投资情况
4.8.4 2007-2008年的主营构成分析
4.8.5 最新市场动向和未来发展走势
1. Chinese Foreign Trade Development in 2008
1.1 Overview
1.2 Market Status
1.3 Overall Statistics of Listed Foreign Trade Companies
2. Textile and Garment Companies
2.1 Hiking Group
2.1.1 Company Profile
2.1.2 Performance, 2003-2008
2.1.3 Project Investment
2.1.4 Business Structure, 2007-2008
2.1.5 Development Strategies
2.2 Shanghai Shenda Company Ltd
2.3 Liaoning Times Garments I/E INC
2.4 Jiangsu Guotai International Group
2.5 Zhejiang Orient Holdings Co., Ltd
2.6 Jiangsu Holly Corporation
2.7 Jiangsu SAINTY International Group
2.8 Liaoning Chengda Co., Ltd
2.9 Jiangsu Skyrun International Group
3. Metallurgy and Chemicals Companies
3.1 Sinochem International Corporation
3.1.1 Company Profile
3.1.2 Performance, 2003-2008
3.1.3 Project Investment
3.1.4 Business Structure, 2007-2008
3.1.5 Development Strategies
3.2 Minmetals Development Co., Ltd
3.3 Shanghai Material Trading Co., Ltd
4. Comprehensive Foreign Trade Companies
4.1 Xiamen C&D Inc
4.1.1 Company Profile
4.1.2 Performance, 2003-2008
4.1.3 Project Investment
4.1.4 Business Structure, 2007-2008
4.1.5 Development Strategies
4.2 Xiamen International Trade Group Co., Ltd
4.3 Lianyungang Ideal Group Co., Ltd
4.4 Shanghai Lansheng Co., Ltd
4.5 Zhejiang Zhongda Group
4.6 China National Complete Plant Import & Export Co., Ltd
4.7 Silvertie Holding Co., Ltd
4.8 China Dalian International Cooperation (Group) Holdings Ltd
图: 1978-2007年三大需求对GDP增长的贡献率( % )
图: 1978-2007年三大需求对GDP增长的拉动(%)
图: 2000年1月至2008年11月中国进出口商品总额和贸易顺差
图: 1980-2007年中国外贸依存度和出口依存度 (%)
图: 2002年1月至2008年11月中国与主要经济体间贸易总额
图: 2002年1月至2008年11月中国对主要经济体出口商品总额
图: 2008年1-11月中国进出口贸易结构(%)
图: 2008年1-11月中国出口贸易结构(%)
图: 2002年1月至2008年11月对欧盟/美国/日本月度出口总额累计同比增长率 (%)
图: 2002年1月至2008年11月对欧盟/美国/日本年度贸易顺差
图: 2001-2009年中国外贸形势
图: 2007.2至2009.3中国进出口同比增长(%)
表: 2008.3至2009.3中国月度进出口增速及顺差情况
表: 2008.3至2009.3中国月度累计进出口增速及顺差情况
图: 1996.3至2009.3中国出口三大贸易方式同比增长率
图: 2002Q1至2009Q1中国对主要出口国累计增速(%)
图: 1996.7至2009.3中国进口三大贸易方式同比增长率(%)
图: 2002.7-2009.3主要进口产品累计增速(%)
表: 2008 年外贸行业上市公司总资产排名
表: 2008 年外贸行业上市公司营业额排名表
表: 2008 年外贸行业上市公司利润排名
表: 2008 年外贸行业上市公司货币资金排名
图: 2003-2008年新华锦的营业额和利润走势
图: 2003-2008年新华锦的总资产和货币资金走势
图: 2008年新华锦按产品的收入结构
图: 2008年新华锦按行业的收入结构
表: 2008年新华锦分地区经营情况
图: 2003-2008年新华锦利润构成走势
图: 2003-2008年申达股份的营业额和利润走势
图: 2003-2008年申达股份的总资产和货币资金走势
图: 2008年申达股份按产品的收入结构
表: 2008年申达股份按行业的收入结构
表: 2008年申达股份分地区经营情况
图: 2003-2008年申达股份利润构成走势
图: 2003-2008年辽宁时代的营业额和利润走势
图: 2003-2008年辽宁时代的总资产和货币资金走势
表: 2007-2008年辽宁时代按产品的收入结构
图: 2007-2008年辽宁时代按行业的收入结构
表: 2008年辽宁时代主营业务分地区经营情况
图: 2003-2008年辽宁时代利润构成走势
图: 2003-2008年江苏国泰的营业额和利润走势
图: 2003-2008年江苏国泰的总资产和货币资金走势
图: 2008年江苏国泰按产品的收入结构
图: 2008年江苏国泰按行业的收入结构
图: 江苏国泰业务结构
图: 江苏国泰分市场外贸出口统计与预测
图: 2003-2008年江苏国泰外贸收入及增长
图: 2003-2008年江苏国泰外贸业务毛利率
图: 2003-2008年浙江东方的营业额和利润走势
图: 2003-2008年浙江东方的总资产和货币资金走势
表: 2008年浙江东方按行业的收入结构
表: 2008年浙江东方分地区经营情况
图: 2003-2008年弘业股份的营业额和利润走势
图: 2003-2008年弘业股份的总资产和货币资金走势
图: 2008年弘业股份按产品的收入结构
图: 2008年弘业股份按行业的收入结构
图: 2003-2008年江苏舜天的营业额和利润走势
图: 2003-2008年江苏舜天的总资产和货币资金走势
表: 2007-2008年江苏舜天按行业的收入结构
表: 2008年江苏舜天分地区经营情况
图: 2003-2008年辽宁成大的营业额和利润走势
图: 2003-2008年辽宁成大的总资产和货币资金走势
图: 2007-2008年辽宁成大按行业的收入结构
表: 2008年辽宁成大分地区经营情况
图: 2003-2008年江苏开元的营业额和利润走势
图: 2003-2008年江苏开元的总资产和货币资金走势
表: 2007-2008年江苏开元按行业的收入结构
图: 2003-2008年中化国际的营业额和利润走势
图: 2003-2008年中化国际的总资产和货币资金走势
图: 2008年中化国际按产品的收入结构
图: 2008年中化国际按行业的收入结构
图: 2005-2008年中化国际各板块毛利分布情况
图: 2005-2008年中化国际各板块毛利率情况
图: 2003-2008年五矿发展的营业额和利润走势
图: 2003-2008年五矿发展的总资产和货币资金走势
图: 2008年五矿发展按产品的收入结构
表: 2008年五矿发展按行业的收入结构
图: 主要钢铁流通企业钢材贸易量
图: 五矿发展主要业务构成
图: 五矿发展钢材贸易量走势
图: 五矿发展原材料贸易毛利率(%)
图: 2003-2008年上海物贸的营业额和利润走势
图: 2003-2008年上海物贸的总资产和货币资金走势
图: 2008年上海物贸按产品的收入结构
表: 2008年上海物贸分地区经营情况
图: 2003-2008年建发股份的营业额和利润走势
图: 2003-2008年建发股份的总资产和货币资金走势
表: 2008年建发股份按行业的收入结构
图: 建发股份1998-2007年主营业务收入
图: 建发股份1998-2007年净利润
图: 2008年建发股份各项业务收入构成比例
图: 2008年建发股份各项业务毛利构成比例
图: 1998-2008年建发股份进出口贸易额
图: 2004-2008年建发股份贸易业务结构
图: 2004-2008年建发股份贸易业务毛利率
图: 2004-2007年建发股份库存商品周转率
图: 2003-2008年厦门国贸的营业额和利润走势
图: 2003-2008年厦门国贸的总资产和货币资金走势
图: 2008年厦门国贸按行业的收入结构
表: 2008年厦门国贸分地区经营情况
图: 2003-2008年如意集团的营业额和利润走势
图: 2003-2008年如意集团的总资产和货币资金走势
表: 2008年如意集团按行业的收入结构
图: 2003-2008年兰生股份的营业额和利润走势
图: 2003-2008年兰生股份的总资产和货币资金走势
图: 2008年兰生股份按产品的收入结构
图: 2008年兰生股份按行业的收入结构
表: 2008年兰生股份主要出口商品(前5名)情况
表: 2008年1-12月兰生股份分地区经营情况
图: 2003-2008年中大股份的营业额和利润走势
图: 2003-2008年中大股份的总资产和货币资金走势
表: 2008年中大股份按产品的收入结构
图: 2008年中大股份按行业的收入结构
表: 2008年中大股份分地区经营情况
图: 2003-2008年中成股份的营业额和利润走势
图: 2003-2008年中成股份的总资产和货币资金走势
图: 2008年中成股份按行业的收入结构
表: 2008年中成股份分地区经营情况
图: 2003-2008年银泰股份的营业额和利润走势
图: 2003-2008年银泰股份的总资产和货币资金走势
图: 2008年银泰股份按行业的收入结构
表: 2008年银泰股份分地区经营情况
图: 2003-2008年银泰股份利润构成走势
图: 2003-2008年大连国际的营业额和利润走势
图: 2003-2008年大连国际的总资产和货币资金走势
图: 2008年大连国际按行业的收入结构
表: 2008年大连国际主营业务经营情况
表: 2008年大连国际主营业务分地区经营情况
Chinese Foreign Trade Scale, 2000-2008
Dependence Ratio on Foreign Trade and Export, 1980-2007
Chinese Import & Export Structure, Jan.-Nov.2008
Chinese Export Structure, Jan.-Nov.2008
Monthly Export to EU, America and Japan, Jan.2002-Nov.2008
Chinese Import and Export Scale, Feb.2007-Mar.2009
Chinese Monthly Import & Export Scale and Favorable Balance, Mar.2008-Mar.2009
The Growth Rate of Accumulated Export to Major Countries, 1Q2002-1Q2009
The Accumulated Growth Rate of Major Imported Products, Jul.2007-Mar.2009
Rank of Foreign Trade Companies by Asset in 2008
Rank of Foreign Trade Companies by Operating Revenue in 2008
Rank of Foreign Trade Companies by Profit in 2008
Rank of Foreign Trade Companies by Monetary Capital in 2008
Turnover and Profit of Hiking Group, 2003-2008
Total Assets and Monetary Capital of Hiking Group, 2003-2008
Revenue Structure by Product of Hiking Group, 2008
Regional Operation of Hiking Group, 2008
Turnover and Profit of Shanghai Shenda, 2003-2008
Total Assets and Monetary Capital of Shanghai Shenda, 2003-2008
Revenue Structure by Product of Shanghai Shenda, 2008
Regional Operation of Shanghai Shenda, 2008
Turnover and Profit of Liaoning Times Garments I/E INC ,2003-2008
Total Assets and Monetary Capital of Liaoning Times Garments I/E INC, 2003-2008
Revenue Structure by Product of Liaoning Times Garments I/E INC, 2007-2008
Regional Operation of , 2008
Hiking Group’s Profit Trend, 2003-2008
Turnover and Profit of Jiangsu Guotai International Group, 2003-2008
Total Assets and Monetary Capital of Jiangsu Guotai International Group, 2003-2008
Revenue Structure by Product of Jiangsu Guotai International Group, 2008
Business Structure of Jiangsu Guotai International Group’
Foreign Trade Revenue and Growth of Jiangsu Guotai International Group, 2003-2008
Gross Profit of Foreign Trade Business of Jiangsu Guotai International Group, 2003-2008
Turnover and Profit of Zhejiang Orient, 2003-2008
Total Assets and Monetary Capital of Zhejiang Orient, 2003-2008
Regional Operation of Zhejiang Orient, 2008
Turnover and Profit of Holly Corporation, 2003-2008
Total Assets and Monetary Capital of Holly Corporation, 2003-2008
Revenue Structure by Product of Holly Corporation ,2008
Turnover and Profit of SAINTY International Group, 2003-2008
SAINTY International Group’s Total Assets and Monetary Capital Trend, 2003-2008
Regional Operation of SAINTY International Group, 2008
Liaoning Chengda’s Turnover and Profit Trend, 2003-2008
Liaoning Chengda’s Total Assets and Monetary Capital , 2003-2008
Liaoning Chengda’s Revenue Structure by Product, 2007-2008
Regional Operation of Liaoning Chengda, 2008
Skyrun’s Turnover and Profit, 2003-2008
Skyrun’s Total Assets and Monetary Capital, 2003-2008
Skyrun’s Revenue Structure by Products, 2007-2008
Sinochem International Corporation’s Turnover and Profit , 2003-2008
Sinochem International Corporation’s Total Assets and Monetary Capital, 2003-2008
Sinochem International Corporation’s Revenue Structure by Product, 2008
Sinochem International Corporation’s Gross Profit by Sector, 2005-2008
Minmetals Development Co.’s Turnover and Profit, 2003-2008
Minmetals Development Co.’s Total Assets and Monetary Capital, 2003-2008
Minmetals Development Co.’s Revenue Structure by Product, 2008
Minmetals Development Co.’s Business Structure
Minmetals Development Co.’s Steel Trade
Shanghai Material Trading’s Turnover and Profit , 2003-2008
Shanghai Material Trading’s Total Assets and Monetary Capital, 2003-2008
Shanghai Material Trading’s Revenue Structure by Product, 2008
Region Operation of Shanghai Material Trading, 2008
Xiamen C&D Inc.’s Turnover and Profit, 2003-2008
Xiamen C&D Inc.’s Total Assets and Monetary Capital, 2003-2008
Xiamen C&D Inc.’s Business Structure, 1998-2007
Xiamen C&D Inc.” Net Profit, 1998-2007
Xiamen C&D Inc.’s Revenue Structure, 2008
Xiamen C&D Inc.’s Gross Profit Structure, 2008
Xiamen C&D Inc.’s Import & Export Scale, 1998-2008
Xiamen International Trade Group’s Turnover and Profit, 2003-2008
Xiamen International Trade Group’s Total Assets and Monetary Capital, 2003-2008
Regional Operation of Xiamen International Trade Group, 2008
Lianyungang Ideal Group’s Turnover and Profit, 2003-2008
Lianyungang Ideal Group’s Total Assets and Monetary Capital, 2003-2008
Shanghai Lansheng’s Turnover and Profit, 2003-2008
Shanghai Lansheng’s Total Assets and Monetary Capital, 2003-2008
Shanghai Lansheng’s Revenue Structure by Product, 2008
Shanghai Lansheng ‘s Top Five Export Products, 2008
Regional Operation of Shanghai Lansheng, 2008
Zhejiang Zhongda Group’s Turnover and Profit, 2003-2008
Zhejiang Zhongda Group’s Total Assets and Monetary Capital, 2003-2008
Zhejiang Zhongda Group’s Revenue Structure by Product, 2008
Regional Operation of Zhejiang Zhongda Group, 2008
China National Complete Plant Import & Export Co., Ltd’s Turnover and Profit, 2003-2008
China National Complete Plant Import & Export Co., Ltd’s Total Assets and Monetary Capital, 2003-2008
Regional Operation of China National Complete Plant Import & Export Co., Ltd, 2008
Silvertie’s Turnover and Profit, 2003-2008
Silvertie’s Total Assets and Monetary Capital, 2003-2008
Regional Operation of Silvertie, 2008
Dalian International Cooperation’s Turnover and Profit, 2003-2008
Dalian International Cooperation’s Total Assets and Monetary Capital, 2003-2008
Dalian International Cooperation’s Business Operation, 2008
Regional Operation of Dalian International Cooperation, 2008
如果这份报告不能满足您的要求,我们还可以为您定制报告,请 留言说明您的详细需求。
|