|
|
|
报告导航:研究报告—
制造业—能源矿产
|
|
2008年中国煤炭行业及主要公司研究报告 |
 |
字数:3.1万 |
页数:103 |
图表数:152 |
|
中文电子版:3000元 |
中文纸版:1500元 |
中文(电子+纸)版:3500元 |
|
英文电子版:1600美元 |
英文纸版:1500美元 |
英文(电子+纸)版:1900美元 |
|
编号:HJ004
|
发布日期:2009-05 |
附件:无 |
 |
|
|
煤炭一直是中国最主要的能源。2009 年,考虑到短期内钢铁、水泥等行业出现根本性反转的可能性较小,因此,2009 年上半年甚至全年煤炭行业都难以再现2008 年的红火景象。
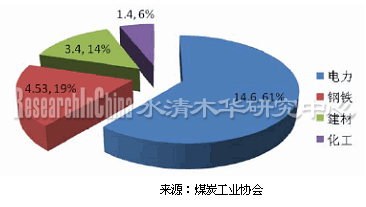
2008年,中国煤炭需求约26.7亿吨,其中电力耗煤占14.6亿吨、钢铁冶金4.53亿吨、建材3.4亿吨、化工1.4亿吨,四大行业合计占全国当年煤炭需求的86.89%。
图: 2008年四大行业煤炭需求量(亿吨)及占比
来源:煤炭工业协会
2008年,中国原煤产量为27.16亿吨,同比增长7.65%。其中乡镇煤矿生产原煤9.94亿吨,同比增长3.65%,占全国煤炭产量的36.6%,占比比2007年回落1.5个百分点。2008年,中国煤炭产量的增加主要在于国有重点煤矿(同比增长11%)和国有地方煤矿(同比增长6.4%)产量的增加。
本报告首先介绍了中国煤炭行业的发展概况,然后从需求、供给方面分析煤炭行业市场格局,最后详细分析了22家煤炭重点公司的运营和营收情况、项目投资情况、主营构成、最新动态和未来走势等。
下面是对煤气化(000968)的示例:
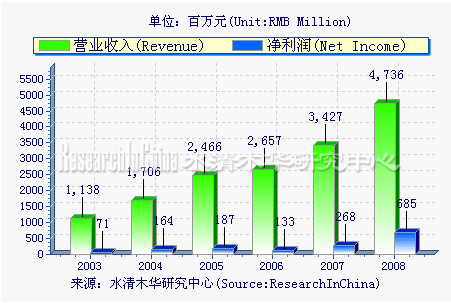
图: 2003-2008年煤气化的营业额和净利润走势图
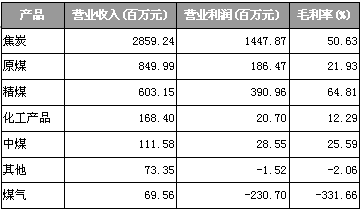
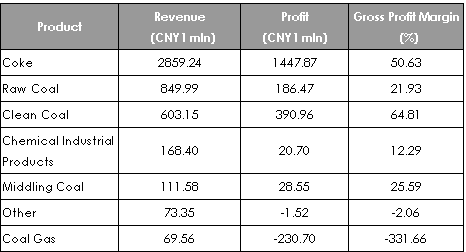
2008年煤气化(000968)按产品的收入构成

Coal has always been the principal energy in China. Considering the slim possibility that the industries like steel and cement show the fundamental reversion in a short period, so it is difficult for coal industry to perform in the first half and even the full year 2009 as the same prosperity in 2008.
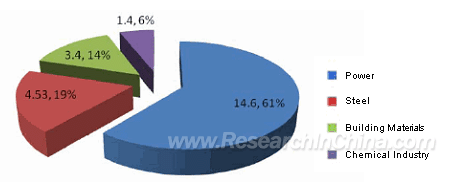
In 2008, the coal demand amounted to 2.67 billion tons in China, and 1.46 billion tons of which was consumed by electric power industry, 453 million tons in steel metallurgy, 340 million tons in building materials, and 140 million tons in chemical industry, accounting for 86.89% of China’s total coal demand.
Coal Demand Amount (100 mln tons) and Ratio of Four Key Industries, 2008
Source: China National Coal Association
China’s raw coal output was 2.716 billion tons in 2008, up 7.65% year-on-year, among which, the raw coal produced in county coal mines reached 994 million tons, rising 3.65% year-on-year, and accounting for 36.6% in the total, down 1.5 percentage points year-on-year. The growth in coal output in 2008 was mainly contributed to the output increase of state-owned key coal mines (up 11% year-on-year) and state-owned local coal mines (rising 6.4% year-on-year).
Firstly, the report introduces China’s coal industry development, and then it analyzes coal market layout from two aspects, demand and supply. Lastly, it gives a full picture of 22 key coal companies, including their operation and operating revenue, project investment, main business structure, latest trend and future trend.
Here, take Taiyuan Coal Gasification Co., Ltd for example
Revenue and Net Income of Taiyuan Coal Gasification Co., Ltd, 2003-2008
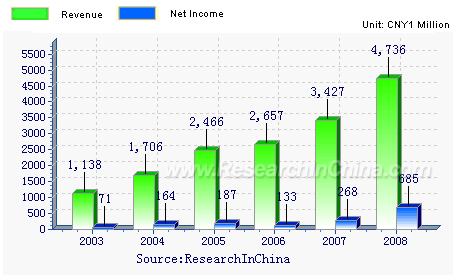
Source: ResearchInChina
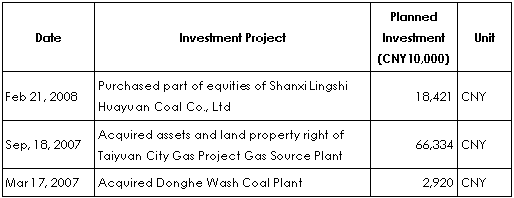
Recent Investments of Taiyuan Coal Gasification Co., Ltd
Revenue of Taiyuan Coal Gasification Co., Ltd by Product, 2008
1.2008年中国煤炭行业发展概述
1.1 中国煤炭行业发展概况
1.2 中国煤炭行业市场现状
1.2.1 煤炭下游行业需求分析
1.2.2 煤炭市场供给分析
2.靖远煤电(000552)
2.1 公司简介
2.2 运营和营收情况
2.3 投资情况
2.4 主营构成
2.5 最新市场动向和未来发展走势
3.ST平能(000780)
3.1 公司简介
3.2 运营和营收情况
3.3 投资情况
3.4 主营构成
3.5 最新市场动向和未来发展走势
4.神火股份(000933)
4.1 公司简介
4.2 运营和营收情况
4.3 投资情况
4.4 主营构成
4.5 最新市场动向和未来发展走势
5.金牛能源(000937)
5.1 公司简介
5.2 运营和营收情况
5.3 投资情况
5.4 主营构成
5.5 最新市场动向和未来发展走势
6.煤气化(000968)
6.1 公司简介
6.2 运营和营收情况
6.3 投资情况
6.4 主营构成
6.5 最新市场动向和未来发展走势
7.西山煤电(000983)
7.1 公司简介
7.2 运营和营收情况
7.3 投资情况
7.4 主营构成
7.5 最新市场动向和未来发展走势
8.露天煤业(002128)
8.1 公司简介
8.2 运营和营收情况
8.3 投资情况
8.4 主营构成
8.5 最新市场动向和未来发展走势
9.郑州煤电(600121)
9.1 公司简介
9.2 运营和营收情况
9.3 投资情况
9.4 主营构成
9.5 最新市场动向和未来发展走势
10.兰花科创(600123)
10.1 公司简介
10.2 运营和营收情况
10.3 投资情况
10.4 主营构成
10.5 最新市场动向和未来发展走势
11兖州煤业(600188)
11.1 公司简介
11.2 运营和营收情况
11.3 投资情况
11.4 主营构成
11.5 最新市场动向和未来发展走势
12.国阳新能(600348)
12.1 公司简介
12.2 运营和营收情况
12.3 投资情况
12.4 主营构成
12.5 最新市场动向和未来发展走势
13.盘江股份(600395)
13.1 公司简介
13.2 运营和营收情况
13.3 投资情况
13.4 主营构成
13.5 最新市场动向和未来发展走势
14.安源股份(600397)
14.1 公司简介
14.2 运营和营收情况
14.3 投资情况
14.4 主营构成
14.5 最新市场动向和未来发展走势
15.上海能源(600508)
15.1 公司简介
15.2 运营和营收情况
15.3 投资情况
15.4 主营构成
15.5 最新市场动向和未来发展走势
16.恒源煤电(600971)
16.1 公司简介
16.2 运营和营收情况
16.3 投资情况
16.4 主营构成
16.5 最新市场动向和未来发展走势
17.开滦股份(600997)
17.1 公司简介
17.2 运营和营收情况
17.3 投资情况
17.4 主营构成
17.5 最新市场动向和未来发展走势
18.大同煤业(601001)
18.1 公司简介
18.2 运营和营收情况
18.3 投资情况
18.4 主营构成
18.5 最新市场动向和未来发展走势
19.中国神华(601088)
19.1 公司简介
19.2 运营和营收情况
19.3 投资情况
19.4 主营构成
19.5 最新市场动向和未来发展走势
20.平煤股份(601666)
20.1 公司简介
20.2 运营和营收情况
20.3 投资情况
20.4 主营构成
20.5 最新市场动向和未来发展走势
21.潞安环能(601699)
21.1 公司简介
21.2 运营和营收情况
21.3 投资情况
21.4 主营构成
21.5 最新市场动向和未来发展走势
22.中煤能源(601898)
22.1 公司简介
22.2 运营和营收情况
22.3 投资情况
22.4 主营构成
22.5 最新市场动向和未来发展走势
23.国投新集(601918)
23.1 公司简介
23.2 运营和营收情况
23.3 投资情况
23.4 主营构成
23.5 最新市场动向和未来发展走势
1 China Coal Industry Development, 2008 1.1 Overview 1.2 Market 1.2.1 Demand of Downstream Industries 1.2.2 Market Supply
2 Gansu Jingyuan Coal Industry And Electricity Power Co., Ltd
2.1 Company Profile
2.2 Operation and Revenue
2.3 Investment
2.4 Main Business
2.5 Latest Market Trend and Future Development
3 Inner Mongolia PingZhuang Energy Resources Co., Ltd
3.1 Company Profile
3.2 Operation and Revenue
3.3 Investment
3.4 Main Business
3.5 Latest Market Trend and Future Development
4 Henan Shen Huo Coal Industry And Electricity Power Co., Ltd
4.1 Company Profile
4.2 Operation and Revenue
4.3 Investment
4.4 Main Business
4.5 Latest Market Trend and Future Development
5 Hebei Jinniu Energy Resources Co., Ltd
5.1 Company Profile
5.2 Operation and Revenue
5.3 Investment
5.4 Main Business
5.5 Latest Market Trend and Future Development
6 Taiyuan Coal Gasification Co., Ltd
6.1 Company Profile
6.2 Operation and Revenue
6.3 Investment
6.4 Main Business
6.5 Latest Market Trend and Future Development
7 Shanxi Xishan Coal And Electricity Power Co., Ltd
7.1 Company Profile
7.2 Operation and Revenue
7.3 Investment
7.4 Main Business
7.5 Latest Market Trend and Future Development
8 Huolinhe Opencut Coal Industry Corporation Limited of Inner Mongolia
8.1 Company Profile
8.2 Operation and Revenue
8.3 Investment
8.4 Main Business
8.5 Latest Market Trend and Future Development
9 Zhengzhou Coal Industry & Electric Power Co., Ltd
9.1 Company Profile
9.2 Operation and Revenue
9.3 Investment
9.4 Main Business
9.5 Latest Market Trend and Future Development
10 Shanxi Lanhua Sci-Tech Venture Co., Ltd
10.1 Company Profile
10.2 Operation and Revenue
10.3 Investment
10.4 Main Business
10.5 Latest Market Trend and Future Development
11 Yanzhou Coal Mining Co., Ltd
11.1 Company Profile
11.2 Operation and Revenue
11.3 Investment
11.4 Main Business
11.5 Latest Market Trend and Future Development
12 Shanxi Guoyang New Energy Co., Ltd
12.1 Company Profile
12.2 Operation and Revenue
12.3 Investment
12.4 Main Business
12.5 Latest Market Trend and Future Development
13 Guizhou Panjiang Refined Coal Co., Ltd
13.1 Company Profile
13.2 Operation and Revenue
13.3 Investment
13.4 Main Business
13.5 Latest Market Trend and Future Development
14 Anyuan Industrial Co., Ltd
14.1 Company Profile
14.2 Operation and Revenue
14.3 Investment
14.4 Main Business
14.5 Latest Market Trend and Future Development
15 Shanghai Datun Energy Resources Co., Ltd
15.1 Company Profile
15.2 Operation and Revenue
15.3 Investment
15.4 Main Business
15.5 Latest Market Trend and Future Development
16 Anhui Hengyuan Coal Industry And Electricity Power Co., Ltd
16.1 Company Profile
16.2 Operation and Revenue
16.3 Investment
16.4 Main Business
16.5 Latest Market Trend and Future Development
17 Kailuan Energy Chemical Co., Ltd
17.1 Company Profile
17.2 Operation and Revenue
17.3 Investment
17.4 Main Business
17.5 Latest Market Trend and Future Development
18 Datong Coal Industry Co., Ltd
18.1 Company Profile
18.2 Operation and Revenue
18.3 Investment
18.4 Main Business
18.5 Latest Market Trend and Future Development
19 China Shenhua Energy Co., Ltd
19.1 Company Profile
19.2 Operation and Revenue
19.3 Investment
19.4 Main Business
19.5 Latest Market Trend and Future Development
20 Pingdingshan Tianan Coal Mining Co., Ltd
20.1 Company Profile
20.2 Operation and Revenue
20.3 Investment
20.4 Main Business
20.5 Latest Market Trend and Future Development
21 Shanxi Lu'an Environmental Energy Development Co., Ltd
21.1 Company Profile
21.2 Operation and Revenue
21.3 Investment
21.4 Main Business
21.5 Latest Market Trend and Future Development
22 China Coal Energy Co., Ltd
22.1 Company Profile
22.2 Operation and Revenue
22.3 Investment
22.4 Main Business
22.5 Latest Market Trend and Future Development
23 SDIC Xinji Energy Co., Ltd
23.1 Company Profile
23.2 Operation and Revenue
23.3 Investment
23.4 Main Business
23.5 Latest Market Trend and Future Development
图: 中国煤炭资源分布图
图: 2008.1至2009.2中国火电月度发电量
表: 2007-2009年中国国家电网调度中心日均发电量
图: 2006-2009年中国生铁及粗钢产量及同比
图: 2008.1-2009.2钢铁月度产量
图: 2008.1-2009.2水泥月度产量
图: 2005-2009中国水泥产量及增速
图: 2005-2009年中国合成氨及精甲醇产量、同比
图: 2008年四大行业煤炭需求量(亿吨)及占比
图: 2007-2009.2中国煤炭产量同比增速
图: 2005-2009年中国煤炭累计产量及同比
图: 2003-2009年中国煤炭进口量与国内产量对比
图: 2004-2009年中国煤炭进出口走势
图: 2003-2009年中国全社会煤炭库存及各环节占比
图: 2003-2008年中国各类煤炭库存变化情况
图: 2006-2009.3秦皇岛月末库存走势
图: 2003-2008年靖远煤电的营业额和净利润走势图
图: 2003-2008年靖远煤电的总资产和货币资金走势图
表: 2008年靖远煤电按产品的收入结构
图: 2003-2008年ST平能的营业额和净利润走势图
图: 2003-2008年ST平能的总资产和货币资金走势图
图: 2008年ST平能按产品的收入构成
表: ST平能2008年生产能力情况
表: ST平能2008年主要指标变化情况
图: ST平能煤炭销售覆盖区域
图: 2003-2008年神火股份的营业额和净利润走势图
图: 2003-2008年神火股份的总资产和货币资金走势图
图: 2008年神火股份按产品的收入结构
表: 2007-2010年神火股份煤炭生产情况
表: 2007-2010年神火股份盈利数据
表: 神火股份煤炭资源及生产状态
图: 2003-2010年神火股份历年煤炭产销量对比
图: 2003-2010年神火股份各品种收入占比
图: 2003-2008年金牛能源的营业额和净利润走势图
图: 2003-2008年金牛能源的总资产和货币资金走势图
图: 2008年金牛能源按产品的收入结构
表: 2004-2008年金牛能源按行业收入结构
表: 金牛能源煤矿、资源、产能情况
表: 2004-2008年金牛能源盈利情况
表: 2002-2008年金牛能源煤炭业务情况
表: 2007-2010年金牛能源产量及预测
图: 2003-2008年煤气化的营业额和净利润走势图
图: 2003-2008年煤气化的总资产和货币资金走势图
图: 2008年煤气化按产品的收入构成
图: 2003-2007年煤气化各业务收入占比及毛利率变化情况
图: 2008年煤气化E焦精煤自供与外购成本分析图
图: 2007-2010年煤气化公司炼焦的煤种结构和价格
表: 煤气化煤炭存量资产
图: 2003-2008年西山煤电的营业额和净利润走势图
图: 2003-2008年西山煤电的总资产和货币资金走势图
图: 2008年西山煤电按不同产品的收入结构
图: 山西、山西焦煤集团、西山煤电焦煤占比
图: 2005至2008年西山煤电的收入结构变化和毛利率变化
表: 西山煤电各矿储量和产能
图: 2004-2008年露天煤业的营业额和净利润走势图
图: 2004-2008年露天煤业的总资产和货币资金走势图
表: 露天煤业2008年按产品的收入构成
表: 2004至2008年露天煤业盈利情况
表: 露天煤业2008年各季度财务指标
图: 2003-2008年郑州煤电的营业额和净利润走势图
图: 2003-2008年郑州煤电的总资产和货币资金走势图
图: 郑州煤电2008年按产品的收入结构
图: 2003-2008年兰花科创的营业额和净利润走势图
图: 2003-2008年兰花科创的总资产和货币资金走势图
表: 2008年兰花科创按行业的收入结构
图: 2004-2008Q2兰花科创煤炭和化肥业务收入占比
表: 兰花科创本部四矿产能情况
图: 2006至2008年兰花科创的销售毛利率
表: 兰花科创的煤矿、资源、产能
表: 兰花科创的煤炭价格、成本、毛利率
表: 2002-2008年兰花科创的煤炭、尿素产销量
表: 兰花科创2008年收购的地方小煤矿
图: 2003-2008年兖州煤业的营业额和净利润走势图
图: 2003-2008年兖州煤业的总资产和货币资金走势图
表: 2008年兖州煤业按行业的收入构成
表: 2007-2008Q3兖州煤业产品价格情况
图: 兖州煤业2009年煤炭经销商占比
图: 2003-2008年国阳新能的营业额和净利润走势图
图: 2003-2008年国阳新能的总资产和货币资金走势图
图: 2008年国阳新能按产品的收入构成
表: 2005-2008年国阳新能分煤种销量
表: 国阳新能煤炭资产概况
表: 2004-2009年国阳新能煤炭产品售价概况
图: 2003-2008年盘江股份的营业额和净利润走势图
图: 2003-2008年盘江股份的总资产和货币资金走势图
图: 2008年盘江股份按产品的收入构成
图: 2003-2008年安源股份的营业额和净利润走势图
图: 2003-2008年安源股份的总资产和货币资金走势图
图: 2008年安源股份按产品的收入构成
图: 2006-2008Q2安源股份按收入占比情况
图: 2006-2008年安元股份分产品收入及毛利率情况
图: 2003-2008年上海能源的营业额和净利润走势图
图: 2003-2008年上海能源的总资产和货币资金走势图
图: 2008年上海能源按产品的收入构成
表: 2007-1010年上海能源盈利数据
图: 2003-2008年恒源煤电的营业额和净利润走势图
图: 2003-2008年恒源煤电的总资产和货币资金走势图
图: 2008年恒源煤电按产品的收入构成
表: 2004-2008年恒源煤电分行业收入和利润情况
表: 2004至2008年恒源煤电盈利情况
表: 2002-2008年恒源煤电煤炭业务概况
表: 恒源煤电的煤矿产能、产量
图: 2003-2008年开滦股份的营业额和净利润走势图
图: 2003-2008年开滦股份的总资产和货币资金走势图
图: 2008年开滦股份按产品的收入构成
图: 2005至2008年开滦股份营业收入和净利润
表: 2004至2008年开滦股份盈利情况
表: 2006-2008年开滦股份不同产品的毛利率
图: 2003-2008年开滦股份煤焦产量和价格
表: 2005-2008年开滦股份煤炭、焦炭业务产量、单位价格、单位成本情况
图: 2003-2008年大同煤业的营业额和净利润走势图
图: 2003-2008年大同煤业的总资产和货币资金走势图
图: 2008年大同煤业按产品的收入构成
图: 2006Q3至2008Q3大同煤业单季销售毛利率
表: 大同煤业煤炭资产概况
表: 大同煤业原有四个煤矿质量指标
表: 大同煤业原有四个煤矿的资源情况
图: 2003至2008年大同煤业煤炭产量和销量变化
图: 2006-2008年中国神华的营业额和净利润走势图
图: 2006-2008年中国神华的总资产和货币资金走势图
图: 2008年中国神华按行业的收入构成
图: 中国神华2008年按产品收入构成
图: 中国神华的资产分布情况
表: 2002-2008年中国神华各煤矿产量
表: 中国神华煤炭资源储量(截至2008年12月31日)
图: 2008年中国神华各矿产区产量分布
图: 2008年中国神华商品煤产量结构
图: 2003-2008年平煤股份的营业额和净利润走势图
图: 2003-2008年平煤股份的总资产和货币资金走势图
图: 2008平煤股份按产品的收入构成
表: 平煤股份煤矿、储量及产能
表: 2003-2008.6平煤股份煤炭产销量、价格及成本
图: 2003-2008年潞安环能的营业额和净利润走势图
图: 2003-2008年潞安环能的总资产和货币资金走势图
图: 2008年潞安环能按产品的收入构成
表: 2006-2008年潞安环能不同产品的毛利率
表: 2005至2008年潞安环能的煤炭产销量
图: 2004-2008年中煤能源的营业额和净利润走势图
图: 2006-2008年中煤能源的总资产和货币资金走势图
图: 2008年中煤能源按产品的收入构成
表: 2004至2008年中煤能源的收入、利润及毛利率
表: 2007-2008年中煤能源煤炭业务运营指标
表: 中煤能源煤矿、资源、产能
表: 中煤能源炼焦煤的产量及销售价格
图: 2004-2008年国投新集的营业额和净利润走势图
图: 2004-2008年国投新集的总资产和货币资金走势图
表: 2008年国投新集按产品的收入构成
表: 2004至2008年国投新集分产品收入、成本、利润情况
表: 国投新集煤炭资源和生产状况
表: 2004-2008年国投新集煤炭产销量、价格、成本、吨煤净利
图: 2007-2010年国投新集煤炭销售量变化
图: 2004-2010年国投新集煤炭产量及同比增速
表: 国投新集下属煤矿情况
表: 国投新集在建矿井情况
Coal Resource Distribution in China
China’s Monthly Thermal Power Generation Volume, Jan, 2008-Feb, 2009
Daily Generation Volume of State Grid Dispatch Center, 2007-2009
China’s Pig Iron and Crude Steel Output and Y-o-Y Growth, 2006-2009
Monthly Steel Output, Jan, 2008-Feb, 2009
Monthly Cement Output, Jan, 2008-Feb, 2009
China’s Cement Output and Growth Margin, 2005-2009
China’s Synthetic Ammonia and Refined Methanol Output and Y-o-Y Growth, 2005-2009
Coal Demand Amount (100 mln tons) and Ratio of Four Key Industries, 2008
China’s Coal Output and Y-o-Y Growth Margin, 2007-Feb, 2009
China’s Accumulative Coal Output and Y-o-Y Growth Margin, 2005- 2009
Comparison of China’s Coal Import and Domestic Output, 2003-2009
China’s Coal Import & Export Trend, 2004-2009
China’s Social Coal Stock and Ratio by Link, 2003-2009
China’s Coal Stock Change by Type, 2003-2008
Qinhuangdao Monthly Stock Trend, 2006-Mar, 2009
Jingyuan Coal Industry and Electricity Power Turnover and Net Income, 2003-2008
Jingyuan Coal Industry and Electricity Power Total Assets and Currency Fund, 2003-2008
Jingyuan Coal Industry and Electricity Power Revenue Structure by Product, 2008
PingZhuang Energy Resources Turnover and Net Income, 2003-2008
PingZhuang Energy Resources Total Assets and Currency Fund, 2003-2008
PingZhuang Energy Resources Revenue Structure by Product, 2008
PingZhuang Energy Resources Output Capability, 2008
PingZhuang Energy Resources Main Indices Change, 2008
PingZhuang Energy Resources Coal Sales Regions
Shen Huo Coal Industry and Electricity Power Turnover and Net Income, 2003-2008
Shen Huo Coal Industry and Electricity Power Total Assets and Currency Fund, 2003-2008
Shen Huo Coal Industry and Electricity Power Revenue Structure by Product, 2008
Shen Huo Coal Industry and Electricity Power Coal Production, 2007-2010
Shen Huo Coal Industry and Electricity Power Profit, 2007-2010
Shen Huo Coal Industry and Electricity Power Coal Resource and Production
Shen Huo Coal Industry and Electricity Power Coal Output and Sales, 2003-2010
Shen Huo Coal Industry and Electricity Power Revenue Ratio by Product, 2003-2010
Jinniu Energy Resources Turnover and Net Income, 2003-2008
Jinniu Energy Resources Total Assets and Currency Fund, 2003-2008
Jinniu Energy Resources Revenue Structure by Product, 2008
Jinniu Energy Resources Revenue Structure by Industry, 2004-2008
Jinniu Energy Resources Coal Mine, Resource and Output Capacity
Jinniu Energy Resources Profit, 2004-2008
Jinniu Energy Resources Coal Business, 2002-2008
Jinniu Energy Resources Output and Forecast, 2007-2010
Coal Gasification Turnover and Net Income, 2003-2008
Coal Gasification Total Assets and Currency Fund, 2003-2008
Coal Gasification Revenue Structure by Product, 2008
Coal Gasification Revenue and Gross Profit Margin by Division, 2003-2007
Coal Gasification E Refine Coking Coal Self-sufficiency and Purchase Cost, 2008
Coal Gasification Coal Stock Assets
Xishan Coal and Electricity Power Turnover and Net Income, 2003-2008
Xishan Coal and Electricity Power Total Assets and Currency Fund, 2003-2008
Xishan Coal and Electricity Power Revenue Structure by Product, 2008
Xishan Coal and Electricity Power Revenue Structure and Gross Profit Margin Change, 2005-2008
Xishan Coal and Electricity Power Reserves and Output Capacity by Mine
Opencut Coal Industry Turnover and Net Income, 2003-2008
Opencut Coal Industry Total Assets and Currency Fund, 2003-2008
Opencut Coal Industry Revenue Structure by Product, 2008
Opencut Coal Industry Profit, 2004-2008
Opencut Coal Industry Financial Indices by Quarter, 2008
Zhengzhou Coal Industry & Electric Power Turnover and Net Income, 2003-2008
Zhengzhou Coal Industry & Electric Power Total Assets and Currency Fund, 2003-2008
Zhengzhou Coal Industry & Electric Power Revenue Structure by Product, 2008
Lanhua Sci-Tech Venture Turnover and Net Income, 2004-2008
Lanhua Sci-Tech Venture Total Assets and Currency Fund, 2004-2008
Lanhua Sci-Tech Venture Revenue Structure by Product, 2008
Lanhua Sci-Tech Venture Coal and Fertilizer Revenue Ratios, 2004-2008Q2
Lanhua Sci-Tech Venture Sales Gross Profit Margin, 2006-2008
Lanhua Sci-Tech Venture Coal Mine, Resource & Output Capacity
Lanhua Sci-Tech Venture Coal Price, Cost and Gross Profit Margin
Lanhua Sci-Tech Venture Coal and Urea Output and Sales, 2002-2008
Small Local Coal Mines Acquired by Lanhua Sci-Tech Venture, 2008
Yanzhou Coal Mining Turnover and Net Income, 2003-2008
Yanzhou Coal Mining Total Assets and Currency Fund, 2003-2008
Yanzhou Coal Mining Revenue by Industry, 2008
Yanzhou Coal Mining Product Price, 2007-2008Q3
Yanzhou Coal Mining Coal Distributors Ratio, 2009
Guoyang New Energy Turnover and Net Income, 2003-2008
Guoyang New Energy Total Assets and Currency Fund, 2003-2008
Guoyang New Energy Revenue Structure by Product, 2008
Guoyang New Energy Sales by Coal Type, 2005-2008
Guoyang New Energy Coal Assets Overview
Guoyang New Energy Coal Product Sales Price, 2004-2009
Panjiang Refined Coal Turnover and Net Income, 2003-2008
Panjiang Refined Coal Total Assets and Currency Fund, 2003-2008
Panjiang Refined Coal Revenue Structure by Product, 2008
Anyuan Industrial Turnover and Net Income, 2003-2008
Anyuan Industrial Total Assets and Currency Fund, 2003-2008
Anyuan Industrial Revenue Structure by Product, 2008
Anyuan Industrial Ratio by Revenue, 2006-2008Q2
Anyuan Industrial Revenue and Gross Profit Margin by Product, 2006-2008
Shanghai Datun Energy Resources Turnover and Net Income, 2003-2008
Shanghai Datun Energy Resources Total Assets and Currency Fund, 2003-2008
Shanghai Datun Energy Resources Revenue Structure by Product, 2008
Shanghai Datun Energy Resources Profitability Statistics, 2007-2010
Anhui Hengyuan Coal Industry and Electricity Power Turnover and Net Income, 2003-2008
Anhui Hengyuan Coal Industry and Electricity Power Total Assets and Currency Fund, 2003-2008
Anhui Hengyuan Coal Industry and Electricity Power Revenue Structure by Product, 2008
Anhui Hengyuan Coal Industry and Electricity Power Revenue and Net Income by Industry, 2004-2008
Anhui Hengyuan Coal Industry and Electricity Power Profitability, 2004-2008
Anhui Hengyuan Coal Industry and Electricity Power Coal Business, 2002-2008
Anhui Hengyuan Coal Industry and Electricity Power Coal Output Capacity and Output
Kailuan Energy Chemical Turnover and Net Income, 2003-2008
Kailuan Energy Chemical Total Assets and Currency Fund, 2003-2008
Kailuan Energy Chemical Revenue Structure by Product, 2008
Kailuan Energy Chemical Revenue and Net Income, 2005-2008
Kailuan Energy Chemical Profit, 2004-2008
Kailuan Energy Chemical Gross Profit Margin by Product. 2006-2008
Kailuan Energy Chemical Coal & Coking Output and Price, 2003-2008
Kailuan Energy Chemical Coal & Coking Output, Unit Price and Unit Cost, 2005-2008
Datong Coal Industry Turnover and Net Income, 2003-2008
Datong Coal Industry Total Assets and Currency Fund, 2003-2008
Datong Coal Industry Revenue Structure by Product, 2008
Datong Coal Industry Quarterly Sales Gross Profit Margin, 2006Q3-2008Q3
Datong Coal Industry Coal Assets Overview
Datong Coal Industry Former Four Coal Mines Quality Indices
Datong Coal Industry Former Four Coal Resource Overview
Datong Coal Industry Coal Output and Sales Change, 2003-2008
China Shenhua Energy Turnover and Net Income, 2006-2008
China Shenhua Energy Total Assets and Currency Fund, 2006-2008
China Shenhua Energy Revenue Structure by Product, 2008
China Shenhua Energy Revenue by Product, 2008
China Shenhua Energy Assets Distribution
China Shenhua Energy Output by Coal Mine, 2002-2008
China Shenhua Energy Coal Resource Reserves (up to Dec 31, 2008)
China Shenhua Energy Output Distribution by Mine Region, 2008
China Shenhua Energy Commercial Coal Output Structure, 2008
Pingdingshan Tianan Coal Mining Turnover and Net Income, 2003-2008
Pingdingshan Tianan Coal Mining Total Assets and Currency Fund, 2003-2008
Pingdingshan Tianan Coal Mining Revenue Structure by Product, 2008
Pingdingshan Tianan Coal Mining Coal Mine, Reserves and Output Capacity
Pingdingshan Tianan Coal Mining Coal Output, Sales, Price and Cost, 2003-Jun, 2008
Shanxi Lu'an Environmental Energy Development Mining Turnover and Net Income, 2003-2008
Shanxi Lu'an Environmental Energy Development Mining Total Assets and Currency Fund, 2003-2008
Shanxi Lu'an Environmental Energy Development Mining Revenue Structure by Product, 2008
Shanxi Lu'an Environmental Energy Development Gross Profit Margin by Product, 2006-2008
Shanxi Lu'an Environmental Energy Development Coal Output and Sales, 2005-2008
China Coal Energy Turnover and Net Income, 2004-2008
China Coal Energy Total Assets and Currency Fund, 2006-2008
China Coal Energy Revenue Structure by Product, 2008
China Coal Energy Revenue, Profit and Gross Profit Margin, 2004-2008
China Coal Energy Coal Business Operation Indices, 2007-2008
China Coal Energy Coal Mine, Resource and Output Capacity
China Coal Energy Coal Coking Output and Sales Price
SDIC Xinji Energy Turnover and Net Income, 2004-2008
SDIC Xinji Energy Total Assets and Currency Fund, 2004-2008
SDIC Xinji Energy Revenue Structure by Product, 2008
SDIC Xinji Energy Revenue, Cost and Profit by Product. 2004-2008
SDIC Xinji Energy Coal Resource and Production
SDIC Xinji Energy Coal Output & Sales, Price, Cost and Net Income Per Ton, 2004-2008
SDIC Xinji Energy Coal Sales Change, 2007-2010
SDIC Xinji Energy Coal Output and Y-o-Y Growth Margin, 2004-2010
SDIC Xinji Energy Coal Mines
SDIC Xinji Energy Mines under the Construction
如果这份报告不能满足您的要求,我们还可以为您定制报告,请 留言说明您的详细需求。
|