|
|
|
报告导航:研究报告—
制造业—能源矿产
|
|
2008-2009年中国清洁能源行业研究报告 |
 |
字数:6.5万 |
页数:167 |
图表数:125 |
|
中文电子版:8500元 |
中文纸版:4250元 |
中文(电子+纸)版:9000元 |
|
英文电子版:2500美元 |
英文纸版:2300美元 |
英文(电子+纸)版:2800美元 |
|
编号:ZN003
|
发布日期:2009-06 |
附件:无 |
 |
|
|
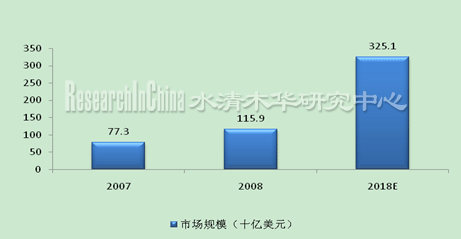
基于多方面的因素,2008年全球清洁能源市场规模迅速增长。根据CLEAN EDGE统计,2008年全球清洁能源的市场规模达到1159亿美元,较2007年增长50%。
图:2008年全球清洁能源市场规模

来源:CLEAN EDGE
全球清洁能源市场主要集中在风电、核电和太阳能三个领域。下面来看看中国清洁能源的未来发展展望:
2008年中国累计风电装机容量为12153MW,较2007年增长106%。《可再生能源十一五规划》2010年风电装机目标1000万千瓦,,已经于2008年实现。《中长期规划》2020年累计装机3000万千瓦的目标也极有可能提前至2010年实现。
从国务院批准的《核电中长期发展规划(2005-2020 年)》可以看出国家对核电发展的战略由“适度发展”到“积极发展”。按照规划,到2020 年,核电占全部电力装机容量的比重从现在的不到2%提高到4%,核电年发电量达到2600 -2800 亿千瓦时;2005 年-2010年,中国核电装机容量年复合增长率达到11.9%;2010 年-2020 年,装机容量年复合增长率达到12.8%。
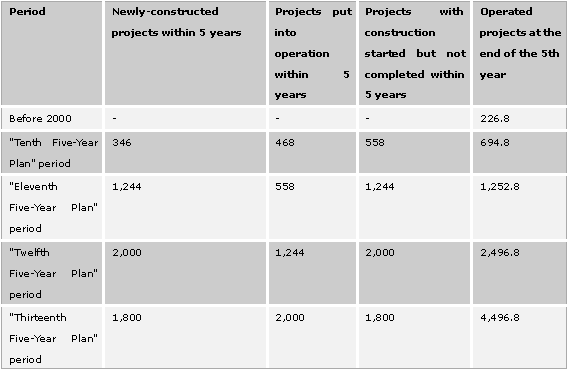
表:核电项目建设构想 单位:万千瓦

来源:核电中长期发展规划(2005~2020年)
根据“十一五”规划和2020年发展规划,到2010年,中国常规水电装机容量将达1.8亿千瓦,抽水蓄能电站装机容量将达1800万千瓦,水电开发程度将达33%;到2020年,常规水电装机容量将达3亿千瓦,抽水蓄能电站装机容量将达5000万千瓦,水电开发程度达55%。
预计2020年,中国太阳能发电将会达到180万千瓦,建成太阳能热水器面积3亿平方米。随着中国太阳能技术不断进步,太阳能成本的逐渐下降,预计2020年太阳能发电将会取得常规能源平等竞争的价格。
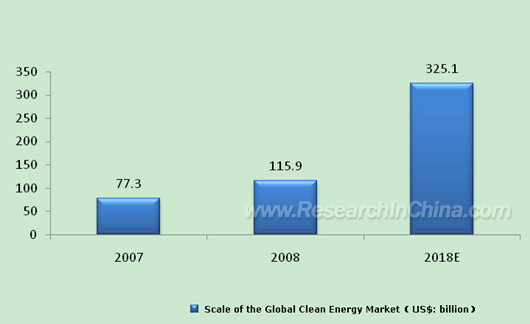
Owing to various factors, the scale of the global clean energy market expanded rapidly in 2008. According to the statistics of CLEAN EDGE, the global clean energy market scale amounted to US$ 115.9 billion in 2008, up 50% year on year.
Global Clean Energy Market Scale, 2008

Source: CLEAN EDGE
Global clean energy market mainly focuses on three fields --- wind power, nuclear power and solar energy. The followings are the future development prospect of clean energy in China.
In 2008, the accumulated installed capacity of wind power was 12,153MW in China, increasing 106% year on year. The goal that the accumulated installed capacity of wind power will reach 10 million kilowatts in 2010 stipulated by the Eleventh Five-Year Plan for Renewable Energy was fulfilled in 2008 in advance. The goal that the installed capacity of wind power will amount to 30 million kilowatts in 2020 stipulated by Medium and Long-term Plan is very likely to be achieved in 2010 in advance.
According to Medium and Long-term Plan for Nuclear Power (2005-2020) approved by the State Council, the development strategies of nuclear power have changed from "appropriate development" to "positive development". In accordance with the plan, by 2020, the installed capacity of nuclear power will account for 4% of the total installed capacity of power, while the current percentage is less than 2%; the annual nuclear power generation will be 260 - 280 billion KWh; during 2005-2010, the CAGR of the installed capacity of nuclear power will be 11.9%;, and the figure will reach12.8% from 2010 to 2020.
Nuclear Power Project Plan (Unit: 10,000 KW)

Source: Medium and Long-term Plan for Nuclear Power (2005-2020)
According to "Eleventh Five-Year Plan" and Plan of 2020, by 2010, China's installed capacity of conventional hydropower will be 180 million kilowatts, the installed capacity of pumped storage power stations will be 18 million kilowatts, the exploitation of hydropower will be 33%; by 2020, the conventional hydropower installed capacity will be 300 million kilowatts, the installed capacity of pumped storage power stations will be 50 million kilowatts, the exploitation of hydropower will be 55%.
It is expected that China’s solar power generation will be 1.8 million kilowatts, and the area of solar water heaters will be 300 million square meters in 2020. With continuous progress of solar technology and the cost reduction of solar power, the price of solar power generation will decline to a level that can compete with that of conventional energy by 2020.
第一章 全球清洁能源发展概况
1.1 全球清洁能源发展概况
1.2 全球清洁能源细分市场
1.3 全球清洁能源发展趋势
第二章 中国清洁能源发展概况
2.1 中国清洁能源行业政策
2.2 中国清洁能源发展前景
2.2.1 风能
2.2.2 核能
2.2.3 水电
2.2.4 太阳能
2.3 中国清洁能源存在的问题
第三章 中国水电行业概况
3.1 中国水电行业介绍
3.1.1 水电行业概况
3.1.2 中国水电主要特点
3.1.3 中国水电主要问题
3.1.4 中国水电发展趋势
3.2 中国水电成本分析
3.3 主要省份水电分析
3.3.1 湖北
3.3.2 福建
3.3.3 四川
3.3.4 云南
3.4 中国小水电行业分析
3.4.1 小水电行业现状分析
3.4.2 小水电资源开发情况
3.4.3 小水电资源的特点
3.4.4 中国小水电站概况
3.4.5 小水电联网情况
第四章 中国核电行业概况
4.1 全球核电发展状况
4.1.1 核电机组数量
4.1.2 核电装机容量
4.1.3 美国
4.1.4 加拿大
4.1.5 英国
4.1.6 俄罗斯
4.1.7 法国
4.1.8 德国
4.1.9 日本
4.1.10 韩国
5.1.11 印度
4.2 核电成本分析
4.3 中国核电发展环境分析
4.3.1 能源制约
4.3.2 政策环境
4.4 中国核电站建设情况
4.4.1 已建核电机组
4.4.2 在建和已规划核电机组
4.4.3 拟建核电机组
4.5 核电运营分析
4.5.1 核电机组数量
4.5.2 核电装机情况
4.5.3 核电发电情况
4.5.4 核电运行事件情况
4.5.5 核电价格情况
4.6 核电行业重点公司
4.6.1 中国核工业集团公司
4.6.2 广东核电集团有限公司
4.6.3 哈尔滨动力设备公司
4.6.4 广东核电合营有限公司
第五章 中国太阳能行业概况
5.1 全球太阳能发展情况
5.1.1 德国
5.1.2 日本
5.1.3 美国
5.1.4 西班牙
5.1.5 意大利
5.2 中国太阳能资源开发概况
5.2.1 中国太阳能技术的应用
5.2.2 中国太阳能开发利用的优势
5.3 中国太阳能行业政策
5.4 中国太阳能产业未来发展趋势
5.5 太阳能电池市场
5.5.1 太阳能电池市场综述
5.5.2 太阳能电池组件市场综述
5.5.3 太阳能电池系统市场综述
5.5.4 Q-CELL
5.5.5 三洋
5.5.6 三菱电机
5.5.7 RWE SCHOTT SOLAR
5.5.8 BP SOLAR
5.5.9 无锡尚德
5.5.10 台湾茂迪
5.5.11 SHELL SOLAR
第六章 中国风电行业概况
6.1 全球风能发展概况
6.1.1 发展概况
6.1.2 德国
6.1.3 西班牙
6.1.4 美国
6.2 全球海上风电发展概况
6.3 中国风能发展概况
6.3.1 中国风力资源分布
6.3.2 中国风力资源特点
6.3.3 中国海上风电发展
6.4 中国风能行业政策
6.5 中国风电装机容量发展情况
6.6 中国风能风电场发展概况
6.7 中国风能上网电价情况
6.8 中国风电成本分析
6.8.1 风电机组成本结构
6.8.2 风电场前期投资成本
6.8.3 风电场后期运营成本
6.9 中国风电区域分析
6.9.1 内蒙古
6.9.2 甘肃
6.9.3 河北
6.9.4 吉林
6.9.5 新疆
6.9.6 辽宁
6.9.7 黑龙江
6.9.8 山东
6.9.9 宁夏
6.10 中国风电装机行业概述
6.10.1 风电装机市场简介
6.10.2 风电装机市场竞争格局
6.11 中国内资风电整机制造厂商
6.11.1 新疆金风科技股份有限公司
6.11.2 华锐风电科技有限公司
6.11.3 东方电气股份有限公司
6.11.4 华仪电气股份有限公司
6.12 中国外资风电整机制造厂商
6.12.1 Vestas
6.12.2 Gamesa
6.12.3 GE Wind Energy
6.13 风电设备零部件制造行业
6.14 风电叶片
6.14.1 风电叶片简介
6.14.2 风电叶片行业需求状况
6.14.3 风电叶片行业生产状况
6.14.4 中国风电叶片行业未来发展趋势
6.14.5 中材科技风电叶片股份有限公司
6.14.6 天津鑫茂科技股份有限公司
6.14.7 中航(保定)惠腾风电设备有限公司
6.15 齿轮
6.15.1 中国风电齿轮市场概况
6.15.2 中国高速传动设备集团有限公司
6.15.3 重庆齿轮箱有限责任公司
6.15.4 杭州前进风电齿轮箱有限公司
6.16 发电机
6.16.1 中国风电发电机市场概况
6.16.2 湘潭电机股份有限公司
6.16.3 株洲南车电机股份有限公司
6.16.4 永济电机公司
6.17 轴承
6.17.1 中国风电轴承市场概况
6.17.2 瑞典SKF
6.17.3 舍弗勒集团
6.17.4 洛阳LYC轴承有限公司
6.17.5 浙江天马轴承股份有限公司
6.17.6 瓦房店轴承集团
6.17.7 其他公司
6.18 变频器
6.18.1 中国风电变频器市场概况
6.18.2 ABB
6.18.3 北京清能华福风电技术有限公司
6.18.4 Vacon
6.18.5 北京科诺伟业科技有限公司
6.18.6 合肥阳光电源有限公司
6.18.7 哈九洲
6.19 中国主要省区风电设备产业介绍
6.19.1 天津
6.19.2 新疆
6.19.3 江苏
6.19.4 辽宁
6.19.5 河北
6.19.6 湖南
6.20 中国风电设备行业投资风险分析
6.20.1 中国风电机组发展趋势
6.20.2 中国风电零部件发展趋势
1. Global Clean Energy Development
1.1 Overview
1.2 Market Segmentation
1.3 Development Trends
2. China Clean Energy Development
2.1 Industry Policies
2.2 Prospect
2.2.1 Wind Power
2.2.2 Nuclear Power
2.2.3 Hydropower
2.2.4 Solar Power
2.3 Problems
3. China Hydropower Industry Overview
3.1 Introduction
3.1.1 Overview
3.1.2 Main Characteristics
3.1.3 Major Problems
3.1.4 Development Trends
3.2 Cost
3.3 Hydropower Development in Major Provinces
3.3.1 Hubei
3.3.2 Fujian
3.3.3 Sichuan
3.3.4 Yunnan
3.4 Small Hydropower
3.4.1 Status Quo
3.4.2 Exploitation of Resources
3.4.3 Characteristics
3.4.4 Small Hydropower Stations
3.4.5 Small Hydropower Grid Interconnection
4. China Nuclear Power Industry
4.1Global Nuclear Power Development
4.1.1 Nuclear Power Units Quantity
4.1.2 Installed Capacity
4.1.3 United States
4.1.4 Canada
4.1.5 United Kingdom
4.1.6 Russia
4.1.7 France
4.1.8 Germany
4.1.9 Japan
4.1.10 South Korea
4.1.11 India
4.2 Nuclear Power Cost
4.3 China Nuclear Power Development Environment
4.3.1 Resources Restriction
4.3.2 Policies
4.4 Construction of China Nuclear Power Plants
4.4.1 Operated Nuclear Power Units
4.4.2 Under-construction and Planned Nuclear Power Units
4.4.3 Nuclear Power Units to be Built
4.5 Nuclear Power Operation
4.5.1 Quantity of Units
4.5.2 Installed Capacity
4.5.3 Power Generation
4.5.4 Operation
4.5.5 Price
4.6 Key Nuclear Power Companies
4.6.1 China National Nuclear Corporation
4.6.2 Guangdong Nuclear Power Group Co., Ltd.
4.6.3 Harbin Power Equipment Company
4.6.4 Guangdong Nuclear Power Joint Venture Co., Ltd.
5. China Solar Energy Industry
5.1 Global Solar Energy Development
5.1.1 Germany
5.1.2 Japan
5.1.3 United States
5.1.4 Spain
5.1.5 Italy
5.2 Exploitation of Resources
5.2.1 Technology Application
5.2.2 Advantages
5.3 Policies
5.4 Development Trends
5.5 Solar Cell Market
5.5.1 Overview
5.5.2 Solar Module Market
5.5.3 Solar Cell System Market
5.5.4 Q-CELL
5.5.5 Sanyo
5.5.6 Mitsubishi Electric
5.5.7 RWE SCHOTT SOLAR
5.5.8 BP SOLAR
5.5.9 Suntech (Wuxi)
5.5.10 Motech (Taiwan)
5.5.11 SHELL SOLAR
6. China Wind Power Industry
6.1 Global Wind Energy Development
6.1.1 Overview
6.1.2 Germany
6.1.3 Spain
6.1.4 United States
6.2 Global Marine Wind Power Development
6.3 China Wind Power Development
6.3.1 Resources Distribution
6.3.2 Resources Characteristics
6.3.3 China Marine Wind Power Development
6.4 Policies
6.5 Installed Capacity
6.6 China Wind Farm Development
6.7 Wind Power On-Grid Price
6.8 Wind Power Cost
6.8.1 Cost Structure of Units
6.8.2 Investment Cost of Wind Farms
6.8.3 Operating Cost of Wind Farms
6.9 Wind Power Regions
6.9.1 Inner Mongolia
6.9.2 Gansu
6.9.3 Hebei
6.9.4 Jilin
6.9.5 Xinjiang
6.9.6 Liaoning
6.9.7 Heilongjiang
6.9.8 Shandong
6.9.9 Ningxia
6.10 China Wind Power Equipment Industry
6.10.1 Market Overview
6.10.2 Competition Pattern
6.11 Domestic-funded Wind Turbine Manufacturers
6.11.1 Xinjiang Gold Wind Technology Co., Ltd.
6.11.2 Huarui Wind Power Technology Co., Ltd.
6.11.3 Dongfang Electric Co., Ltd.
6.11.4 Huayi Electric Apparatus Group
6.12 Foreign-funded Wind Turbine Manufacturers in China
6.12.1 Vestas
6.12.2 Gamesa
6.12.3 GE Wind Energy
6.13 Wind Turbine Parts Industry
6.14 Blade
6.14.1 Introduction
6.14.2 Demand
6.14.3 Production
6.14.4 Development Trends
6.14.5 Sinomatech Wind Power Blade Co., Ltd.
6.14.6 Tianjin Xinmao Technology Co., Ltd.
6.14.7 CNAC (Baoding) Teng-Hui Wind Power Equipment Co., Ltd.
6.15 Gearbox
6.15.1 Market Overview
6.15.2 China High Speed Transmission Equipment Group Co., Ltd.
6.15.3 Chongqing Gearbox Co., Ltd.
6.15.4 Hangzhou Advance Wind Power Gearbox Co., Ltd.
6.16 Generator
6.16.1 Market Overview
6.16.2 Xiangtan Electric Manufacturing Corporation Ltd.
6.16.3 Zhuzhou Nanche Electric Co., Ltd.
6.16.4 Yongji Electric Co., Ltd.
6.17 Bearing
6.17.1 Market Overview
6.17.2 SKF (Sweden)
6.17.3 Schaeffler Group
6.17.4 Luoyang LYC Bearing Co., Ltd.
6.17.5 Zhejiang Tianma Bearing Co., Ltd.
6.17.6 Wafangdian Bearing Group
6.17.7 Other Companies
6.18 Transducer
6.18.1 Market Overview
6.18.2 ABB
6.18.3 Chino-Harvest Wind Power Technology Co., Ltd.
6.18.4 Vacon
6.18.5 Beijing Corona Science and Technology Co., Ltd.
6.18.6 Hefei Sungrow Power Supply Co., Ltd.
6.18.7 Harbin Jiuzhou Electric Co., Ltd.
6.19 Wind Power Equipment Development in Key Regions
6.19.1 Tianjin
6.19.2 Xinjiang
6.19.3 Jiangsu
6.19.4 Liaoning
6.19.5 Hebei
6.19.6 Hunan
6.20 Investment Risk of China Wind Power Equipment Industry
6.20.1 Development Trends of Wind Power Units
6.20.2 Development Trends of Turbine Parts
图:2008年清洁能源市场规模
表:2008年主要国家清洁能源应用情况
表:2008年全球清洁能源投资情况
图:2008年部分清洁能源市场规模及对2018年的预测
表:“十一五”重点开发水电流域及水电项目
表:中国水利资源蕴藏量
图:2007-2008年中国水电在电力总装机容量和总发电量中的比重
表:2002-2008年中国电力、水电装机容量和发电量
图:水电行业发电装机容量预测
图:2007-2009年2月中国单月水力发电量 单位:亿千瓦小时
表:不同地区水电工程项目单位造价(单位:RMB/kW)
表:湖北省水力资源分布情况表
表:四川省2008年前3季度水电新增装机容量
表:中国可开发中小水力资源分布情况
图:中国小水电资源区域分布图
图:1996-2020年中国小水电装机容量
图:世界核电装机容量占总装机容量的比例
图:加拿大和澳大利亚铀产量的世界份额
图:核电成本与煤电成本的关系
图:核电成本构成
图:传统能源储量的有限性
图:中国铀矿分布
图:2006年中国核电厂分布图
表:截至2009年4月中国投产核电机组(11台)
表:截至2009年4月中国部分在建和已规划核电机组
表:截至2009年4月中国部分拟建核电机组
图:2002-2008年中国核电机组数量
图:2002-2008年中国核电装机容量 单位:MWe
图:2002-2008年中国核电发电量 单位:亿千瓦时
图:2002-2007年中国核电运行事件数量
图:中国核电站上网电价(单位:元/千瓦时,含税)
图:2003-2008年哈尔滨动力营业额和净利润
图:2003-2008年大亚湾、岭澳核电站上网电量
表:2007-2010德国太阳能新增装机容量预测
图:2003-2050年美国太阳能PV路线图
表:2007-2018年全球太阳能电池产量和产业规模
表:2007年国内前十大厂商太阳能电池产量情况
表:2008年全球10太阳能电池厂产量
表:太阳能电池组件平均售价
图:2007年中国主要组件生产商产能统计
图:1990-2040年光伏发电与常规发电价格趋势
图:中国光伏产业“四大集群”分布
图:2002-2008年Q-cells的销售收入
图:2005-2007年Q-cells的产量趋势
图:2002-2008年Q-cells的净利润(已扣除少数股东权益)
图:预计2010和2020年三洋太阳能电池产能
表:三菱电机太阳能电池产能预测
图:2007-2009年Schott Solar产能状况
表:2008-2010年无锡尚德太阳能电池产量预测
表:2004-2008年SHELL公司各部门投资金额 单位:$ million
表:2006-2008年SHELL公司Gas & Power部门业务收入 单位:$ million
表:SHELL的太阳能板生产能力 截至2008年12月31日
图:2003-2010年全球累计风电装机容量变化趋势
图:2008年全球各洲新增风电装机容量情况
图:2008年全球TOP10国家新增风能装机容量
图:2008年全球TOP10国家累计风能装机容量
图:2006-2008年德国风电装机容量变化趋势
图:2006-2008年西班牙风电装机容量变化趋势
图:2006-2008年美国风电装机容量变化趋势
图:2008年美国TOP5洲别风电装机容量
图:1995-2008年全球海上风电发展概况
图: 中国风能资源分布
表:中国海上风电发展大事记
图:2006-2008年中国风电累计装机容量变化趋势
图:2008年中国TOP5省份风电装机容量
表:截至2008年4月中国风电项目建设区域分布
表:中国千万、百万千瓦风电基地规划
表:中国风电特许权项目的主要内容
图:风电机组成本结构
图:中国风力发电前期成本结构
图:中国风力发电运营成本结构
图:2006-2008年内蒙古风电累计装机容量变化趋势
图:2006-2008年甘肃风电累计装机容量变化趋势
图:2006-2008年河北风电累计装机容量变化趋势
图:2006-2008年吉林风电累计装机容量变化趋势
图:2006-2008年新疆风电累计装机容量变化趋势
图:2006-2008年辽宁风电累计装机容量变化趋势
图:2006-2008年黑龙江风电累计装机容量变化趋势
图:2006-2008年山东风电累计装机容量变化趋势
图:2006-2008年宁夏风电累计装机容量变化趋势
图:2008年中国新增风电装机容量TOP5厂商
图:2006-2008年新增风电装机容量内资(合资)和外资市场份额变化趋势
图:2005-2008上半年中国主流风电机型市场份额
图:2006-2008年中国内资和外资新增装机容量变化趋势
图:2008年中国风电企业占内资与合资风机市场份额
表:2008年中国内资风电整机产商竞争地位一览
图:2006-2008年金风科技营业收入情况
表:2008年金风科技主营业务分行业经营情况(单位:万元)
表:2008年金风科技主营业务分产品经营情况 (单位:万元)
表:2006-2008年金风科技毛利率变动情况
表:金风科技上游零部件配套厂商一览
图:2006-2008年华锐新增风电装机容量
表:华锐风电上游零部件配套厂商一览
图:2006-2008年东方电气新增风电装机容量
图:2007-2008年东方电气风电产品营业收入变化趋势
表:东方电气上游零部件配套厂商一览
表:2007-2008年华仪电气风电机组业务盈利情况
表:截至2008年7月华仪电气股份有限公司在手风电场资源
图:华仪电气风机主要上游零部件供应链
表:2004-2008年Vestas营业收入变化趋势
图:Distribution of revenue 2008 (mEUR)
图:Distribution 2008
表:2008年12月31日前交付的维斯塔斯风机
图:风机的基本构造示意图
图:2000-2010年中国风电叶片需求量
表:2008年在中国布局的主要外资叶片生产厂商
表:2008年中国主要内资叶片生产厂商
图:中材叶片与华锐风电签订的风机叶片供货合同明细
表:2006-2008年重庆齿轮箱有限责任公司经营指标
图:2008年湘潭电机股份有限公司营业收入情况
表:2008-2009年中国风电轴承市场规模预计
表:2009年SKF 第一季度财务情况
表:2007-2008年SKF 财务情况
表:2008年SKF 分地区营业情况
表:洛阳LYC轴承有限公司风电轴承大事记
表:洛阳LYC轴承有限公司“新洛轴工程”项目基本情况
表:2008年天马股份营业收入情况
表:瓦轴2008年中期营业收入变化情况
表:瓦房店轴承集团有限责任公司风电轴承大事记
表:2008年ABB财务情况
表:2008年ABB分地区财务情况
图:ACS800-67 风力发电变频器电路图
表:ACS800-67 风力涡轮机传动单元型号
图:2008年中国风力发电机组分机型占比情况
表:直驱式与双馈式风机的比较
Clean Energy Market Scale, 2008
Application of Clean Energy in Major Countries, 2008
Global Clean Energy Investment, 2008
Partial Market Scale of Clean Energy in 2008 and Forecast for 2018
Key Hydropower Basins and Hydropower Projects during the Period of "Eleventh Five-Year Plan"
Reserves of Water Resources in China
Ratio of Hydropower to the Total Power Generation Volume and the Total Power Installed Capacity in China, 2007-2008
Installed Capacity and Generating Volume of Power and Hydropower in China, 2002-2008
Forecast for Hydropower Installed Capacity
Monthly Hydropower Generation in China, 2007 - February 2009
Unit Cost of Hydropower Projects by Region (unit: RMB/kW)
Distribution of Water Resources in Hubei
Newly-increased Installed Capacity of Hydropower in Sichuan, Q1-Q3 2008
Distribution of Exploitable Small and Medium-scale Water Resources in China
Distribution of Small Hydropower Resources in China
Installed Capacity of Small Hydropower in China, 1996-2020
Ratio of Installed Capacity of Nuclear Power to the Total Installed Capacity in the World
Ratio of Canada and Australia to the Global Uranium Production
Relationship between Cost of Nuclear Power and Coal-fire Electricity Cost
Cost Structure of Nuclear Power
Restriction of Conventional Energy Reserves
Uranium Resources Distribution in China
Distribution of China Nuclear Power Plants, 2006
Nuclear Power Sets already Built in China (11 sets) by April 2009
Nuclear Power Sets under Construction and Planned to Build in China by April 2009
Nuclear Power Sets Proposed to Build in China by April 2009
Quantity of Nuclear Power Sets in China, 2002-2008
Installed Capacity of Nuclear Power in China, 2002-2008 (unit: MWe)
Nuclear Power Generation in China, 2002-2008 (Unit: 100 million KWh)
Operation of Nuclear Power in China, 2002-2007
On-grid Power Price of China Nuclear Power Plants (unit: RMB/kWh, including tax)
Turnover and Net Profit of Harbin Power Equipment Company Limited, 2003-2008
On-grid Power Volume of Daya Bay Nuclear Power Station and Ling Ao Nuclear Power Station, 2003-2008
Increased Installed Capacity of Solar Power in Germany, 2007-2010
PV Map of Solar Power in the USA, 2003-2050
Global Solar Cell Production and Industry Scale, 2007-2018
Output of China Top Ten Solar Cell Manufacturers, 2007
Production of Top Ten Global Solar Cells Manufacturers, 2008
Average Selling Price of Solar Modules
Production Capacity of Major Module Manufacturers, 2007
Price Trends of PV and Conventional Power Generation, 1990-2040
Distribution of "Four Clusters" in China PV Industry
Sales Revenue of Q-cells, 2002-2008
Production of Q-cells, 2005-2007
Net profit of Q-cells (after deducting minority interests), 2002-2008
Forecast for the Production Capacity of Sanyo Solar Cell in 2010 and 2020
Forecast for Solar Cell Production Capacity of Mitsubishi Electric
Production Capacity of Schott Solar, 2007-2009
Forecast for Solar Cell Output of Suntech (Wuxi), 2008-2010
Investment of SHELL Corporation by Division, 2004-2008 (US$: Million)
Revenue of Gas & Power Division of SHELL Corporation, 2006-2008 (US$: Million)
Solar Panel Production Capacity of SHELL by December 31 2008
Accumulated Installed Capacity of Wind Power in the World, 2003-2010
Increased Installed Capacity of Wind Power by Continent, 2008
Top 10 Countries in Increased Installed Capacity of Wind Power, 2008
Top 10 Countries in Accumulated Installed Capacity of Wind Power, 2008
Installed Capacity of Wind Power in Germany, 2006-2008
Installed Capacity of Wind Power in Spain, 2006-2008
Installed Capacity of Wind Power in USA, 2006-2008
Top 5 States in Installed Capacity of Wind Power in USA, 2008
Global Marine Wind Power Development, 1995-2008
Distribution of China Wind Power Resources
Key Events of China Marine Wind Power Development
Accumulated Installed Capacity of Wind Power in China, 2006-2008
Top 5 Provinces in Installed Capacity of Wind Power in China, 2008
Regional Distribution of China Wind Power Projects by April 2008
China Wind Power Base (Million KW, 10 Million KW) Plan
Main Content of China Franchised Wind Power Projects
Cost Structure of Wind Power Sets
Investment Cost Structure of Wind Power in China
Operating Cost Structure of Wind Power in China
Accumulated Installed Capacity of Wind Power in Inner Mongolia, 2006-2008
Accumulated Installed Capacity of Wind Power in Gansu, 2006-2008
Accumulated Installed Capacity of Wind Power in Hebei, 2006-2008
Accumulated Installed Capacity of Wind Power in Jilin, 2006-2008
Accumulated Installed Capacity of Wind Power in Xinjiang, 2006-2008
Accumulated Installed Capacity of Wind Power in Liaoning, 2006-2008
Accumulated Installed Capacity of Wind Power in Heilongjiang, 2006-2008
Accumulated Installed Capacity of Wind Power in Shandong, 2006-2008
Accumulated Installed Capacity of Wind Power in Ningxia, 2006-2008
China Top 5 Manufacturers in Increased Installed Capacity of Wind Power, 2008
Increased Installed Capacity of Wind Power in Domestic-funded (Joint Venture) Market and Foreign-funded Market, 2006-2008
Market Shares of Major Models of Wind Turbines in China, 2005- H1 2008
Increased Installed Capacity in Domestic-funded (Joint Venture) and Foreign-funded Market, 2006-2008
Shares Held by China Wind Power Enterprises in Domestic-funded (Joint Venture) Market and Foreign-funded Market, 2008
Rank of Domestic-Funded Wind Turbines Manufacturers, 2008
Operating Revenue of Gold Wind Science and Technology Co., Ltd., 2006-2008
Performance of Gold Wind Science and Technology Co., Ltd. by industry (CNY10,000), 2008
Performance of Gold Wind Science and Technology Co., Ltd. by Product (CNY 10,000), 2008
Gross Profit Margin of Gold Wind Science and Technology Co., Ltd., 2006-2008
Upstream Components Manufacturers of Gold Wind Science and Technology Co., Ltd.
Increased Installed Capacity of Wind Power of Huarui Wind Power Technology Co., Ltd., 2006-2008
Upstream Components Manufactures of Huarui Wind Power Technology Co., Ltd.
Increased Installed Capacity of Wind Power of Dongfang Electric Co., Ltd., 2006-2008
Operating Revenue of Dongfang Electric Co., Ltd. in Wind Power Products, 2007-2008
Upstream Components Manufacturers of Dongfang Electric Co., Ltd.
Profits of Huayi Electric Apparatus Group in Wind Power Sets, 2007-2008
Wind Farm Resources Held by Huayi Electric Apparatus Group by July 2008
Upstream Components Supply Chain of Huayi Electric Apparatus Group
Operating Revenue of Vestas, 2004-2008
Vestas Turbines Delivered before December 31 2008
Structure of Turbine
Demand for Blade in China, 2000-2010
Main Foreign Blade Manufacturers in China, 2008
Major China Domestic Blade Manufacturers in China, 2008
Blade Supply Contract Signed between Sinomatech Wind Power Blade Co., Ltd. and Huarui Wind Power Technology Co., Ltd.
Operating Indicators of Chongqing Gearbox Co., Ltd., 2006-2008
Operating Revenue of Xiangtan Electric Manufacturing Corporation Ltd., 2008
Forecast for China Wind Power Bearing Market Scale, 2008-2009
Financial Results of SKF, Q1 2009
Financial Results of SKF, 2007-2008
Performance of SKF by Region, 2008
Key Events of Luoyang LYC Bearing Co., Ltd. in Bearing
"New LYC project" of Luoyang LYC Bearing Co., Ltd.
Operating Revenue of Zhejiang Tianma Bearing Co., Ltd., 2008
Operating Revenue of Wafangdian Bearing Group, Mid 2008
Bearing Events of Wafangdian Bearing Group
Financial Results of ABB, 2008
Financial Results of ABB by Region, 2008
Circuit Diagram of Transducer ACS800-67
Drive Unit Model of Wind Turbine ACS800-67
Proportion of Wind Turbine Sets by Model in China, 2008
Comparison between Direct-drive Turbine and Doubly-fed Turbine
如果这份报告不能满足您的要求,我们还可以为您定制报告,请 留言说明您的详细需求。
|