|
|
|
报告导航:研究报告—
TMT产业—消费电子
|
|
2008-2009年中国及全球 触控(触摸)屏产业研究报告 |
 |
字数:5.0万 |
页数:127 |
图表数:85 |
|
中文电子版:9000元 |
中文纸版:4500元 |
中文(电子+纸)版:9500元 |
|
英文电子版:2600美元 |
英文纸版:2500美元 |
英文(电子+纸)版:2900美元 |
|
编号:ZYW009
|
发布日期:2009-08 |
附件:下载 |
 |
|
|
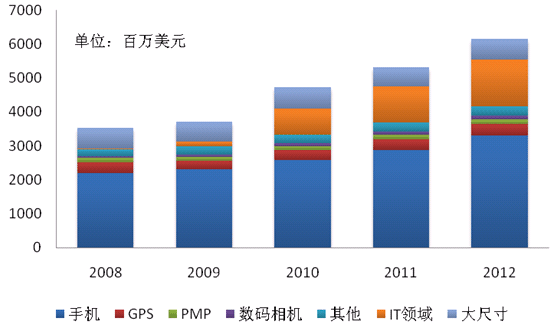
2008年全球触摸屏主要的应用领域是手机、GPS、PMP、数码相机、IT领域、大尺寸以及其他领域。其中未来最具成长性的IT领域,主要的原因是全球依靠WINDOWS7的推动,带触控功能的笔记本电脑将大量出现。其次是手机领域,当触摸屏的成本足够低是,即便是不具备实用价值,消费者也一样选择触控屏,而不具备该功能的手机肯定会被淘汰,所以未来触摸屏在手机领域的发展大有可为。
图:2008-2012年全球触控屏应用分布
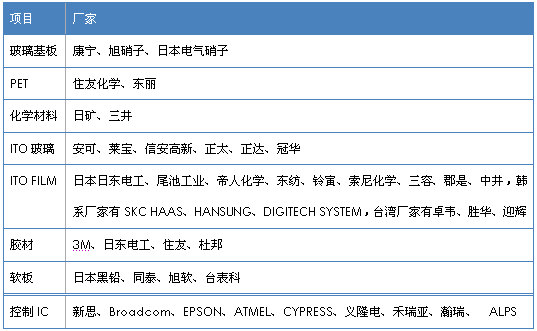
就全球触控屏产业链上游来看,日本厂家占据了比较高的市场份额,主要原因是日本厂家在真空蒸镀、溅镀、精密涂布以及精细化工领域拥有无可撼动的霸主地位,技术优势非常明显。触控屏上游厂家的利润率远高于下游,比如小尺寸领域,按出货量,台湾厂家占43%的份额,按金额,台湾厂家只占32%。
表:触控屏产业链上游厂家一览
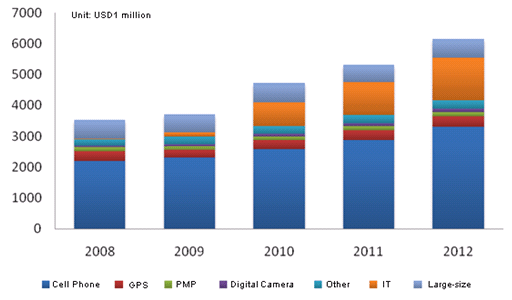
The touch screen was mainly applied for cell phone, GPS, PMP, digital camera, IT and the other fields all over the world in 2008. IT is with the most promising growth potential in the future since a large number of laptops with touch screen will occur under the drive of WINDOWS7. Then cell phone is followed, as the consumers will choose touch screen when the cost is low enough, while the cell phones without touch screen will be eliminated. Therefore, the development of touch screen in the cell phone field will be prosperous.
Global Touch Screen Distribution by Application, 2008-2012
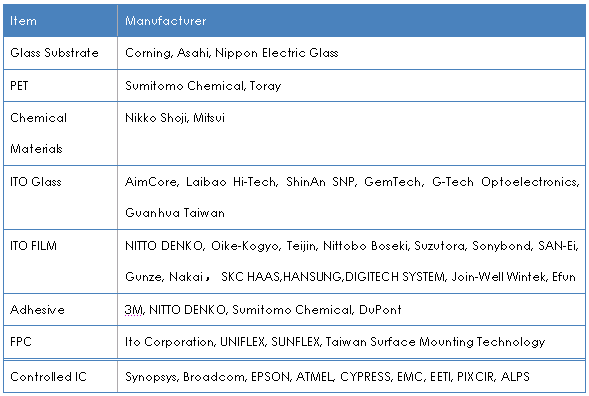
In the upstream of world’s touch screen industry chain, Japan’s manufacturers have held the higher market share, since with outstanding technology advantages in vacuum evaporation, sputtering, precision coating and fine chemicals. In the meantime, the manufacturers in touch screen upstream enjoys far higher profit margin than the downstream. In small-size field, for instance, Taiwan manufacturers account for 43% of market shares by shipment, while it is only 32% by sum.
Touch Screen Upstream Manufacturers
第一章:触控屏概况
1.1、电阻式触控面板
1.1.1、四线电阻触控屏
1.1.2、五线电阻触控屏
1.2.、电容式触控面板
1.2.1、表面电容式触控面板
1.2.2、投射式电容触控屏
1.2.3、投射式电容触控屏基板
1.2.4、投射式电容触控屏接口
1.3.、表面声波式与红外线式触控面板
1.4、电磁式(ELECTROMAGNETIC)触控屏
1.5、触控屏特殊性能
1.5.1、防反射触控屏
1.5.2、防干涉纹
1.5.3、防闪烁
1.5.4、防污
1.6、WINDOWS 7与触控屏
1.7、对应WINDOWS 7的大尺寸电容触控屏
1.8、IN-CELL触控屏
第二章:触控屏市场
2.1、触控屏市场规模
2.2、手机触控屏市场分析
2.2.1、全球智能手机市场
2.2.2、中国智能手机市场
2.3、GPS及其它触控屏市场分析
2.3.1、汽车GPS导航
2.3.2、数码相机
2.4、大中尺寸触控屏市场分析
第三章:触控屏产业
3.1、触控屏产业链
3.2、触控屏生产
3.3、触控屏厂家对比
第四章:触控屏厂家研究
4.1、洋华
4.2、界面光电
4.3、万达光电
4.4、嵩达光电
4.5、华睿川
4.6、中华意力
4.7、坤巨
4.8、荧茂光学
4.9、NISSHA(日本写真印刷)
4.10、和鑫
4.11、达虹科技
4.12、ELO TOUCHSYSTEMS
4.13、时纬科技
4.14、群创
4.15、富晶通科技
4.16、信利
4.17、TPK
4.18、宇辰光電
4.19、胜华
第五章:ITO玻璃厂家研究
5.1、ITO玻璃产业
5.2、安可光电
5.3、莱宝高科
5.4、信安高新
5.5、正太科技
5.6、正达科技
5.7、冠华科技
第六章:ITO FILM厂家研究
6.1、ITO FILM产业
6.2、日东电工
6.3、尾池工业
6.4、PRO-VISION
第七章:触控屏控制IC厂家研究
7.1、触控屏控制IC简介
7.2、触控屏控制IC产业
7.3、义隆电子
7.4、禾瑞亚
7.5、CYPRESS
7.6、升达科技
7.7、SYNAPTICS(新思)
7.8、PIXCIR
1. Overview of Touch Screen
1.1 Resistive Touch Panel
1.1.1 4-wire Resistive Touch Screen
1.1.2 5-wire Resistive Touch Screen
1.2. Capacitive Touch Panel
1.2.1 Surface Capacitive Touch Pane
1.2.2 Projected Capacitive Touch Screen
1.2.3 Projected Capacitive Touch Screen Substrate
1.2.4 Projected Capacitive Touch Screen Interface
1.3. Surface Acoustic Wave & Infrared Touch Panel
1.4 Electromagnetic Touch Screen
1.5 Special Features of Touch Screen
1.5.1 Anti-reflective
1.5.2 Anti-interference Pattern
1.5.3 Anti-flicker
1.5.4 Antifouling
1.6 WINDOWS 7 & Touch Screen
1.7 Large-size Capacitive Touch Screen Corresponding to WINDOWS 7
1.8 IN-CELL Touch Screen
2 Touch Screen Market
2.1 Market Size
2.2 Cell Phone Touch Screen Market
2.2.1 Global Smart Phone Market
2.2.2 China Smart Phone Market
2.3 GPS and Other Touch Screen Market
2.3.1 Automotive GPS
2.3.2 Digital Camera
2.4 Large-size Touch Screen Market
3 Touch Screen Industry
3.1 Industry Chain
3.2 Production
3.3 Comparison of Manufacturers
4 Manufacturers
4.1 Young Fast
4.2 Newlife-tech
4.3 Higgstec
4.4 Abon Touchsystems
4.5 Wally-panel
4.6 EELY
4.7 GTouch
4.8 Mildex Opt
4.9 NISSHA
4.10 Sintek Photronic
4.11 CANDO
4.12 ELO TOUCHSYSTEMS
4.13 Swenc
4.14 InnoLux
4.15 Transtouch
4.16 Truly
4.17 TPK
4.18 eTurboTouch
4.19 Wintek
5 ITO Glass Manufacturers
5.1 ITO Glass Industry
5.2 AimCore
5.3 Laibao Hi-Tech
5.4 ShinAn SNP
5.5 GemTech
5.6 G-Tech Optoelectronics
5.7 Guanhua Taiwan
6 ITO FILM Manufacturers
6.1 ITO FILM Industry
6.2 NITTO DENKO
6.3 Oike-Kogyo
6.4 PRO-VISION
7 Touch Screen Controlled IC Manufacturers
7.1 Touch Screen Controlled IC
7.2 Touch Screen Controlled IC Industry
7.3 EMC
7.4 EETI
7.5 CYPRESS
7.6 UMT
7.7 SYNAPTICS
表:四线电阻屏和五线电阻屏比较
表:玻璃和PET基板比较
表:2008-2014年全球触控屏市场规模
表:2008-2012年全球触控屏应用分布
表:2008-2012年触控屏各领域出货量分布
表:2008年触控屏技术分布
表:2008-2011年全球手机、数码相机、手持GPS导航、PMP出货量统计及预测
表:2008-2014年手机触控屏渗透率
表:2007-2012年全球手机出货量与智能手机所占比例统计及预测
表:2007-2009年全球手机出货量与增速统计
表:2007-2009年手机出货量地域分布
表:2007-2009年全球手机出货技术分布
表:2008年全球前十三大品牌厂家出货量统计
图:2008年全球主要手机品牌市场占有率
表:2008年全球主要智能手机厂家市场占有率
表:2004-2012年中国手机市场销量与智能手机所占比例统计
表:2008年中国手机产量前25大厂家产量排行
表:2008年中国主要手机厂家市场占有率
表:2008年中国智能手机主要厂家市场占有率
表:2008年中国手机出口前23个国家及地区
图:2008-2012年全球GPS设备出货量
表:2008年全球PND市场主要厂家市场占有率
图:2009年上半年全球PND厂家市场占有率
表:2007-2013年全球汽车GPS导航市场规模统计及预测
表:2007-2013年全球汽车GPS导航出货量统计及预测
表:2006-2010年全球汽车GPS导航出货量地域分布
表:2008年全球汽车售后GPS导航主要厂家市场占有率
表:2004-2011年数码相机出货量与触控屏渗透率统计及预测
表:2008年全球主要数码相机厂家市场占有率
表:2008年非量产触控屏领域下游应用分布
表:2006-2011年全球触控笔记本电脑出货量预测
图:触控屏产业链
图:触控屏生产工艺流程
表:2008年触控屏厂家成本结构
表:全球触控屏产品分布一览
表:台湾厂家大多具备集团背景
表:2009年全球18家主要触控屏厂家收入预测
表:2005-2010年洋华收入与运营利润统计及预测
图:洋华工厂分布
图:洋华主要客户
图:采用洋华触控屏的手机
表:洋华各工厂产能
图:洋华2007年4季度-2008年4季度洋华触控屏下游应用比例
表:2006-2010年华睿川收入与毛利率统计
表:2004-2008年意力(广州)电子科技有限公司营业额统计
表:意力(广州)电子科技有限公司客户一览
表:意力(广州)电子科技有限公司主要设备一览
表:荧茂光学2005-2008年收入与运营利润统计
图:日本写真印刷2004财年-2010财年海外销售额地域分布
图:日本写真印刷2004财年-2010财年各类型产品销售额与运营利润率统计及预测
图:日本写真印刷2008财年-2009财年各类型产品销售额与运营利润率统计
图:日本写真印刷2007-2010财年各部门投资额度统计及预测
图:日本写真印刷2004财年-2010财年触控屏业务下游应用分布
表:2002-2009年胜华收入与毛利率统计及预测
图:胜华全球分布
图:2006-2008年胜华产品技术结构
图:2008年1季度-2009年4季度胜华产品收入结构
图:2008年胜华产品下游应用分布
图:2007年上半年-2008年下半年胜华触控屏领域收入统计
表:2004-2010年和鑫收入与运营利润率
表:2004-2010年达虹收入与运营利润统计
图:2008年TYCO各事业部收入统计
图:2008年TYCO收入地域分布
图:2008年TYCO收入下游应用分布
图:群创模式
表:2003-2010年群创收入与运营利润率统计及预测
表:2004-2008年富晶通收入与运营利润统计
图:2001-2008年信利半导体毛利率、纯利率、运营利润率统计
表:2002-2008年信利收入与毛利率统计
表: ITO玻璃发展趋势
图:2006-2010年莱宝高科产品收入结构统计及预测
图:冠华科技2006年9月-2009年6月每月收入统计
表:2008年全球ITO FILM主要厂家市场占有率
图:2001-2008财年日东电工收入与运营利润统计
图:2001-2008财年日东电工产品收入分布
表:1999-2008年财年日东电工电子材料事业部收入与运营利润统计
表:2004-2010年义隆电子收入与运营利润率统计及预测
图:2007年1季度-2009年2季度义隆电子产品收入结构
图:2004-2008年禾瑞亚收入与运营利润统计
图:禾瑞亚研发力量分布
图:禾瑞亚SWOT分析
图:1987年1季度-2009年2季度CYPRESS每季度收入统计
图:2008年3季度-2009年2季度CYPRESS收入地域分布
图:1987年1季度-2009年2季度CYPRESS毛利率统计
表:2004-2009财年新思科技收入与运营利润率统计
Comparison between 4-wire Resistive Touch Screen and 5-wire Resistive Touch Screen
Comparison between Glass and PET Substrate
Global Touch Screen Market Size, 2008-2014E
Global Touch Screen Distribution by Application, 2008-2012E
Touch Screen Shipment by Field, 2008-2012E
Touch Screen Distribution by Technology, 2008
Global Cell Phone, Digital Camera, Hand-held GPS and PMP Shipment, 2008-2011E
Cell Phone Touch Screen Penetration Ratio, 2008-2014E
Global Cell Phone Shipment and Ratio of Smart Phone, 2007-2012E
Global Cell Phone Shipment and Growth Rate, 2007-2009E
Global Cell Phone Shipment by Region, 2007-2009
Global Cell Phone Shipment by Technology, 2007-2009
Shipment of Global Top 13 Brand Manufacturers, 2008
Global Market Shares of Main Cell Phone Brands, 2008
Market Shares of World’s Main Smart Phone Manufacturers, 2008
Cell Phone Sales in China and Ratio of Smart Phone, 2004-2012E
China’s Top 25 Cell Phone Manufacturers by Output, 2008
Market Shares of China’s Main Cell Phone Manufacturers, 2008
Market Shares of China’s Main Smart Phone Manufacturers, 2008
China’s Top 23 Countries and Regions by Cell Phone Export, 2008
Global GPS Shipment, 2008-2012E
Market Shares of World’s Main PND Manufacturers, 2008
Market Shares of World’s PND Manufacturers, 1H2009
Global Auto GPS Market Size, 2007-2013E
Global Auto GPS Shipment, 2007-2013E
Global Auto GPS Shipment by Region, 2006-2010E
Market Shares of Global Main Auto After-sale GPS Manufacturers, 2008
Digital Camera Shipment and Touch Screen Penetration Ratio, 2004-2011E
Market Shares of World’s Main Digital Camera Manufacturers, 2008
Non-mass Production Touch Screen Downstream Applications, 2008
Global Touch Laptop Shipment, 2006-2011E
Touch Screen Industry Chain
Touch Screen Production Technique Flow
Cost Structure of Touch Screen Manufacturers, 2008
Distribution of Global Touch Screen Products
Background of Taiwan Manufacturers
Revenue of Global Main 18 Touch Screen Manufacturers, 2009
Revenue and Operation Profit of Young Fast, 2005-2010E
Plants of Young Fast
Main Clients of Young Fast
Cell Phones with Young Fast Touch Screen
Output Capacity of Young Fast’s Plants
Young Fast Touch Screen Downstream Application & Ratios, 2007Q4-2008Q4
Wally-panel Revenue and Gross Profit Margin, 2006-2010E
Turnover of EELY (Guangzhou) , 2004-2008
Clients of EELY (Guangzhou)
Main Equipments of EELY (Guangzhou)
Revenue and Operation Profit of Mildex Opt, 2005-2008
Oversea Sales of NISSHA by Region, FY 2004- FY2010
NISSHA Sales and Operation Profit Margin by Product, FY2004- FY 2010
NISSHA Sales and Operation Profit Margin by Product, FY2008- FY2009
NISSHA Investment by Division, FY2007- FY2010
NISSHA Touch Screen Downstream Application, FY2004-FY2010
Revenue and Gross Profit Margin of Wintek, 2002-2009E
Global Presence of Wintek
Wintek Products by Technology, 2006-2008
Wintek Revenue by Product, 2008Q1-2009Q4
Wintek Product Downstream Application, 2008
Wintek Revenue from Touch Screen Field, 1H2007-2H2008
Revenue and Operating Profit Margin of Sintek Photronic, 2004-2010E
CANDO Revenue and Operating Profit Margin, 2004-2010E
TYCO Revenue by Division, 2008
TYCO Revenue by Region, 2008
TYCO Revenue from Downstream Application, 2008
Modes of InnoLux
Revenue and Operating Profit Margin of InnoLux , 2003-2010E
Revenue and Operating Profit of Transtouch, 2004-2008
Gross Profit Margin, Net Profit Margin and Operating Margin of Truly Semiconductor, 2001-2008
Revenue and Gross Profit Margin of Truly Semiconductor, 2002-2008
ITO Glass Development Trend
Laibao Hi-Tech Revenue by Product, 2006-2010E
Monthly Revenue of Guanhua Taiwan, Sep, 2006-Jun, 2009
Market Shares of Global Main ITO FILM Manufacturers, 2008
Revenue and Operating Profit of NITTO DENKO, 2001-2008
Revenue of NITTO DENKO by Product, 2001-2008
Revenue and Operating Profit of NITTO DENKO Electronic Material Division, 1999-2008
Revenue and Operating Margin of EMC, 2004-2010E
Revenue of EMC by Product, 2007Q1-2009Q2
EETI Revenue and Operating Profit, 2004-2008
R&D Strength of EETI
SWOT of EETI
Quarterly Revenue of Cypress, 1987Q1-2009Q2
Revenue of Cypress by Region, 2008Q3-2009Q2
Gross Profit Margin of Cypress, 1987Q1-2009Q2
Revenue and Operating Margin of SYNAPTICS, FY2004-FY2009
如果这份报告不能满足您的要求,我们还可以为您定制报告,请 留言说明您的详细需求。
|