|
|
|
报告导航:研究报告—
TMT产业—电信
|
|
2009年上半年中国手机整机产业研究报告 |
 |
字数:2.9万 |
页数:110 |
图表数:86 |
|
中文电子版:6000元 |
中文纸版:3000元 |
中文(电子+纸)版:6500元 |
|
英文电子版:2200美元 |
英文纸版:2100美元 |
英文(电子+纸)版:2500美元 |
|
编号:ZYW010
|
发布日期:2009-08 |
附件:下载 |
 |
|
|
2008年上半年手机出口大约为2.48亿部,出口金额为174亿美元。2008年下半年手机出口大约2.85亿部,出口金额211亿美元。全年手机出口5.33亿部,出口额385亿美元,平均出口价格为72美元。2009年上半年中国手机出口为2.37亿部,出口额为161亿美元,手机进口为1174万部。2009年上半年国内手机产量为3.05亿部。
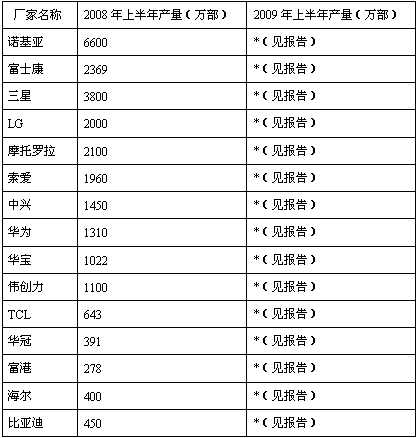
2008上半年、2009上半年中国14大手机厂家产量排名

来源:水清木华
增幅比较大的厂家有比亚迪、三星、中兴和LG。三星的增幅最大,三星的惠州厂产能全部开出,几乎比2008年增加3倍的出货量;中兴在新电信采购中获得比较大的份额;LG则是因为全球出货量增加而增加了中国基地的产量,不过LG大部分新增产量都委托给了台湾华冠;比亚迪收益于诺基亚的适度倾斜政策,出货量增加比较多。降幅比较大的有富士康、摩托罗拉、华为、华宝。富士康一方面受到来自比亚迪的抢单,另一方面大客户摩托罗拉出货量急剧下降,同时诺基亚也有意减少外包份额,导致出货量下降;华为在2008年下半年试图出售手机业务,最终在2008年年底叫停,华为在2008年下半年手机业务有所停滞,在2009年上半年就表现不利。其余厂家变化不大。
In 1H2008, China exported about 248 million mobile phones, which valued US$17.4 billion. In 2H2008, approximately 285 million mobile phones were exported with the value of US$21.1 billion. Therefore, China exported 533 million mobile phones valued US$38.5 billion totally in 2008, with the average export price of US$72. During the first half of 2009, China exported 237 million mobile phones valued US$16.1 billion, and imported 11.74 million ones; besides, the output of mobile phone was 305 million in China.
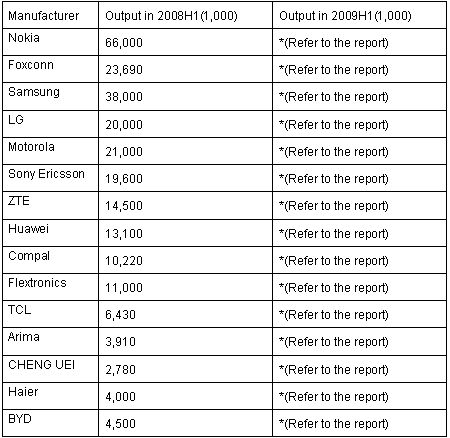
Ranking of 14 Large Mobile Phone Manufacturers by Output in China, 2008H1 & 2009H1

Source: ResearchInChina
BYD, Samsung, ZTE and LG gained high growth rate, particularly Samsung with the highest rate. Among them, the shipment of Samsung's Huizhou Plant was almost three times over that in 2008. ZTE obtained large shares in the new telecoms procurement. Since its increasing global shipment, LG increased the output in China, but the majority of increment was entrusted to Taiwan Arima. Benefiting from Nokia's modest preferential policies, the shipment of BYD rose greatly. In contrast, the growth rate of Foxconn, Motorola, Huawei and Compal declined sharply. The shipment of Foxconn decreased because BYD competed with it for orders and its major clients Motorola and Nokia has less demand. Huawei tried to sell mobile phone business in the second half of 2008, but failed to do it at the end of 2008, so Huawei’s mobile phone business stalled in the second half of 2008 and run unfavorably in the first half of 2009. The remaining manufacturers had little changes.
第一章:2009年上半年全球手机产业与市场
1.1、全球手机市场
1.2、全球手机产业
第二章、2009年上半年中国手机产业与市场
2.1、中国手机市场
2.2、中国手机出口
2.3、中国手机产业
第三章:手机厂家研究
3.1、诺基亚
3.2、摩托罗拉
3.3、三星
3.4、索尼爱立信
3.5、LG
3.6、RIM
3.7、苹果
3.8、宏达国际电子
3.9、PALM
3.10、华宝
3.11、华冠
3.12、TCL通讯
3.13、中兴通讯
3.14、华为
3.15、富港电子
3.16、东莞航天
3.17、西可通信
3.18、侨兴移动
3.19、比亚迪电子
3.20、伟创力
3.21、富士康
3.22、ELCOTEQ
3.23、英华达
3.24、康佳
3.25、波导
3.26、联想移动
3.27、天宇朗通
3.28、海尔通信
3.29、夏新
1.GLOBAL MOBILE PHONE INDUSTRY AND MARKET, 2009H1
1.1 GLOBAL MOBILE PHONE MARKET
1.2 GLOBAL MOBILE PHONE INDUSTRY
2. CHINA MOBILE PHONE INDUSTRY AND MARKET, 2009H1
2.1 CHINA MOBILE PHONE MARKET
2.2 CHINA MOBILE PHONE EXPORT
2.3 CHINA MOBILE PHONE INDUSTRY
3. MOBILE PHONE MANUFACTURERS
3.1 NOKIA
3.2 MOTOROLA
3.3 SAMSUNG
3.4 SONY ERICSSON
3.5 LG
3.6 RIM
3.7 APPLE
3.8 HTC
3.9 PALM
3.10 COMPAL
3.11 ARIMA
3.12 TCL
3.13 ZTE
3.14 HUAWEI
3.15 CHENG UEI
3.16 DONGGUAN AEROSPACE
3.17 CK TELECOM
3.18 QIAO XING MOBILE
3.19 BYD ELECTRONIC
3.20 FLEXTRONICS
3.21 FOXCONN
3.22 ELCOTEQ
3.23 INVENTEC
3.24 KONKA
3.25 BIRD
3.26 LENOVO MOBILE
3.27 TIANYU
3.28 HAIER COMMUNICATIONS
3.29 AMOI
2007-2012年全球手机出货量与智能手机所占比例统计及预测
2007-2009年2季度全球手机出货量与增速统计
2007-2009年2季度手机出货量地域分布
2007-2009年2季度全球手机出货技术分布
2007-2009年2季度全球手机出货量地域分布
2007-2009年上半年全球品牌手机出货量排名
2009年上半年中国大陆主要手机厂家市场占有率
1999-2008年中国手机出口量统计及预测
2002-2008年中国手机出口金额统计及预测
2008年1-12月每月出货量与平均价格统计
2008上半年、2009上半年中国14大手机厂家产量排名
2008上半年、2009上半年中国32大手机厂家出口量排名
2007、2008、2009年上半年南北诺基亚出口量统计
2007、2008、2009年上半年南北诺基亚产量统计
2007-2009年上半年诺基亚进口量统计
2007年1季度到2009年2季度诺基亚手机地域出货量结构统计
2007年1季度到2009年2季度诺基亚手机出货量与平均销售价格统计
2007年1季度到2008年4季度诺基亚手机出货量与运营利润率统计
诺基亚2006年1季度到2009年2季度每季度手机中国地区出货量统计
诺基亚15款智能手机零组件配置清单
表:星网工业园区诺基亚供应链厂家
2007、2008、2009年上半年摩托罗拉中国出口量产量统计
2007年1季度到2009年2季度摩托罗拉手机部门收入与运营利润率统计
2007年1季度到2009年2季度摩托罗拉手机出货量与平均销售价格
2007年1季度到2009年2季度摩托罗拉手机出货量与市场占有率统计
摩托罗拉3款手机零组件配置清单
2007、2008、2009年天津三星、惠州三星、三星科健出口量、产量统计
三星2001-2008年手机出货量与年增幅统计
三星2006年1季度到2009年2季度每季度手机出货量统计
2006年1季度到2009年2季度三星手机出口平均价格与运营利润率统计
三星10款典型手机零组件配置清单
2006、2007、2008、2009年上半年索尼爱立信中国出口量与产量
2006年1季度到2009年2季度索尼爱立信出货量与平均销售价格统计
2006年1季度到2009年2季度索尼爱立信收入与运营利润率统计
索爱手机平台一览
2007、2008、2009年LG烟台与青岛出口量统计
2001-2008年LG手机出货量与年增幅统计
2005年4季度到2008年4季度LG手机每季度出货量(按制式)
2006年1季度到2008年4季度LG手机每季度销售额与运营利润统计
2006年1季度到2008年4季度LG 手机部门地域收入结构
LG 2006年2季度到2008年4季度销售额、平均价格统计
LG 13款典型手机零组件配置清单
RIM 2004财年到2009财年收入与毛利率统计
RIM 2005财年到2009财年收入结构
RIM 2005财年到2009财年手机入网用户数与出货量统计
RIM 2005财年到2009财年运营成本结构
2007年1季度到2009年2季度苹果与RIM出货量统计
苹果2004-2008财年收入与净利润统计
苹果2004-2008财年地域收入结构
苹果2004-2008财年产品收入结构比例
2003-2010年宏达电收入与毛利率统计
2004-2010年宏达电出货量与平均销售价格统计
2007-2009年宏达电人员结构
2007-2009年宏达电员工学历结构
2006-2008年宏达电地域收入结构比例
2008年1季度-2009年2季度宏达电出货量与平均价格统计
2008年1季度-2009年2季度宏达电收入与年度增长率统计
Palm 2004-2009财年收入运营利润统计
Palm 2007财年1季度到2009财年4季度智能手机出货量统计
华宝组织结构
2001-2010年华宝通讯营业收入与毛利率统计与预测
2004-2010年华宝手机出货量与平均价格统计
华冠各部门简介
华冠全球布局
2003年-2009年华冠手机出货量统计
华冠通讯大陆投资结构图
华冠通讯大陆投资公司简介
华冠通讯研究人力资源分布
华冠通讯智能手机路线图
TCL通讯组织结构图
2002年-2008年TCL通讯收入与毛利率统计
2006-2009年上半年TCL手机海外与国内出货量统计
2006-2008年TCl手机出货量地域分布
2002-2008年TCL各项支出统计
2007年1季度-2009年2季度TCL手机每季度出货量与销售额统计
2006-2009年上半年中兴通讯手机出货量
2006-2009年上半年华为手机出货量
HI3611典型应用图
HI3611内部框架
2005-2010年正崴收入与运营利润率统计及预测
2007-2009年正崴产品收入结构
2004-2008年侨兴环球收入与运营利润统计
侨兴环球组织结构
2004-2008年侨兴移动收入与运营利润统计
2004-2008年侨兴移动手机出货量与平均价格统计
2006-2008年侨兴主力产品所占收入比例统计
2004-2008年比亚迪电子收入与毛利率统计
2006-2008年比亚迪电子收入地域分布
2007年3季度-2009年2季度伟创力产品收入结构
2007年3季度-2009年2季度伟创力收入与毛利率统计
伟创力核心战略
伟创力中国生产基地一览表
2003-2009年富士康国际收入与运营利润统计及预测
2004-2008年富士康国际员工数量与成本统计
2005-2008年富士康国际收入地域分布
富士康国际主要子公司2006-2009年上半年手机出口量统计
富士康国际主要子公司2007年财务数据
富士康主要子公司联系方式
2006年1季度-2009年2季度ELCOTEQ收入统计
2006年1季度-2009年2季度ELCOTEQ收入地域分布
2006年1季度-2009年2季度ELCOTEQ人力资源地域分布
2006年1季度-2009年2季度ELCOTEQ运营利润率统计
2007年1季度-2009年2季度ELCOTEQ个人通信部门收入与EBIT统计
2001-2008年英华达收入与毛利率统计
英华达核心技术
英华达业务模式
波导股份结构
2005-2008年波导销量、销售额、平均价格统计
天宇朗通组织结构图
Global Shipment of Mobile Phone and Ratio of Smartphone, 2007-2012E
Global Shipment of Mobile Phones and Growth Rates, 2007-2009Q2
Shipment of Mobile Phone by Region, 2007-2009Q2
Global Shipment of Mobile Phone by Technology, 2007-2009Q2
Global Shipment of Mobile Phone by Region, 2007-2009Q2
Ranking of Global Mobile Phone Brands by Shipment, 2007-2009H1
Market Shares of Major Mobile Phone Manufacturers in Mainland China, 2009H1
China's Mobile Phone Export Volume, 1999-2008
China's Mobile Phone Export Value, 2002-2008
Monthly Shipment and Average Price of Mobile Phone, Jan-Dec 2008
Ranking of 14 Large Mobile Phone Manufacturers by Output in China, 2008H1 & 2009H1
Ranking of 32 Large Mobile Phone Manufacturers by Export Volume in China, 2008H1 & 2009H1
Nokia's Export Volume, 2007-2009H1
Nokia's Output, 2007-2009H1
Nokia's Import Volume, 2007-2009H1
Nokia's Shipment of Mobile Phone by Region, 2007Q1-2009Q2
Nokia's Shipment and Average Selling Price of Mobile Phone, 2007Q1-2009Q2
Nokia's Shipment and Operating Profit Margin of Mobile Phone, 2007Q1-2008Q4
Nokia's Quarterly Shipment of Mobile Phone in China, 2006Q1-2009Q2
Components of 15 Types of Nokia's Smart Phone
Nokia's Supply Chain Network in Xingwang Industrial Park
Motorola's Export Volume and Output in China, 2007-2009H1
Motorola's Revenue and Operating Profit Margin in Mobile Phone, 2007Q1-2009Q2
Motorola's Shipment and Average Selling Price of Mobile Phone, 2007Q1-2009Q2
Motorola's Shipment and Market Shares of Mobile Phone, 2007Q1-2009Q2
Components of 3 Types of Motorola's Mobile Phone
Export Volume and Output of Tianjin Samsung, Huizhou Samsung and Samsung Kejian, 2007-2009
Samsung's Shipment and Annual Growth Rate of Mobile Phone, 2001-2008
Samsung's Quarterly Shipment of Mobile Phone, 2006Q1-2009Q2
Samsung's Average Export Price and Operating Profit Margin of Mobile Phone, 2006Q1-2009Q2
Components of 10 Types of Samsung's Mobile Phone
Sony Ericsson's Export Volume and Output in China, 2006-2009H1
Sony Ericsson's Shipment and Average Selling Price of Mobile Phone, 2006Q1-2009Q2
Sony Ericsson's Revenue and Operating Profit Margin, 2006Q1-2009Q2
Sony Ericsson's Mobile Phone Platforms
LG's Export Volume in Yantai and Qingdao, 2007-2009
LG's Shipment and Annual Growth Rate of Mobile Phone, 2001-2008
LG's Quarterly Shipment of Mobile Phone by Standard, 2005Q4-2008Q4
LG's Quarterly Sales Volume and Operating Profit Margin of Mobile Phone, 2006Q1-2008Q4
LG's Revenue of Mobile Phone by Region, 2006Q1-2008Q4
LG's Sales Volume and Average Selling Price of Mobile Phone, 2006Q2-2008Q4
Components of 13 Types of LG's Mobile Phone
Rim's Revenue and Gross Profit Margin, 2004-2009
Rim's Revenue Structure, 2005-2009
Rim's Mobile Phone Subscribers and Shipment, 2005-2009
Rim's Operating Cost Structure, 2005-2009
Shipment of Apple and Rim, 2007Q1-2009Q2
Apple's Revenue and Net Profit, 2004-2008
Apple's Revenue by Region, 2004-2008
Apple's Revenue Structure, 2004-2008
HTC's Revenue and Gross Margin, 2003-2010
HTC's Shipment and Average Selling Price, 2004-2010
HTC's Staff Structure, 2007-2009
Education Background of HTC's Staff, 2007-2009
HTC's Revenue by Region, 2006-2008
HTC's Shipment and Average Selling Price, 2008Q1-2009Q2
HTC's Revenue and Annual Growth Rate, 2008Q1-2009Q2
Palm’s Revenue and Operating Profit Marhin, 2004-2009
Palm’s Shipment of Smartphone, 2007Q1-2009Q4
Compal's Revenue and Gross Profit Margin, 2001-2010
Compal's Shipment and Average Selling Price of Mobile Phone, 2004-2010
Arima's Departments
Arima's Global Presence
Arima's Shipment of Mobile Phone, 2003-2009
Arima's Investment in Mainland China
Profile of Arima-invested Companies (Mainland China)
Distribution of Arima's Researchers
Arima's Smartphone Roadmap
TCL's Organizational Structure
TCL's Revenue and Gross Profit Margin, 2002-2008
TCL's Shipment of Mobile Phone in China and Abroad, 2006-2009H1
Shipment of Mobile Phone by Region, 2006-2008
TCL's Expenses, 2002-2008
TCL's Quarterly Shipment and Sales Value of Mobile Phone, 2007Q1-2009Q2
Huawei's Shipment of Mobile Phone, 2006-2009H1
Hi3611's Typical Application Chart
Hi3611's Block Diagram
Cheng Uei's Revenue and Operating Profit Margin, 2005-2010
Cheng Uei's Revenue Structure, 2007-2009
Revenue and Operating Profit Margin of Qiao Xing Universal Telephone, 2004-2008
Organiztional Structure of Qiao Xing Universal Telephone
Revenue and Operating Profit Margin of Qiao Xing Mobile, 2004-2008
Shipment and Average Selling Price of Mobile Phone of Qiao Xing Mobile, 2004-2008
Revenue of Qiao Xing's Major Products, 2006-2008
BYD Electronic's Revenue and Gross Profit Margin, 2004-2008
BYD Electronic's Revenue by Region, 2006-2008
Flextronics' Revenue Structure, 2007Q3-2009Q2
Flextronics' Revenue and Gross Profit Margin, 2007Q3-2009Q2
Flextronics' Core Strategy
Flextronics' Production Bases in China
Revenue and Operating Profit of Foxconn International, 2003-2009
Number of Employees and Cost of Foxconn International, 2004-2008
Revenue of Foxconn International by Region, 2005-2008
Export Volume of Mobile Phone of Major Foxconn Subsidiaries, 2006-2009H1
Financial Data of Major Foxconn Subsidiaries, 2007
Contact of Major Foxconn Subsidiaries
Elcoteq's Revenue, 2006Q1-2009Q2
Elcoteq's Revenue by Region, 2006Q1-2009Q2
Elcoteq's Staff by Region, 2006Q1-2009Q2
Elcoteq's Operating Profit Margin, 2006Q1-2009Q2
Revenue and Ebit of Elcoteq's Personal Communications Sector, 2007Q1-2009Q2
Inventec's Revenue and Gross Profit Margin 2001-2008
Inventec's Core Technology
Inventec's Business Model
Bird's Equity Structure
Bird's Sales Volume, Sales Value and Average Selling Price, 2005-2008
Tianyu's Organizational Structure
如果这份报告不能满足您的要求,我们还可以为您定制报告,请 留言说明您的详细需求。
|