|
报告导航:研究报告—
生命科学—制药医疗
|
|
2009年中国医药连锁行业研究报告 |
 |
字数:2.4万 |
页数:68 |
图表数:65 |
|
中文电子版:5000元 |
中文纸版:2500元 |
中文(电子+纸)版:5500元 |
|
英文电子版:1700美元 |
英文纸版:1600美元 |
英文(电子+纸)版:2000美元 |
|
编号:ZHM005
|
发布日期:2009-10 |
附件:下载 |
 |
|
|
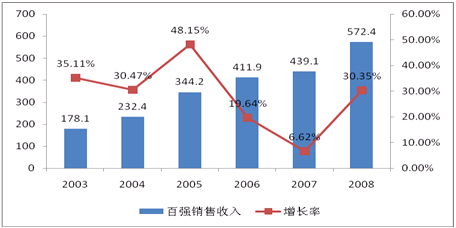
据2009年中国连锁药店排行榜显示,中国医药连锁行业销售额百强企业2008年的销售总额达到572.4亿元,相比2007年的439.1亿元增长133.3亿元,增长比例达30.35%。
图表:2003-2008年中国医药连锁行业销售额百强企业收入情况(单位:亿元)

整理:水清木华研究中心
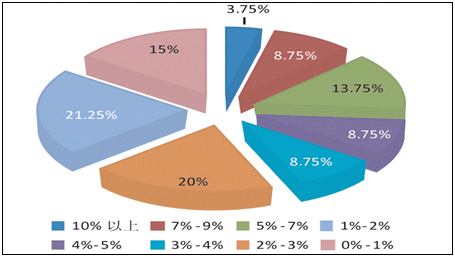
从盈利情况来看,2008年销售额百强企业的平均利润率为3.76%,超过2007年0.76个百分点。
图表:2008年中国医药连锁行业销售额百强企业利润率分布状况

整理:水清木华研究中心
《2009年中国医药连锁行业研究报告》的数据来源于根据中国医药商业协会、中国医药网、中国药店网、国家统计局等权威机构。该报告资料内容全面翔实,是深入了解医药连锁行业运行现状、把握行业发展前景、指导行业投融资决策的专业性研究报告。
本报告一共分为八章,数据图表达65幅,内容涵盖了中国医药连锁行业各主要方面与主要代表性企业。其中,第一章对中国医药连锁行业的发展状况进行了简要介绍;第二章分析了与中国医药连锁行业密切相关的宏观经济环境、行业环境与政策环境。第三、四、五章对中国医药连锁行业的运行状况、竞争格局与重点区域进行了深入分析,如市场规模、盈利状况、竞争格局、区域差异等;第六章分析了中国医药连锁行业的发展趋势;最后,在第七章对老百姓大药房、海王星辰、湖北同济堂、重庆桐君阁大药房、国药控股国大药房、重庆和平药房等10多家中国医药连锁行业的代表性企业进行了详细分析,重点介绍了企业发展动向、收入盈利状况与连锁布局情况等。
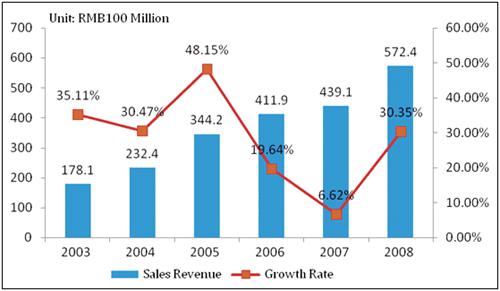
According to the chain drug stores ranking in China in 2009, top 100 enterprises in China pharmaceutical chain industry achieved the sales revenue of RMB57.24 billion in 2008, increasing by RMB13.33 billion (30.35%) than RMB43.91 billion in 2007.
Sales Revenue of Top 100 Enterprises in China Pharmaceutical Chain Industry, 2003-2008

Source: ResearchInChina
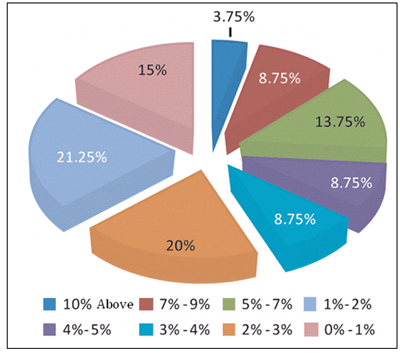
In 2008, the average profit margin of top 100 enterprises was 3.76%, more 0.76 points than that in 2007
Profit Margin of Top 100 Enterprises in China Pharmaceutical Chain Industry, 2008

Source: ResearchInChina
The data of this report come from China Association of Pharmaceutical Commerce, www.pharmnet.com.cn, www.ydzz.com and the National Bureau of Statistics of China. The report makes an in-depth analysis of the operation and future development of pharmaceutical chain industry, guiding investment and financing decision-making.
This report includes 8 chapters and 65 diagrams, covering all major aspects and key enterprises in China pharmaceutical chain industry. Chapter 1 introduces the development of China pharmaceutical chain industry briefly. Chapter 2 analyzes the macroeconomic environment, industry environment and policies related with China pharmaceutical chain industry. Chapter 3, 4, 5 analyze operation, competition patterns and key areas of China pharmaceutical chain industry, such as market scale, profitability, competition patterns and regional difference. Chapter 6 analyzes the development trends of China pharmaceutical chain industry. Finally, Chapter 7 analyzes the development, revenue distribution and profitability of over 10 key Chinese pharmaceutical enterprises, including LBX Pharmacy, Nepstar, Hubei Tongjitang, Chongqing Tongjunge Pharmacy, Sinopharm Group Co., Ltd., Chongqing Peace Drugstore.
第一章 中国医药连锁行业发展概况
1.1 中国医药连锁行业发展迅猛
1.2 中国医药连锁行业的连锁模式
1.1.1 直营
1.1.2 加盟
1.1.3 两种连锁模式的优劣
1.3 中国医药连锁行业存在的问题
第二章 中国医药连锁行业运行环境分析
2.1 宏观经济环境
2.2 行业环境
2.3 政策环境
2.3.1 新医改在短期给医药连锁行业带来挑战
2.3.2 新医改在长期将给医药连锁行业带来机遇
2.3.3 新医改有望推进“医药分开”
第三章 中国医药连锁行业运行状况分析
3.1 行业主要指标分析
3.1.1 市场规模
3.1.2 盈利状况
3.1.3 坪效与人效
3.1.4 其它指标
3.2 消费结构分析
3.3 药品价格走势分析
3.4 行业扩张情况分析
3.5 经营业态分析
第四章 中国医药连锁行业竞争状况分析
4.1 市场集中度
4.2 行业竞争格局分析
4.3 主要竞争企业比较
4.3.1 总体规模比较
4.3.2 经济效益比较
第五章 中国医药连锁行业重点区域分析
5.1 北京
5.2 上海
5.3 广东
5.4 江苏
5.5 湖南
5.6 辽宁
5.7 其它部分地区
第六章 中国医药连锁行业发展趋势
6.1 市场趋势
6.2 消费结构发展趋势
6.3 药品价格趋势
6.4 竞争趋势
6.5 药店经营趋势
6.5.1 药店经营走进营销时代
6.5.2 传统药店转型
6.5.3 中小药店形成联盟
6.5.4 直营店回归
6.5.5 资本运作将成行业整合主要手段
6.6 重点关注领域
6.6.1 OTC药品市场
6.6.2 医保药品
6.6.3 药妆店
第七章 中国医药连锁行业重点企业分析
7.1 老百姓大药房
7.1.1 公司概述
7.1.2 收入状况
7.1.3 连锁药店布局情况
7.2 海王星辰
7.2.1 公司概述
7.2.2 收入状况
7.2.3 连锁药店布局情况
7.3 湖北同济堂
7.3.1 公司概述
7.3.2 收入状况
7.3.3 连锁药店布局情况
7.4 重庆桐君阁大药房
7.4.1 公司概述
7.4.2 收入状况
7.4.3 连锁药店布局情况
7.5 国药控股国大药房
7.5.1 公司概述
7.5.2 收入状况
7.5.3 连锁药店布局情况
7.6 辽宁成大方圆
7.6.1 公司概述
7.6.2 收入状况
7.6.3 连锁药店布局情况
7.7 重庆和平药房
7.7.1 公司概述
7.7.2 收入状况
7.7.3 连锁药店布局情况
7.8 广东大参林
7.8.1 公司概述
7.8.2 收入状况
7.8.3 连锁药店布局情况
7.9 云南鸿翔药业有限公司(一心堂)
7.9.1 公司概述
7.9.2 收入状况
7.9.3 连锁药店布局情况
7.10 北京金象大药房
7.10.1 公司概述
7.10.2 收入状况
7.10.3 连锁药店布局情况
7.11 同仁堂
7.12 贵州一树
7.13 美信(Medicine Shoppe)
1 Overview of China Pharmaceutical Chain Industry
1.1 Rapid Development
1.2 Models of Chain Operation
1.1.1 Regular Chain
1.1.2 Franchise
1.1.3 Comparison
1.3 Problems
2 Environment for China Pharmaceutical Chain Industry
2.1 Macro-economy
2.2 Industry
2.3 Policy
2.3.1 Challenges Brought by New Medical Reform in the Short Term
2.3.2 Opportunities Brought by New Medical Reform in the Long Run
2.3.3 New Medical Reform is Expected to Promote "the Separation of Hospitals and Medicine
3 Operation of China Pharmaceutical Chain Industry
3.1 Key Indicators
3.1.1 Market Scale
3.1.2 Profit
3.1.3 Efficiency
3.1.4 Other Indicators
3.2 Consumption Structure
3.3 Trend of Drug Prices
3.4 Industry Expansion
3.5 Operation Formats
4 Competition in China Pharmaceutical Chain Industry
4.1 Market Concentration
4.2 Competition Pattern
4.3 Comparison of Major Enterprises
4.3.1 Overall Scale
4.3.2 Economic Benefits
5 Key Areas of China Pharmaceutical Chain Industry
5.1 Beijing
5.2 Shanghai
5.3 Guangdong
5.4 Jiangsu
5.5 Hunan
5.6 Liaoning
5.7 Others
6 Development Trends of China Pharmaceutical Chain Industry
6.1 Market Trends
6.2 Consumption Structure
6.3 Drug Prices
6.4 Competition
6.5 Operation of Pharmacies
6.5.1 Drugstores in Marketing Era
6.5.2 Transformation of Traditional Pharmacies
6.5.3 Alliances of Small and Medium Pharmacies
6.5.4 Return of Direct Chains
6.5.5 Capital will become the Primary Means for Industry Consolidation
6.6 Key Fields
6.6.1 OTC Drug Market
6.6.2 Medicare Drugs
6.6.3 Cosmeceutical Stores
7 Key Enterprises in China Pharmaceutical Chain Industry
7.1 LBX Pharmacy
7.1.1 Profile
7.1.2 Revenue
7.1.3 Distribution of Chain Drugstores
7.2 Nepstar
7.2.1 Profile
7.2.2 Revenue
7.2.3 Distribution of Chain Drugstores
7.3 Hubei Tongjitang
7.3.1 Profile
7.3.2 Revenue
7.3.3 Distribution of Chain Drugstores
7.4 Chongqing Tongjunge Pharmacy
7.4.1 Profile
7.4.2 Revenue
7.4.3 Distribution of Chain Drugstores
7.5 Sinopharm Group Co., Ltd.
7.5.1 Profile
7.5.2 Revenue
7.5.3 Distribution of Chain Drugstores
7.6 Liaoning CDFY
7.6.1 Profile
7.6.2 Revenue
7.6.3 Distribution of Chain Drugstores
7.7 Chongqing Peace Drugstore
7.7.1 Profile
7.7.2 Revenue
7.7.3 Distribution of Chain Drugstores
7.8 Guangdong Da Shen Lin
7.8.1 Profile
7.8.2 Revenue
7.8.3 Distribution of Chain Drugstores
7.9 Yunnan Hongxiang Yixintang
7.9.1 Profile
7.9.2 Revenue
7.9.3 Distribution of Chain Drugstores
7.10 Beijing Jinxiang Pharmacy
7.10.1 Profile
7.10.2 Revenue
7.10.3 Distribution of Chain Drugstores
7.11 Tong Ren Tang
7.12 Guizhou 1-Tree
7.13 Medicine Shoppe
图表:近几年来中国医药连锁行业百强企业销售收入变化情况(单位:万元)
图表:加盟与直营两种医药连锁经营模式的优劣比较
图表:2002-2008年中国国内生产总值(亿元)及其增长速度
图表:中国医药连锁行业销售收入与国内生产总值呈正向相关关系
图表:2009年1-5月医药制造业市场规模情况
图表:1990-2009年2月中国医药行业销售增长情况
图表:1990-2009年2月中国医药行业利润增长情况
图表:医改总体框架
图表:2008-2010年我国医药连锁行业销售额与增长预测(亿元)
图表:2003-2008年中国医药连锁行业销售额百强企业收入情况(单位:亿元)
图表:2008年中国医药连锁行业销售额排行前十强企业
图表:2008年中国医药连锁行业销售额百强企业利润率分布状况
图表:2008年中国医药连锁行业利润率排行前十强企业
图表:2008年中国医药连锁行业销售额百强企业坪效分布状况
图表:2008年中国医药连锁行业坪效排行前十强企业
图表:2008年中国医药连锁行业销售额百强企业人效分布状况
图表:2008年中国医药连锁行业人效排行前十强企业
图表:2007-2008年中国医药连锁行业销售额百强企业平均指标变化情况
图表:2008年1-3季度药品零售市场药品结构(按销售额)
图表:2003-2009年8月中国药品零售价格指数走势
图表:2004-2008年中国医药连锁行业销售额百强企业总店数(单位:家)
图表:2008年中国医药连锁行业店数排行前十强企业
图表:中国医药连锁企业的经营业态情况
图表:2006-2008年中国医药连锁行业市场集中度情况
图表:连续5年进入销售20强的医药连锁企业
图表:2008年中国医药连锁行业增长最快的10家企业
图表:2008年中国医药连锁行业销售额排行榜(5亿元以上)
图表:2008年中国连锁药店加盟店数量排行(前20)
图表:2008年中国医药连锁行业单店销售额排行榜
图表:2008年医药连锁行业国营与民营两大阵营经济效益比较
图表:2008年北京市主要医药连锁企业销售额
图表:2008年上海市主要医药连锁企业销售额
图表:2008年广东省主要医药连锁企业销售额
图表:2008年江苏省主要医药连锁企业销售额
图表:2008年湖南省主要医药连锁企业本地销售额
图表:2008年辽宁省主要医药连锁企业销售额
图表:2008年湖北省主要医药连锁企业销售额
图表:2008年云南省主要医药连锁企业销售额
图表:2008年重庆市主要医药连锁企业销售额
图表:医药终端市场改革示意图
图表:中国医药零售市场销售额预测(2008-2010年)
图表:2007-2008年药品零售市场各类药品比重构成情况(按销售额)
图表:2007-2008年零售市场药品结构变动趋势(按销售额)
图表:2008年药品零售市场销售规模最大的前10种感冒药品种(百万元)
图表:2003-2008年老百姓大药房收入变动趋势
图表:2008年老百姓药店地域分布
图表:2003-2008年海王星辰收入变动趋势
图表:2003-2008年海王星辰药店数量及其扩张速度
图表:2003-2008年湖北同济堂收入变动趋势
图表:2003-2008年湖北同济堂药店扩张情况
图表:2003-2008年重庆桐君阁大药房收入变动趋势
图表:2003-2008年重庆桐君阁药店扩张情况
图表:2003-2008年国大药房收入变动趋势
图表:2003-2008年国大药房药店扩张情况
图表:2003-2008年辽宁成大方圆收入变动趋势
图表:2002-2008年海王星辰药店数量及其扩张速度
图表:2003-2008年重庆和平药房收入变动趋势
图表:2003-2008年重庆和平药房药店扩张情况
图表:2003-2008年广东大参林收入变动趋势
图表:2003-2008年广东大参林药店扩张情况
图表:2003-2008年云南鸿翔一心堂收入变动趋势
图表:截至2009年6月底云南鸿翔一心堂药店分布情况
图表:2003-2008年北京金象大药房收入变动趋势
图表:2004-2008年北京金象大药房药店扩张情况
图表:Medicine Shoppe在中国的药店分布情况
Sales Revenue of Top 100 Enterprises in China Pharmaceutical Chain Industry in Recent Years
Comparison between Franchise and Direct Marketing
GDP and Its Growth Rate in China, 2002-2008
Positive Correlation between GDP and Sales Revenue of China Pharmaceutical Chain Industry
Market Scale of Pharmaceutical Manufacturing, Jan-May 2009
Sales Growth Rate of China Pharmaceutical Industry, 1990-Feb 2009
Profit Growth Rate of China Pharmaceutical Industry, 1990- Feb 2009
Overall Framework of Health Care Reform
Forecast for Sales Revenue and Growth Rate of China Pharmaceutical Chain Industry, 2008-2010
Sales Revenue of Top 100 Enterprises in China Pharmaceutical Chain Industry, 2003-2008
Top 10 Enterprises in China Pharmaceutical Chain Industry by Sales Revenue, 2008
Profit Margin of Top 100 Enterprises in China Pharmaceutical Chain Industry, 2008
Top 10 Enterprises in China Pharmaceutical Chain Industry by Profit Margin, 2008
Area Efficiency of Top 100 Enterprises (by Sales Revenue) in China Pharmaceutical Chain Industry, 2008
Top 10 Enterprises in China Pharmaceutical Chain Industry by Area Efficiency, 2008
Salesperson Efficiency of Top 100 Enterprises (by Sales Revenue) in China Pharmaceutical Chain Industry, 2008
Top 10 Enterprises in China Pharmaceutical Chain Industry by Salesperson Efficiency, 2008
Average indicators of Top 100 Enterprises (by Sales Revenue) in China Pharmaceutical Chain Industry, 2007-2008
Drug Structure of Retail Pharmaceutical Market by Sales Revenue, Q1-Q3 2008
Retail Prices of Drugs in China, 2003-Aug 2009
Total Number of Drugstores of Top 100 Enterprises (by Sales Revenue) in China Pharmaceutical Chain Industry, 2004-2008
Top 10 Chinese Pharmaceutical Chain Enterprises by Number of Drugstores, 2008
Operation Formats of Chinese Pharmaceutical Chain Enterprises
Market Concentration of China Pharmaceutical Chain Industry, 2006-2008
Pharmaceutical Chain Enterprises That have been Top 20 in Successive 5 Years by Sales Revenue
Top 10 Enterprises in China Pharmaceutical Chain Industry by Growth Rate, 2008
Sales Revenue Ranking in China Pharmaceutical Chain Industry, 2008
Top 20 Chinese Chain Drugstores by Number of Franchises, 2008
Sales Revenue Ranking in China Pharmaceutical Chain Industry by Single Drugstore, 2008
Profit Comparison between State-owned and Private enterprises in China Pharmaceutical Chain Industry, 2008
Sales Revenue of Major Pharmaceutical Chain Enterprises in Beijing, 2008
Sales Revenue of Major Pharmaceutical Chain Enterprises in Shanghai, 2008
Sales Revenue of Major Pharmaceutical Chain Enterprises in Guangdong, 2008
Sales Revenue of Major Pharmaceutical Chain Enterprises in Jiangsu, 2008
Sales Revenue of Major Pharmaceutical Chain Enterprises in Hunan, 2008
Sales Revenue of Major Pharmaceutical Chain Enterprises in Liaoning, 2008
Sales Revenue of Major Pharmaceutical Chain Enterprises in Hubei, 2008
Sales Revenue of Major Pharmaceutical Chain Enterprises in Yunan, 2008
Sales Revenue of Major Pharmaceutical Chain Enterprises in Chongqing, 2008
Terminal Pharmaceutical Market Reforms
Forecast for Sales Revenue of China Retail Pharmaceutical Market, 2008-2010
Shares of Drugs in Retail Pharmaceutical Market by Sales Revenue, 2007-2008
Drug Structure of Retail Pharmaceutical Market by Sales Revenue, 2007-2008
Top 10 Best-sold Cold Medicines in Retail Pharmaceutical Market, 2008
Revenue of LBX Pharmacy, 2003-2008
Geographical Distribution of LBX Pharmacy’s Drugstores, 2008
Revenue of Nepstar, 2003-2008
Number and Expansion Rate of Nepstar’s Drugstores, 2003-2008
Revenue of Hubei Tongjitang, 2003-2008
Expansion Rate of Hubei Tongjitang’s Drugstores, 2003-2008
Revenue of Chongqing Tongjunge Pharmacy, 2003-2008
Expansion Rate of Chongqing Tongjunge Pharmacy’s Drugstores, 2003-2008
Revenue of Sinopharm Group Co., Ltd., 2003-2008
Expansion Rate of Sinopharm Group Co., Ltd’s Drugstores, 2003-2008
Revenue of Liaoning CDFY, 2003-2008
Number and Expansion Rate of Nepstar’s Drugstores, 2002-2008
Revenue of Chongqing Peace Drugstore, 2003-2008
Expansion Rate of Chongqing Peace Drugstore’s Drugstores, 2003-2008
Revenue of Guangdong Da Shen Lin, 2003-2008
Expansion Rate of Guangdong Da Shen Lin, 2003-2008
Revenue of Yunnan Hongxiang Yixintang, 2003-2008
Distribution of Yunnan Hongxiang Yixintang’s Drugstores, by the End of Jun 2009
Revenue of Beijing Jinxiang Pharmacy, 2003-2008
Expansion Rate of Beijing Jinxiang Pharmacy’s Drugstores, 2004-2008
Geographical Distribution of Medicine Shoppe’s Drugstores in China
如果这份报告不能满足您的要求,我们还可以为您定制报告,请 留言说明您的详细需求。
|