|
报告导航:研究报告—
制造业—能源矿产
|
|
2009年中国氧化铝行业研究报告 |
 |
字数:3.4万 |
页数:69 |
图表数:29 |
|
中文电子版:5000元 |
中文纸版:2500元 |
中文(电子+纸)版:5500元 |
|
英文电子版:1800美元 |
英文纸版:1700美元 |
英文(电子+纸)版:2100美元 |
|
编号:YSJ003
|
发布日期:2009-10 |
附件:无 |
 |
|
|
目前世界上主要生产氧化铝的地区有亚洲、大洋洲、拉丁美洲和欧洲。从2005年开始,亚洲成为每年氧化铝产量最高的地区。2009年,亚洲氧化铝产量占全球氧化铝产量的36.9%。亚洲氧化铝市场中,中国所占份额最大。2009年前两季度,中国氧化铝产量占据亚洲氧化铝总产量77.99%的份额。
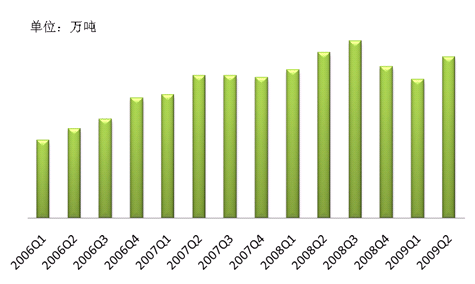
中国氧化铝行业的快速增长是从2005年开始的,2005年新增氧化铝产能184.44万吨,随着氧化铝新增产能陆续投产,2006年氧化铝产量开始大幅上升。2006年第一季度到2008年第三季度,由于氧化铝项目的集中投产,中国氧化铝产量持续上升,从2006年第一季度的277万吨,持续上升到2008年第三季度的629万吨。2008年第四季度,由于经济的衰退,氧化铝需求减少,产量也迅速下滑,下滑趋势一直持续到2009年第一季度。2009年第二季度,由于中国经济的好转,氧化铝产量上升至570万吨,环比增长16.1%,2009年第二季度的单季度产量水平将要赶超2008年第三季度的629万吨这一历史最高水平。因此,氧化铝行业的后劲仍然可观。
图:2006-2009年各季度氧化铝产量变化

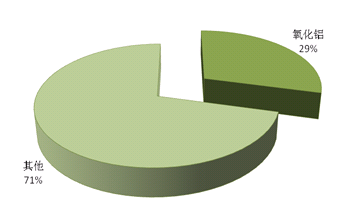
中国铝业股份有限公司为全球第二大氧化铝生产商、也是中国规模最大的氧化铝和原铝运营商,公司氧化铝产量稳居世界第二位,仅次于美铝。2009年1-6月份,中国铝业的氧化铝产量320万吨,比2008年上半年减少31.6%。2009年上半年中国铝业的主营业务中,氧化铝占据29%的份额,份额有所下降,并亏损14.4亿元。但氧化铝作为中国铝业的一大主营业务,在中国氧化铝产业中占据着举足轻重的地位,又加上中国铝业生产氧化铝所需铝土矿均来自自有矿山的开采,比国内其他企业更具有成本优势。2009年8月,中国铝业的氧化铝开工率上升,亏损情况有望于2009年底扭转。
图:2009年中国铝业氧化铝所占份额

本报告重点从氧化铝行业的外部环境、国家政策、相关行业等几个方面对氧化铝行业作了深入研究。并选取了包括中国铝业股份有限公司、云南铝业股份有限公司、南山铝业股份有限公司等16家拥有氧化铝业务的企业,对这些企业在近年来,尤其是2009年的发展情况、公司动向以及战略规划作了详尽的描述。旨在通过对氧化铝行业现状的研究,摸清行业发展的脉络,掌握市场的未来变化趋势。
Currently, alumina is mainly produced in Asia, Oceania, Latin America and Europe. Since 2005, the output of alumina in Asia has ranked first in the world. In 2009, the output of alumina in Asia accounted for 36.9% of global alumina output. China has the most shares in Asian alumina market. In the first two quarters of 2009, the alumina produced by China accounted for 77.99% of Asian alumina output.
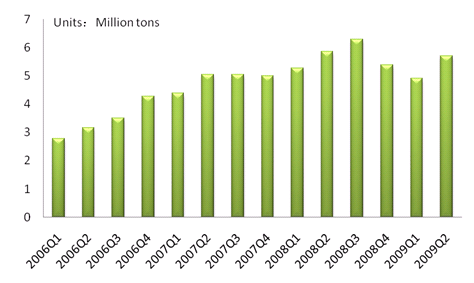
China alumina industry has developed rapidly since 2005. In 2005, the output of alumina increasd by 1.8444 million tons. As the new capacity of alumina was gradually put into operation, alumina output began to increase significantly in 2006. During the first quarter of 2006 to the third quarter of 2008, due to the concentration of alumina projects, China's alumina output continued to rise, increasing from 2.77 million tons in the first quarter of 2006 to 6.29 million tons in the third quarter of 2008. In the fourth quarter of 2008, the economic recession made the demand for alumina reduce and the output decline rapidly. The falling tendency lasted until the first quarter of 2009. Within the second quarter of 2009, China's economy recovered, and the alumina output increased to 5.7 million tons, up 16.1% quarter-on-quarter. The output in the second quarter of 2009 exceeded 6.29 million tons (the highest on record) of the third quarter of 2008. Therefore, alumina industry is promising.
Quarterly Alumina Output, 2006-2009

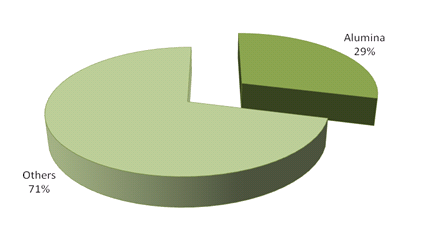
Aluminum Corporation of China (CHALCO) is the world’s second largest alumina producer and China’s largest alumina and primary aluminum operator. CHALCO is only second to Alcoa in alumina output. During January to June of 2009, CHALCO's alumina output reached 3.2 million tons, decreasing by 31.6% from the first half of 2008. In the first half of 2009, alumina business accounted for 29% of CHALCO's main business, but the proportion declined with a loss of RMB1.44 billion. However, as the most important business of CHALCO, alumina business occupies a pivotal position in China alumina industry. Additionally, CHALCO makes use of bauxite from its own mines to produce alumina, so it has more advantages in cost than other domestic companies. In August 2009, the operating rate of CHALCO's alumina capacity rose. It is expected the deficit will turn the tables by the end of 2009.
Proportion of Alumina in CHALCO, 2009

The report makes an in-depth study of alumina industry in terms of external environment, national policies, related industries, and other aspects. The report also makes a detailed description on the development, trends as well as strategic planning of 16 enterprises that have alumina business, including Aluminum Corporation of China, Yunnan Aluminum Co., Ltd., Nanshan Aluminum Co., Ltd. The report aims at finding out the development process of the industry and grasping the future market trends through analyzing the status quo of alumina industry.
第一章 全球氧化铝概述
1.1 氧化铝介绍
1.1.1 氧化铝定义
1.1.2 氧化铝的特点与用途
1.1.3 氧化铝行业的经济特性
1.2 全球氧化铝行业发展现状
1.2.1 全球氧化铝生产情况
1.2.2 各大洲氧化铝生产情况
1.3 全球氧化铝工业发展趋势
第二章 中国宏观经济对氧化铝行业的影响
2.1 GDP与氧化铝
2.2 固定资产投资与氧化铝
2.3 工业总产值与氧化铝
第三章 中国氧化铝行业发展政策
3.1 氧化铝行业政策变化
3.2 氧化铝进出口政策
3.3 《铝行业准入条件》
3.4 《铝工业发展专项规划》与《铝工业产业发展政策》
第四章 中国氧化铝行业发展现状
4.1 中国氧化铝行业概况
4.2 中国氧化铝行业发展现状
4.2.1 氧化铝生产情况
4.2.2 氧化铝进口情况
4.2.3 氧化铝地区分布情况
4.3 中国氧化铝行业发展趋势
第五章 氧化铝行业地区发展比较
5.1 华北地区
5.1.1 发展现状
5.1.2 竞争优势
5.1.3 前景展望
5.2 华东地区
5.2.1 发展现状
5.2.2 竞争优势
5.2.3 前景展望
5.3 华南地区
5.3.1 发展现状
5.3.2 竞争优势
5.3.3 前景展望
5.4 西南地区
5.4.1 发展现状
5.4.2 竞争优势
5.4.3 前景展望
5.5 西北地区
5.5.1 发展现状
5.5.2 竞争优势
5.5.3 前景展望
第六章 氧化铝相关行业分析
6.1 铝土矿
6.1.1 行业现状
6.1.2 发展前景
6.2 烧碱
6.2.1 行业现状
6.2.2 发展前景
6.3 电解铝
6.3.1 行业现状
6.3.2 发展前景
6.4 煤碳
6.4.1 行业现状
6.4.2 发展前景
第七章 重点氧化铝企业分析
7.1 中国铝业股份有限公司
7.1.1 企业基本概况
7.1.2 企业运营状况
7.1.3 公司动向
7.2 云南铝业股份有限公司
7.2.1 企业基本概况
7.2.2 企业运营状况
7.2.3 公司动向
7.3 山东南山铝业股份有限公司
7.3.1 企业基本概况
7.3.2 企业运营状况
7.3.3 公司动向
7.4 山东魏桥铝电有限公司
7.4.1 企业基本概况
7.4.2 企业运营状况
7.4.3 公司动向
7.5 山西鲁能晋北铝业有限责任公司
7.5.1 企业基本概况
7.5.2 企业运营状况
7.5.3 公司动向
7.6 山东信发铝电集团
7.6.1 企业基本概况
7.6.2 企业运营状况
7.6.3 公司动向
7.7 重庆市博赛矿业(集团)有限公司
7.7.1 企业基本概况
7.7.2 企业运营状况
7.7.3 公司动向
7.8 山西中达铝业有限公司
7.8.1 企业基本概况
7.8.2 企业运营状况
7.9 包头铝业(集团)有限责任公司
7.9.1 企业基本概况
7.9.2 企业战略规划
7.9.3 公司动向
7.10 平顶山市汇源化学工业公司
7.10.1 企业基本概况
7.10.2 企业运营状况
7.11 其他企业
7.11.1 开曼铝业(三门峡)有限公司
7.11.2 洛阳香江万基铝业有限公司
7.11.3 义翔铝业有限公司
7.11.4 龙口东海氧化铝有限公司
7.11.5 广西华银铝业有限公司
7.11.6 贵州凯晟铝业有限公司
第八章 氧化铝行业发展机会与风险分析
8.1 氧化铝上下游行业分析
8.1.1 铝土矿行业供应分析
8.1.2 电解铝行业需求分析
8.2 氧化铝行业发展机会综述
8.2.1 中国氧化铝行业发展周期分析
8.2.2 氧化铝市场价格现状
8.2.3 氧化铝价格影响因素分析
8.3 氧化铝行业“波特五力模型”分析
8.3.1 现有企业间竞争
8.3.2 潜在进入者分析
8.3.3 替代品威胁分析
8.3.4 供应商议价能力
8.3.5 客户议价能力
8.4 氧化铝行业投资风险分析
8.4.1 原材料价格波动的风险
8.4.2 市场风险
8.4.3 政策风险
8.4.4 经营风险
1 Overview of Global Alumina
1.1 Introduction
1.1.1 Definition
1.1.2 Characteristics and Usage
1.1.3 Economic Characteristics
1.2 Status Quo of Global Alumina Industry
1.2.1 Production in the World
1.2.2 Production by Continent
1.3 Development Trends
2 Macroeconomy And Alumina Industry in China
2.1 GDP and Alumina
2.2 Fixed-asset Investment and Alumina
2.3 Gross Industrial Output Value and Alumina
3 China's Alumina Industry Policies
3.1 Policies
3.2 Import and Export Policies
3.3 Qualifications for Access to Aluminum Industry
3.4 Aluminum Industry Development Plan and Aluminum Industry Development Policy
4 Status Quo of China Alumina Industry
4.1 Overview
4.2 Status Quo
4.2.1 Production
4.2.2 Import
4.2.3 Geographical distribution
4.3 Development Trends
5 Alumina Industry Development by Region
5.1 North China
5.1.1 Status Quo
5.1.2 Competitive Advantages
5.1.3 Prospect
5.2 East China
5.2.1 Status Quo
5.2.2 Competitive Advantages
5.2.3 Prospect
5.3 South China
5.3.1 Status Quo
5.3.2 Competitive Advantages
5.3.3 Prospect
5.4 Southwest China
5.4.1 Status Quo
5.4.2 Competitive Advantages
5.4.3 Prospect
5.5 Northwest China
5.5.1 Status Quo
5.5.2 Competitive Advantages
5.5.3 Prospect
6 Related Industries
6.1 Bauxite
6.1.1 Status Quo
6.1.2 Prospect
6.2 Caustic Soda
6.2.1 Status Quo
6.2.2 Prospect
6.3 Electrolytic Aluminum
6.3.1 Status Quo
6.3.2 Prospect
6.4 Coal
6.4.1 Status Quo
6.4.2 Prospect
7 Key Alumina Enterprises
7.1 Aluminum Corporation of China Limited
7.1.1 Profile
7.1.2 Operation
7.1.3 Trends
7.2 Yunnan Aluminum Co., Ltd.
7.2.1 Profile
7.2.2 Operation
7.2.3 Trends
7.3 Shandong Nanshan Aluminum Co., Ltd.
7.3.1 Profile
7.3.2 Operation
7.3.3 Trends
7.4 Shandong Weiqiao Aluminum and Electricity Co., Ltd.
7.4.1 Profile
7.4.2 Operation
7.4.3 Trends
7.5 Shanxi Luneng Jinbei Aluminum Industry Co., Ltd.
7.5.1 Profile
7.5.2 Operation
7.5.3 Trends
7.6 Shandong Xinfa Aluminum and Electricity Group
7.6.1 Profile
7.6.2 Operation
7.6.3 Trends
7.7 Chongqing Bosai Minerals Group Co., Ltd.
7.7.1 Profile
7.7.2 Operation
7.7.3 Trends
7.8 Shanxi ZhongDa Corporation
7.8.1 Profile
7.8.2 Operation
7.9 Baotou Aluminum (Group) Co., Ltd.
7.9.1 Profile
7.9.2 Strategic Planning
7.9.3 Trends
7.10 Pingdingshan Huiyuan Chemical Industry Company
7.10.1 Profile
7.10.2 Operation
7.11 Other Enterprises
7.11.1 Coalmine Aluminium(Sanmenxia)Company Limited
7.11.2 Luoyang Xiangjiang Wanji Aluminum Co., Ltd.
7.11.3 Yixiang Aluminum Co., Ltd.
7.11.4 Longkou Donghai Alumina Co., Ltd.
7.11.5 Guangxi Huayin Aluminum Co., Ltd.
7.11.6 Guizhou KaiSheng Aluminum Co., Ltd.
8 Development Opportunities and Risks
8.1 Upstream and Downstream Industries
8.1.1 Supply in Bauxite Industry
8.1.2 Demand in Electrolytic Aluminum Industry
8.2 Development Opportunities
8.2.1Development Cycle
8.2.2 Market Price
8.2.3 Influencing Factors
8.3 Michael Porter's Five Forces Model
8.3.1 Competition Among Existing Enterprises
8.3.2 Potential Entrants
8.3.3 Threat from Substitutes
8.3.4 Bargaining Power of Suppliers
8.3.5 Bargaining Power of Clients
8.4 Investment Risks
8.4.1 Risk of Raw Material Prices Fluctuation
8.4.2 Market Risk
8.4.3 Policy Risk
8.4.4 Operational Risk
图:2005-2009年全球氧化铝产量变化趋势
图:2005-2009年全球氧化铝各等级产量
图:2005-2009年全球各大洲氧化铝产量
图:2001-2008中国经济增长率与氧化铝产量增长率对比图
图:2001-2008年中国固定资产投资增长率与氧化铝产量增长率对比图
图:2001-2008年中国工业总产值增长率与氧化铝产量增长率对比图
图:2001-2008年中国氧化铝新增产能统计
图:2005-2009年中国氧化铝产量变化趋势
图:2006-2009年各季度氧化铝产量变化
图:2005-2009年中国氧化铝分等级产量统计
图:2009年中国氧化铝进口数量及价格统计
图:2009年5月中国各省份氧化铝进口情况
表:中国铝土矿资源地区分布
图:中国氧化铝成本构成
图:2009年中国烧碱进口数量
图:2003-2007年全球电解铝产量
图:2001-2008年中国电解铝新增产能统计
图:中国铝业股份有限公司股权结构
图:2005-2009年中国铝业业务收入及利润
表:2009年中国铝业财务状况
图:2005-2009年云南铝业业务收入及利润
表:2009年云南铝业财务状况
表:2009年云南铝业销售收入构成
图:2005-2009年南山铝业业务收入及利润
表:2009年南山铝业财务状况
图:2000-2008年博赛集团销售收入
图:中达铝业产品销售分布图
图:2006-2010年中国氧化铝价格变化
表:中国氧化铝价格影响因素
Global Output of Alumina, 2005-2009
Global Output of Alumina by Grade,2005-2009
Global Output of Alumina by Continent, 2005-2009
China Economic Growth Rate and Alumina Output Growth Rate, 2001-2008
China Fixed Asset Investment Growth Rate and Alumina Output Growth Rate, 2001-2008
China Industrial Output Growth Rate and Alumina Output Growth Rate, 2001-2008
Increased Production Capacity of Alumina in China, 2001-2008
China's Output of Alumina, 2005-2009
Quarterly Output of Alumina, 2006-2009
China’s Output of Alumina by Grade, 2005-2009
Import Volume and Price of Alumina in China, 2009
Import of Alumina in China by Province, May 2009
Geographical Distribution of Bauxite Resources in China
Cost Structure of Alumina in China
Import Volume of Caustic Soda in China, 2009
Global Output of Electrolytic Aluminum, 2003-2007
Increased Production Capacity of Electrolytic Aluminum in China, 2001-2008
Equity Structure of CHALCO
Business Revenue and Profit of CHALCO, 2005-2009
Financial Data of CHALCO, 2009
Business Revenue and Profit of Yunnan Aluminum, 2005-2009
Financial Data of Yunnan Aluminum, 2009
Sales Revenue Structure of Yunnan Aluminum, 2009
Business Revenue and Profit of Nanshan Aluminum, 2005-2009
Financial Data of Nanshan Aluminum, 2009
Sales Revenue of Chongqing Bosai Minerals Group Co., Ltd., 2000-2008
Marketing of Shanxi ZhongDa Corporation
Alumina Prices in China, 2006-2010
Influential Factors on Alumina Prices in China
如果这份报告不能满足您的要求,我们还可以为您定制报告,请 留言说明您的详细需求。
|