|
|
|
报告导航:研究报告—
TMT产业—电信
|
|
2009年网络通信设备行业研究报告 |
 |
字数:6.1万 |
页数:238 |
图表数:170 |
|
中文电子版:10000元 |
中文纸版:5000元 |
中文(电子+纸)版:10500元 |
|
英文电子版:2900美元 |
英文纸版:2700美元 |
英文(电子+纸)版:3200美元 |
|
编号:ZYW023
|
发布日期:2010-01 |
附件:下载 |
 |
|
|
网络通信设备可以分为局端设备(COE)和客户端设备(CPE),本报告重点研究客户端设备和上游芯片组(Chipset)。
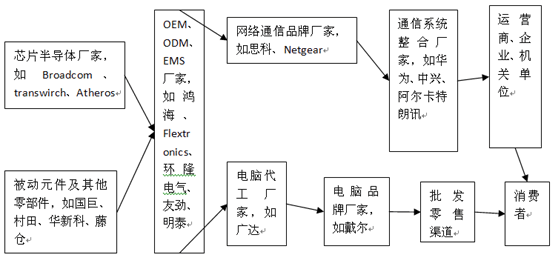
网络通信设备产业链

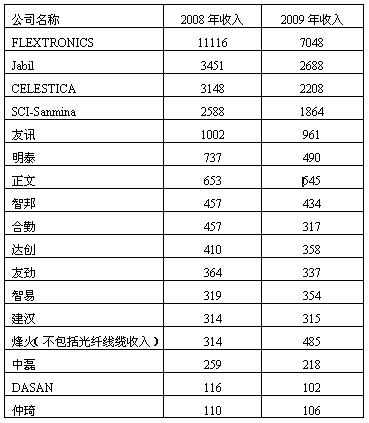
网络通信的产业链比较长,其客户有很大一部分是运营商、行政机关和大企业。这些单位在经济下滑时期,仍然有比较宽裕的预算,尤其中国政府在加大支出。同时因经济不景气,人们减少户外活动,家庭娱乐活动增加,而网络通信是家庭娱乐活动的基础,这使得网络通信产业具备强大的抗跌能力。厂家为了应对经济危机,都采取了削减成本的措施,大公司削减成本的潜力很大,在2009年大部分公司的运营利润率都比2008年要高0.2-1%左右。这些大公司的运营利润率通常都低于10%,能提高0.2-1%是非常大幅度的。
欧美企业专注于局端设备,其市场规模大,利润稍低。台湾企业专注于客户端设备,市场规模小,利润稍高。2009年, 台湾的Cable Modem全球市场占有率超过90%,WLAN NIC市场占有率为90%。DSL客户端市场占有率为79%,VoIP路由器市场占有率77%,IP电话市场占有率75%,IP机顶盒市场占有率超过50%,WiMAX客户端设备超过50%,WLAN路由器市场占有率超过85%。

目前网络通信最火热的领域有WiMAX、Femtocell、FTTx、802.11n、VDSL和IP机顶盒。这些领域的上游芯片产业竞争激烈,每设计一款ASIC芯片的成本在500-1500万美元之间,如果出现失误,风险非常大,如果成功,利润将很丰厚。因此每一个芯片公司背后都有5-15家风险投资公司在支持。
WiMAX领域,英特尔独大的局面被打破,Beceem、GCT、Sequans、富士通都进入该领域,Beceem发展迅速,显现出龙头迹象。NPU领域,英特尔一家独大,市场占有率为36%,LSI、Wintegra、Ezchip、AMCC四小强合计有44%的市场占有率。Femtocell市场暂未成熟,有PicoChip、高通和Percello三家争夺,PicoChip倾尽全力,志在必得。
竞争最激烈的是PON市场。在EPON领域,Cortina、Teknovus和PMC-Sierra三足鼎立。Cortina在2007年3月收购Immenstar进入此领域。PMC-SIERRA在2006年5月收购了以色列的Passave公司,以此获得了进军PON市场的机会,收购的价格达3亿美元。Teknovus强调技术领先,力推10G EPON。目前来看PMC-SIERRA发展实力最强。
在GPON领域,支持GPON的芯片厂商已有10家,包括Broadcom、BroadLight、Centillium、Conexant、PMC-Sierra、FreeScale、Cortina等,其中PMC-Sierra 、Cortina 同时支持GPON/EPON,单独支持EPON的仅有Teknovus以及Opulan。Centillium被Transwitch收购,Conexant包括PON的宽带接入业务在2009年4月被Ikanos 以5400万美元收购。Broadcom则刚刚进入此领域,BroadLight在此领域实力最强。
xDSL 领域,英飞凌、Broadcom和Ikanos三强作战,ADSL领域,Broadcom稳居霸主地位,VDSL领域,Ikanos市场占有率超过80%。WLAN领域,Broadcom、英特尔、Atheros、雷凌和Marvell五家瓜分市场,雷凌这家台湾企业2009年超过Marvell,位居第五。
Network communication equipment includes COE (Central Office Equipment) and CPE (Customer Premise Equipment). The report mainly targets CPE and upstream chipset.
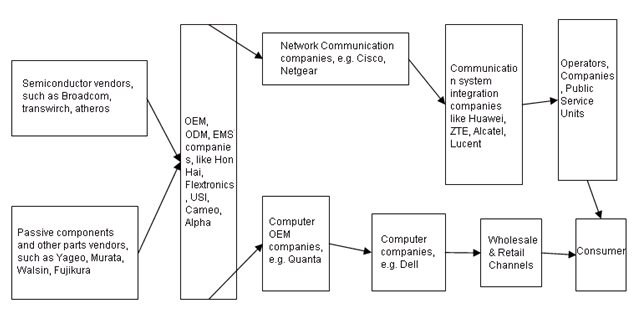
Network Communication Equipment Industry Chain

Source: ResearchInChina
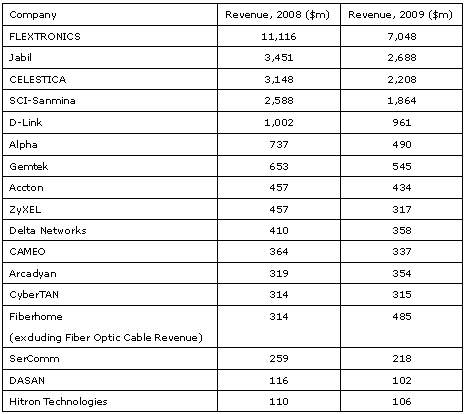
Network communication has a relatively long industry chain, with a big portion of its clients being operators, administrative organs and large companies. These units still have sufficient capital during economic downturn. In particular, Chinese government is enlarging its expenditure. The economic recession causes people to reduce outdoor activities and increase indoor recreational activities. As network communication is the basis of household recreation activities, the network communication industry has great anti-drop strength. Companies all carried cost reduction in order to overcome the difficulties incurred by the economic crisis. Big companies have large potential of cost reduction. Their operating profit margin in 2009 mostly is 0.2-1% higher than that in 2008, which is quite a lot since the operating profit margin of those big companies is in general lower than 10%.
European and American companies focus on COE, so they enjoy a large market scale but smaller profits; while Taiwan companies focus on CPE, with small market scale but higher profits. In 2009, Taiwan takes a global market share of over 90% in Cable Modem, 90% in WLAN NIC, 79% in DSL CPE, 77% in VoIP router, 75% in IP Phone, 50% more in IP STB, over 50% in WiMAX CPE, and over 85% in WLAN router.

At present, the booming sectors of network communication are WiMAX, Femtocell, FTTx, 802.11n, VDSL and IP STB, whose upstream chip industry is facing fierce competition. It costs USD$ 5-15 million to design one model of ASIC chip, which is highly risky if failed, but quite profitable if success is made. So each chip company is backed up by 5-15 venture capital companies.
In WiMAX, the monopoly of Intel has been broken up as Beceem, GCT, Sequans and Fujitsu all have entered this sector. Beceem has developed rapidly, showing the sign of becoming a leader. Intel still leads the NPU sectors, with 36% market shares, while LSI, Wintegra, Ezchip and AMCC accumulatively take 44%. The Femtocell market is still immature, where PicoChip, Qualcomm and Percello are competing fiercely and PicoChip is trying its best to become the leader.
The competition in PON sector is the fiercest. Cortina, Teknovus and PMC-Sierra evenly occupy the EPON sector. Cortina entered this sector in Mar 2007 through acquiring Immenstar, PMC-SIERRA entered the PON sector by acquiring Israel-based Passave (at the price of $300 million) in May 2006, and Teknovus emphasizes technology leadership, launching 10G EPON. Seen from the current situation, PMC-SIERRA has the strongest development capability.
In GPON sector, 10 chip companies support GPON, including Broadcom, BroadLight, Centillium, Conexant, PMC-Sierra, FreeScale, Cortina, etc, of which, PMC-Sierra and Cortina support both GPON and EPON. Teknovus and Opulan only support EPON. Centillium was acquired by Transwitch, Conexant (including PON broadband access business) was acquired by Ikanos in Apr 2009 (at the price of $54 million). Broadcom has just entered this sector, while BroadLight has the strongest capability.
In xDSL sector, Infineon, Broadcom and Ikano are leaders; Broadcom dominates the ADSL sector; Ikanos takes a market share of 80% more in VDSL sector; Broadcom, Intel, Atheros, Ralink Technology and Marvell have occupied the WLAN sector, Ralink Technology, a Taiwan-based company, surpassed Marvell to rank 5th in 2009.
第一章、网络通信基础与中国通信市场概况
1.1、网络通信基础
1.1.1、区域网路(LAN)
1.1.2、广域网路(WAN)
1.2、中国通信市场概况
1.3、中国通信行业固定投资
1.4、中国光通信市场
1.5、网络通信产业链
第二章、WIMAX产业与市场
2.1、WIMAX简介
2.2、WIMAX市场
2.3、WIMAX近况
2.3.1、WiMAX发达地区近况
2.3.2、WiMAX不发达地区近况
2.4、WIMAX地域分布
2.5、WIMAX产业
2.5.1、Alvarion
2.6、WIMAX芯片组(CHIPSET)
2.6.1、Beceem
2.6.2、SEQUANS
第三章、交换机产业与市场
3.1、交换机简介
3.2、交换机市场
3.3、交换机产业
第四章、FEMTOCELL
4.1、FEMTOCELL简介
4.2、FEMTOCELL市场
4.3、FEMTOCELL上游芯片
第五章:FTTX产业与市场
5.1、FTTX基础概念简介
5.2、全球宽带接入现状
5.3、FTTX现状
5.4、PON简介
5.5、GPON近况
5.6、PON市场与产业
5.7、 EPON上游芯片
5.7.1、Cortina
5.7.2、PMC-SIERRA
5.7.3、TEKNOVUS
5.8、GPON上游芯片
5.8.1、Broadlight
5.8.2、Transwitch
5.9、XDSL客户端设备市场与产业
5.10、XDSL 上游芯片
第六章、WLAN产业与市场
6.1、WLAN简介
6.2、WLAN市场
6.3、WLAN产业
6.4、WLAN上游芯片
6.4.1、雷凌
6.4.2、瑞昱
6.4.3、Atheros
第七章、IP机顶盒
7.1、IP机顶盒简介
7.2、机顶盒市场与产业
7.3、卫星电视
第八章、网络通信厂家研究
8.1、合勤
8.2、友讯
8.3、友劲
8.4、明泰
8.5、正文
8.6、中磊
8.7、智易
8.8、启碁
8.9、智邦
8.10、仲琦科技
8.11、建汉科技
8.12、兆赫
8.13、台扬科技
8.14、NETGEAR
8.15、思科
8.16、达创
8.17、ARRIS
8.18、DASAN
8.19、中兴通讯
8.20、烽火科技
8.21、华为
8.22、伟创力
8.23、JABIL
8.24、环隆电气
8.25、CELESTICA
1 Basic of Network Communication and China Communication Market Overview
1.1 Basic of Network Communication
1.1.1 LAN
1.1.2 WAN
1.2 China Communication Market Overview
1.3 Fixed Assets Investment in Communication Sector
1.4 China Optical Communication Market
1.5 Network Communication Industry Chain
2. WIMAX Industry and Market
2.1 WIMAX Profile
2.2 WIMAX Market
2.3 WIMAX Development
2.3.1 Developed Areas
2.3.2 Undeveloped Areas
2.4 WIMAX Layout by Region
2.5.WIMAX Industry
2.5.1 Alvarion
2.6 WIMAX CHIPSET
2.6.1 Beceem
2.6.2 SEQUANS
3 Switch Industry and Market
3.1 Switch Profile
3.2 Switch Market
3.3 Switch Industry
4. FEMTOCELL
4.1 FEMTOCELL Profile
4.2 FEMTOCELL Market
4.3 FEMTOCELL Upstream Chip
5. FTTX Industry and Market
5.1 Basic Concepts of FTTX
5.2 Global Broadband Access Status Quo
5.3 FTTX Status Quo
5.4 PON Profile
5.5 GPON Development
5.6 PON Industry and Market
5.7 EPON Upstream Chip
5.7.1 Cortina
5.7.2 PMC-SIERRA
5.7.3 TEKNOVUS
5.8 GPON Upstream Chip
5.8.1 Broadlight
5.8.2 Transwitch
5.9 XDSL CPE Industry and Market
5.10 XDSL Upstream Chip
6. WLAN Industry and Market
6.1 WLAN Profile
6.2 WLAN Market
6.3 WLAN Industry
6.4 WLAN Upstream Chip
6.4.1 Ralink Technology
6.4.2 Realtek
6.4.3 Atheros
7. IP STB
7.1 IP STB Profile
7.2 STB Industry and Market
7.3 Satellite TV
8 Network Communication Players
8.1 ZYXEL
8.2 D-LINK
8.3 CAMEO
8.4 ALPHA
8.5 GEMTEK
8.6 SERCOMM
8.7 ARCADYAN
8.8 WISTRON NEWEB CORP.
8.9 ACCTON
8.10 HITRON TECHNOLOGIES
8.11 CYBERTAN
8.12 ZINWELL
8.13 MICROELECTRONICS TECHNOLOGY INC. (MTI)
8.14 NETGEAR
8.15 CISCO
8.16 DELTA NETWORKS
8.17 ARRIS
8.18 DASAN
8.19 ZTE
8.20 FIBERHOME
8.21 HUAWEI
8.22 FLEXTRONICS
8.23 JABIL
8.24 USI
8.25 CELESTICA
1999-2009年10月中国固话用户数量统计
1999-2009年10月中国移动电话用户数量统计
2001-2009年10月中国宽带用户数量统计
2001-2009年10月中国通信行业固定投资规模
2001-2009年10月中国通信行业移动通信固定投资规模
2004-2009年移动通信基站产量
2005-2011年中国光通信市场规模
2006-2013年WiMAX网络设备市场规模
2006-2010年全球WiMAX累计客户数地域分布
2006-2010年WiMAX出货量统计及预测
截至2009年10月底全球WiMAX网络地域分布
截至2009年6月底全球WiMAX网络频率分布
截至2009年10月底全球WiMAX网络供应商中标数量占有率
2009年全球WiMAX客户端设备出货量主要厂家市场占有率
2004-2009年Alvarion收入与毛利率
2004-2009年Alvarion收入与运营利润率
2006-2009年前3季度收入地域分布
Alvarion承建网络全球分布
2007年2季度-2009年3季度Alvarion WiMAX收入统计
BCSB典型应用图
BSCM250典型应用图
SQN1220 内部框架图
2006-2012年10Gbe交换机市场规模与平均价格
2006年1季度-2008年4季度全球交换机市场按带宽分布
2009年企业级路由器市场主要厂家市场占有率
2009年1季度全球中小企业交换机市场占有率
2009年LAN交换机主要厂家市场占有率
2009-2014年Femtocell出货量预测
2008-2014年Femtocell芯片价格与市场规模预测
2009年3季度全球Femtocell全球布局
2009年3季度全球各地区FTTx用户数及接入类型
2009年3季度全球FTTx接入技术分布
GPON产业链
2008-2014年全球PON设备市场规模
2007年4季度-2009年4季度全球PON市场规模
2008-2013年全球PON市场技术分布
2009年GPON市场主要厂家市场占有率
2009年EPON市场主要厂价市场占有率
CS8021/26内部框架图
PMC-SIERRA全球分布
2004-2009年PMC-SIERRA收入与运营利润率
2006-2009年PMC-SIERRA收入国别分布
PMC-SIERRA客户分布
TK3714 典型应用图
Broadlight GPON产品分布
BL2000系列内部框架图
Broadlight GPON产品分布
XL230内部框架图
2004-2009年TranSwitch收入与毛利率
2008年1季度-2009年4季度TranSwitch收入与运营利润
2008年1季度-2009年4季度TranSwitch收入与毛利率
2008年1季度-2009年4季度TranSwitch各项支出
2006-2008年TranSwitch收入地域分布
TRANSWITCH产品分布
2009-2103年全球宽带用户数量
2008-2013年DSL客户端设备市场规模
2009年ADSL主要生产厂家市场占有率
2009-2013年xDSL设备芯片市场规模
2008年按端口输出数量xDSL设备芯片主要厂家市场占有率
2004-2009年Ikanos收入与毛利率
2008年3季度-2009年3季度Ikanos收入地域分布
2008年3季度-2009年3季度Ikanos收入产品分布
2008年3季度-2009年3季度Ikanos各项支出统计
Ikanos产品分布
Ikanos客户分布
2006-2012年WLAN市场技术分布
2007-2013年全球WLAN市场下游分布
2007-2013年全球WLAN市场消费类电子分布
2009年WLAN网卡市场主要厂家占有率
2009年WLAN无线路由主要厂家市场占有率
2009年全球WLAN芯片主要厂家出货量
2008-2013年WIFI手机市场占有率
2004-2010年雷凌收入与运营利润率统计及预测
雷凌科技组织结构图
2007年1季度-2009年3季度雷凌毛利率统计
2009年1季度-2010年4季度雷凌出货量产品分布
2009年1季度-2010年4季度雷凌收入产品分布
2009年1季度-2010年4季度雷凌收入下游应用分布
雷凌产品路线图
RT3350内部框架图
瑞昱组织结构图
2008年1季度-2009年4季度瑞昱收入下游应用分布
2003-2009年Atheros收入与运营利润率
2006-2009年前9月Atheros收入地域分布
2006-2009年前9月Atheros收入下游应用分布
AR9002 内部框架图
2007-2012年机顶盒出货量技术类型分布
2007-2012年全球机顶盒市场规模技术分布
合勤组织结构图
2003-2009年合勤科技收入与运营利润率
合勤关联公司组织结构
1993-2008年友讯科技收入与运营利润统计
2003-2010年友讯科技收入与运营利润率统计及预测
2008年1季度-2009年3季度友讯收入与运营利润率
2008年1季度-2009年3季度友讯收入地域分布
2008年1季度-2009年3季度友讯收入产品分布
友讯全球分布
友劲科技组织结构
2002-2010年友劲科技收入与运营利润率统计及预测
2006年1季度-2009年2季度友劲科技收入产品分布
2006年1季度-2009年2季度友劲科技收入地域分布
明泰科技组织结构
2005-2010年明泰收入与运营利润率
2008年1季度-2009年4季度明泰科技收入产品分布
2004-2010年正文科技收入与运营利润率统计及预测
2003-2010年中磊电子收入与运营利润率统计及预测
中磊电子组织结构图
2007-2009年中磊电子上半年收入产品分布
2003-2010年智易科技收入与运营利润率统计及预测
智易科技组织结构图
2007-2008年智易科技收入产品分部
2001-2010年启碁收入与毛利率
启碁组织结构
智邦组织结构图
2004-2009年智邦收入与运营利润
2005-2008年智邦收入地域分布
2004-2010年仲琦科技收入与运营利润率
仲琦科技组织结构
2002-2009年建汉科技收入与毛利率统计
建汉科技组织结构
2001-2009年兆赫收入与毛利率统计
兆赫组织结构
2003-2009年台扬收入与运营利润率
2005年1季度-2009年3季度台扬收入统计
2005年1季度-2009年3季度台扬毛利统计
2009年前3季度台扬收入产品分布
2004-2009年NETGEAR收入与运营利润
2006-2009年前3季度NETGEAR收入地域分布
2004-2009财年思科收入统计
2004-2009财年思科收入地域分布
2004-2009财年思科收入产品分布
思科全球架构
2004-009年达创收入与毛利
2007-2009年上半年达创收入地域分布
2007-2009年上半年达创收入产品分布
2004-2009年ARRIS收入与毛利率
2008年1季度-2009年3季度ARRIS收入与毛利率
2004-2009年Q3 ARRIS各部门收入
2005-2012年DASAN收入与EBIT
DASAN网络2009年11月底股东结构
DASAN全球分布
2005-2012年DASAN网络海外销售比例与净利率
2005-2009年DASAN网络负债比率
2005-2009年DASAN网络股本对可变现资产比率
2006-2009年DASAN客户结构
2008、2009年前3季度DASAN网络收入产品分布
2007年1季度-2009年3季度中兴通讯收入与毛利率统计
2007-2011年中兴通讯收入产品分布
峰火科技集团组织结构
2005-2011年烽火通信收入与营业利润
2007年3季度-2009年3季度伟创力收入部门分布
2007年3季度-2009年3季度伟创力收入与毛利率统计
2001-2009财年捷普收入与运营利润
2007-2009财年捷普收入部门分布
2002-2009年天弘收入与毛利率
2007年3季度-2009年3季度天弘收入与运营利润率
2009年3季度天弘收入各部门分布
固定WiMAX与移动WiMAX对比
2008年4季度千兆以太网交换机主要厂家市场占有率排名
2008年4季度万兆以太网交换机主要厂家市场占有率排名
2008年4季度企业级路由器主要厂家市场占有率
2008年4季度L2+L3管理型交换机主要厂家市场占有率
2008年4季度L2+L3非管理型交换机主要厂家市场占有率
交换机代工厂家
2009年3季度全球10大FTTx运营商用户数统计
2009年3季度全球各地区PON市场类型分布
2006-2008年TRANSWITCH主要客户
雷凌各部门职责
瑞昱各部门职责
合勤科技各部门职责
合勤科技主要供应商
合勤科技2005-2008年宽频产品产能、产量、产能利用率、产值、平均价格统计
合勤科技2005-2008年COE产品产能、产量、产能利用率、产值、平均价格统计
2008年合勤产品收入结构
友劲科技主要供应商
2005-2008年友劲科技有线通讯产品产能、产量、产能利用率、产值、平均价格统计
2005-2008年友劲科技无线通讯产品产能、产量、产能利用率、产值、平均价格统计
明泰科技各部门职责
2005-2008年明泰科技网络交换机产能、产量、产能利用率、产值、平均价格统计
2005-2008年明泰科技宽频网络产品产能、产量、产能利用率、产值、平均价格统计
2005-2008年明泰科技无线网络产品产能、产量、产能利用率、产值、平均价格统计
2005-2008年明泰科技数字家庭产能、产量、产能利用率、产值、平均价格统计
2008年度明泰科技收入地域分布
中磊电子各部门职责
2008-2009年上半年中磊电子收入地域分布
2007、2008年中磊电子有线与无线产品产能、产值统计
智易科技各部门职责
2007-2009年H1 智易科技收入地域分布
启碁各部门职责
智邦各部门职责
2007、2008年智邦各项产品产量
2007、2008年智邦各项产品产值
仲琦各部门职责
兆赫各部门职责
2008年1季度-2009年3季度ARRIS大客户收入
2007-2011年中兴通讯各项产品收入增幅
2007年1季度-2009年3季度中兴通讯各项费用支出
2007-2009财年捷普主要客户所占比例
2004-2010年环隆电气简明财务数据
2009年11月环电各部门收入统计
China Fixed Telephone Subscribers, 1999-Oct 2009
China Mobile Phone Subscribers, 1999-Oct 2009
China Broadband Subscribers, 2001-Oct 2009
Fixed Assets Investment in China Communications Industry, 2001-Oct 2009
Fixed Assets Investment in China Mobile Communication Sector, 2001-Oct 2009
Mobile Communication Base Station Output, 2004-2009
China Optical Communication Market Scale, 2005-2011
WiMAX Device Market Scale, 2006-2013
Global Regional Distribution of Accumulated WiMAX Subscribers, 2006-2010
WiMAX Shipment, 2006-2010
Regional Distribution of Global WiMAX Network (as of the end of Oct 2009)
Frequency Distribution of Global WiMAX Network (as of the end of Jun 2009)
Ratio of WiMAX Network Suppliers in Bid Quantity (as of the end of Oct 2009)
WiMAX CPE Shipment Ratio of Key Vendors in the World, 2009
Revenue and Gross Profit Margin of Alvarion, 2004-2009
Revenue and Operating Profit Margin of Alvarion, 2004-2009
Alvarion Revenue by Region, 2006-Q3 2009
Global Distribution of Network Built by Alvarion
Alvarion WiMAX Revenue, Q2 2007-Q3 2009
BCSB Typical Application Diagram
BSCM250 Typical Application Diagram
SQN1220 Block Diagram
Market Scale and Average Price of 10Gbe Switch, 2006-2012
Distribution of Global Switch Market (by Bandwidth), 2006Q1-2008Q4
Market Share of Major Enterprise Router Vendors, 2009
Global Market Share of SME Switch, 2009Q1
Market Share of Key LAN Switch Vendors, 2009
Femtocell Shipment Forecast, 2009-2014
Femtocell Chip Price and Market Scale Forecast, 2008-2014
Global Presence of Femtocell, 2009Q3
FTTx Subscribers and Access Type by Region, 2009Q3
Global Distribution of FTTx Access Technology, 2009Q3
GPON Industry Chain
Global PON Device Market Scale, 2008-2014
Global PON Market Scale, 2007Q4-2009Q4
Technology Distribution of Global PON Market, 2008-2013
Market Share of Key GPON Companies, 2009
Market Share of Key EPOON Companies, 2009
CS8021/26 Block Diagram
Global Presence of PMC-SIERRA
Revenue and Operating Profit Margin of PMC-SIERRA, 2004-2009
Revenue of PMC-SIERRA by Country, 2006-2009
PMC-SIERRA Client Distribution
TK3714 Typical Application Diagram
Broadlight GPON Product Distribution
BL2000 Series Block Diagram
Broadlight GPON Product Distribution
XL230 Block Diagram
Revenue and Gross Profit Margin of TranSwitch, 2004-2009
Revenue and Operating Profits of TranSwitch, 2008Q1-2009Q4
Revenue and Gross Profit Margin of TranSwitch, 2008Q1-2009Q4
Expenses of TranSwitch, 2008Q1-2009Q4
Revenue of TranSwitch by Region, 2006-2008
TRANSWITCH Product Distribution
Global Broadband Subscribers, 2009-2103
DSL CPE Market Scale, 2008-2013
Market Share of Key ADSL Companies, 2009
xDSL Device Chip Market Scale, 2009-2013
Market Share of Key xDSL Device Chip Vendors by Port Number, 2008
Revenue and Gross Profit Margin of Ikanos, 2004-2009
Revenue of Ikanos by Region, 2008Q3-2009Q3
Revenue of Ikanos by Product, 2008Q3-2009Q3
Expenses of Ikanos, 2008Q3-2009Q3
Ikanos Product Distribution
Ikanos Client Distribution
Technology Distribution of WLAN Market, 2006-2012
Downstream Application Distribution of Global WLAN Market, 2007-2013
Application Ratio of WLAN in Consumer Electronics, 2007-2013
Market Share of Key WLAN NIC Vendors, 2009
Market Share of Key WLAN Routers Vendors, 2009
Global Shipment of Key WLAN Chip Vendors, 2009
Market Share of WIFI Mobile Phones, 2008-2013
Revenue and Operating Profit Margin of Ralink Technology, 2004-2010
Gross Profit Margin of Ralink Technology, 2007Q1-2009Q3
Shipment of Ralink Technology by Product, 2009Q1-2010Q4
Revenue of Ralink Technology by Product, 2009Q1-2010Q4
Revenue of Ralink Technology by Downstream Application, 2009Q1-2010Q4
Product Roadmap of Ralink Technology
RT3350 Block Diagram
Revenue of Realtek by Downstream Application, 2008Q1-2009Q4
Revenue and Operating Profit Margin of Atheros, 2003-2009
Revenue of Atheros by Region, 2006-Sep 2009
Revenue of Atheros by Downstream Application, 2006-Sep 2009
AR9002 Block Diagram
STB Shipment by Technology, 2007-2012
Global STB Market Scale by Technology, 2007-2012
Revenue and Operating Profit Margin of ZyXEL, 2003-2009
Revenue and Operating Profit of D-Link, 1993-2008
Revenue and Operating Profit Margin of D-Link, 2003-2010
Revenue and Operating Profit Margin of D-Link, 2008Q1-2009Q3
Revenue of D-Link by Region, 2008Q1-2009Q3
Revenue of D-Link by Product, 2008Q1-2009Q3
Global Presence of D-Link
Revenue and Operating Profit Margin of CAMEO, 2002-2010
Revenue of CAMEO by Product, 2006Q1-2009Q2
Revenue of CAMEO by Region, 2006Q1-2009Q2
Revenue and Operating Profit Margin of Alpha, 2005-2010
Revenue of Alpha by Product, 2008Q1-2009Q4
Revenue and Operating Profit Margin of Gemtek, 2004-2010
Revenue and Operating Profit Margin of SerComm, 2003-2010
Revenue of SerComm by Product, 2007H1-2009H1
Revenue and Operating Profit Margin of Arcadyan, 2003-2010
Revenue of Arcadyan by Product, 2007-2008
Revenue and Gross Profit Margin of WISTRON NEWEB CORP., 2001-2010
Revenue and Operating Profit of Accton, 2004-2009
Revenue of Accton by Region, 2005-2008
Revenue and Operating Profit Margin of Hitron Technologies, 2004-2010
Revenue and Gross Profit Margin of CyberTAN, 2002-2009
Revenue and Gross Profit Margin of Zinwell, 2001-2009
Revenue and Operating Profit Margin of MTI, 2003-2009
Revenue of MTI, 2005Q1-2009Q3
Gross Profit of MTI, 2005Q1-2009Q3
Revenue of MTI by Product, 2009Q1-2009Q3
Revenue and Operating Profit of NETGEAR, 2004-2009
Revenue of NETGEAR by Region, 2006-2009Q3
Revenue of Cisco, 2004-2009
Revenue of Cisco by Region, 2004-2009
Revenue of Cisco by Product, 2004-2009
Revenue and Gross Profit of Delta Networks, 2004-2009
Revenue of Delta Networks by Region, 2007-2009H1
Revenue of Delta Networks by Product, 2007-2009H1
Revenue and Gross Profit Margin of ARRIS, 2004-2009
Revenue and Gross Profit Margin of ARRIS, 2008Q1-2009Q3
Revenue of ARRIS by Division, 2004-2009Q3
Revenue and EBIT of DASAN, 2005-2012
Shareholding Structure of DASAN (as of the end of Nov 2009)
Global Presence of DASAN
Overseas Sales Ratio and Net Profit Margin of DASAN, 2005-2012
Debt Ratio of DASAN, 2005-2009
Capital Stock/Realizable Assets Ratio of DASAN, 2005-2009
Client Structure of DASAN, 2006-2009
Revenue of DASAN by Product, 2008Q3&2009Q3
Revenue and Gross Profit Margin of ZTE, 2007Q1-2009Q3
Revenue of ZTE by Product, 2007-2011
Revenue and Operating Profit of Fiberhome, 2005-2011
Revenue of Flextronics by Division, 2007Q3-2009Q3
Revenue and Gross Profit Margin of Flextronics, 2007Q3-2009Q3
Revenue and Operating Profit of Jabil Circuit, 2001-2009
Revenue of Jabil Circuit by Division, 2007-2009
Revenue and Gross Profit Margin of Celestica, 2002-2009
Revenue and Operating Profit Margin of Celestica, 2007Q3-2009Q3
Revenue of Celestica by Division, 2009Q3
Comparison between Fixed WiMAX and Mobile WiMAX
Market Share Ranking of Key Gigabit Ethernet Switch Vendors, 2008Q4
Market Share Ranking of Key 10Gb Ethernet Switch Vendors, 2008Q4
Market Share of Key Enterprise Router Vendors, 2008Q4
Market Share of Key L2+L3 Managed Switch Vendors, 2008Q4
Market Share of Key L2+L3 Unmanaged Switch Vendors, 2008Q4
Switch OEM Companies
Subscribers of World’s Top 10 FTTx Operators, 2009Q3
PON Market Type Ratio by Region, 2009Q3
Major Clients of TRANSWITCH, 2006-2008
Key Suppliers of ZyXEL
Capacity, Output, Capacity Utilization Ratio, Output Value and Average Price of Broadband Products of ZyXEL, 2005-2008
Capacity, Output, Capacity Utilization Ratio, Output Value and Average Price of COE Products of ZyXEL, 2005-2008
ZyXEL Revenue by Product, 2008
Key Suppliers of CAMEO
Capacity, Output, Capacity Utilization Ratio, Output Value and Average Price of Wired Communication Products of CAMEO, 2005-2008
Capacity, Output, Capacity Utilization Ratio, Output Value and Average Price of Wireless Communication Products of CAMEO, 2005-2008
Capacity, Output, Capacity Utilization Ratio, Output Value and Average Price of Network Switch of Alpha, 2005-2008
Capacity, Output, Capacity Utilization Ratio, Output Value and Average Price of Broadband Network Products of Alpha, 2005-2008
Capacity, Output, Capacity Utilization Ratio, Output Value and Average Price of Wireless Network Products of Alpha, 2005-2008
Capacity, Output, Capacity Utilization Ratio, Output Value and Average Price of Digital Home of Alpha, 2005-2008
Revenue of Alpha by Region, 2008
Revenue of SerComm by Region, 2008-2009H1
Capacity and Output Value of Wired and Wireless Products of SerComm, 2007-2008
Revenue of Arcadyan by Region, 2007-2009H1
Output of Accton by Product, 2007-2008
Output Value of Accton by Product, 2007-2008
ARRIS Revenue Contributed by Big Clients, 2008Q1-2009Q3
Revenue Growth of ZTE by Product, 2007-2011
Expenses of ZTE, 2007Q1-2009Q3
Major Client Ratio of Jabil Circuit, 2007-2009
Financial Data of USI, 2004-2010
Revenue of USI by Division, Nov 2009
如果这份报告不能满足您的要求,我们还可以为您定制报告,请 留言说明您的详细需求。
|