|
|
|
报告导航:研究报告—
制造业—能源矿产
|
|
2009年中国铅锌行业研究报告 |
 |
字数:2.5万 |
页数:72 |
图表数:60 |
|
中文电子版:6000元 |
中文纸版:3000元 |
中文(电子+纸)版:6500元 |
|
英文电子版:2000美元 |
英文纸版:1900美元 |
英文(电子+纸)版:2300美元 |
|
编号:LMX001
|
发布日期:2009-12 |
附件:下载 |
 |
|
|
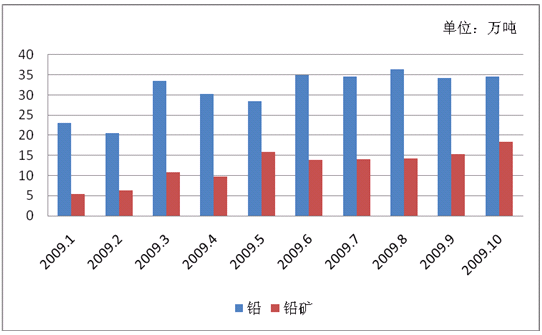
在全球金融危机的大背景下,欧美各国铅锌市场复苏脚步缓慢,而中国铅锌市场复苏力度超出预期。2009年中国精铅以及铅矿产量整体依然维持增长。2009年1-10月,中国精炼铅产量总计315.94万吨,同比增加19.4%。2009年1-10月中国铅矿产量总计126.48万吨(金属吨),同比增加13.5%。
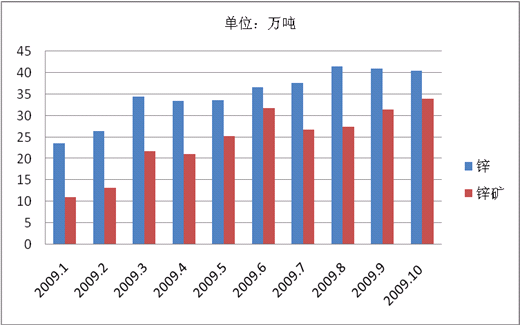
2009年1-10月,中国精炼锌产量总计351.82万吨,同比增加5.8%。但是由于年初国际锌价的持续疲软使得企业的资金压力由冶炼企业上传到精矿厂商,矿山的关停和减产已成为铅锌产业链中存在的重要问题。2009年1-10月中国锌矿产量总计243.79万吨(金属吨),同比减少7.7%。
图:2009年1-10月中国铅及铅矿产量

整理:水清木华研究中心
图:2009年1-10月中国锌及锌矿产量

整理:水清木华研究中心
中国铅锌产量的增长归结于需求的增长,全球铅锌市场都在关注中国铅锌需求的增长。 2009年下半年中国铅锌进口量大幅增长,也是国内铅锌市场需求强劲的一个很好体现。
2009年下半年中国有色金属市场整体开始有回升的迹象,铅锌企业也逐渐从金融危机的困境中摆脱出来。
本研究报告主要针对中国铅锌行业发展、市场现状、铅锌进出口情况、铅锌行业供需形势、铅锌下游产业以及铅锌上下游重点企业等几个方面进行了分析研究,探讨了中国铅锌行业未来的发展方向。
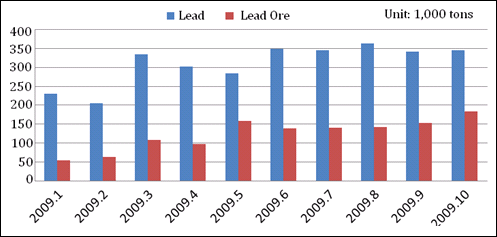
Affected by the global financial crisis, the lead-zinc market in Euro-American countries takes slow recovery steps, but China’s lead-zinc market is better than expected. In 2009, China’s output of lead concentrate and lead ore still continued growth. In Jan.-Oct.2009, the total output of refined lead concentrate reached 3,159,400 tons, up 19.4% yr-on-yr; the output of lead ore amounted to 1,264,800 tons (in metal tons), up 13.5% yr-on-yr.
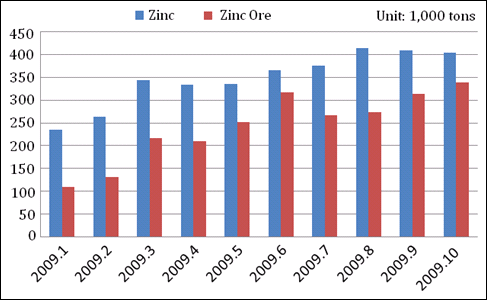
In Jan.-Oct.2009, the total output of refined zinc was 3,518,200 tons, up 5.8% yr-on-yr. However, the falling prices of zinc in global market at the beginning of 2009 caused fund pressure to be transferred to ore concentrate manufacturers, thus ore stoppage and production drop became the important issues for lead-zinc industry chain, and the output of zinc ore was down 7.7% yr-on-yr to be 2,437,900 tons (in metal tons).
China’s Output of Lead and Lead Ore, Jan.-Oct.2009

Source: ResearchInChina
China’s Output of Zinc and Zinc Ore, Jan.-Oct.2009

Source: ResearchInChina
The output increase of lead-zinc in China is attributed to the demand increase, and which becomes the attention focus of global lead-zinc market. The great rise of lead-zinc import in the second half year of 2009 also shows the strong demand for lead-zinc in Chinese market.
In the second half year of 2009, China’s non-ferrous metal market recovered slightly, and lead-zinc enterprises also rid themselves of global financial predicament gradually.
This report analyzes the development of China’s lead-zinc industry, market status quo, import & export, demand situation, lead-zinc downstream sectors, and key players, and probes into future development direction of China’ lead-zinc industry.
第一章 铅锌概述
1.1 铅锌定义以及用途
1.2 铅锌行业产业链
1.3 铅锌生产工艺介绍
第二章 全球铅锌行业发展概况
2.1 全球铅锌资源分布
2.2 全球铅锌行业发展现状
2.2.1 全球铅行业发展现状
2.2.2 全球锌行业发展现状
2.3 全球铅锌市场格局
2.3.1 全球铅市场格局
2.3.2 全球锌市场格局
第三章 中国铅锌行业发展概况
3.1 中国铅锌资源分布
3.2 中国铅锌矿产资源特点
3.2.1 矿产资源分布特点
3.2.2 成矿特点
3.2.3 矿床以及矿石类型特点
3.2.4 矿床物质成分特点
3.2.5 矿石品位特点
3.3 中国铅锌生产情况
3.3.1 中国铅锌业生产布局
3.3.2 中国铅锌产量
3.4 中国铅锌需求情况
3.4.1 中国铅锌消费结构
3.4.2 中国铅锌消费状况
3.5 中国铅锌行业发展现状
3.6 中国铅锌企业生产情况
第四章 中国铅锌进出口情况
4.1 中国铅锌精矿进口情况
4.2 中国精炼铅锌进出口情况
4.2.1 中国精炼铅进出口情况
4.2.2 中国精炼锌进出口情况
第五章 中国铅锌价格
5.1 中国铅市场价格
5.2 中国锌市场价格
第六章 中国铅锌下游产业分析
6.1 铅酸蓄电池行业发展分析
6.1.1 铅酸蓄电池应用
6.1.2 中国铅酸蓄电池行业发展现状
6.1.3 中国铅酸蓄电池发展方向
6.2 镀锌行业发展分析
6.2.1 镀锌分类
6.2.2 镀锌行业发展现状及趋势
第七章 重点企业分析
7.1 河南豫光金铅集团有限责任公司
7.1.1 公司简介
7.1.2 经营状况
7.1.3 铅锌业务
7.1.4 发展瓶颈有待突破
7.2 株洲冶炼集团股份有限公司
7.2.1 公司简介
7.2.1 经营状况
7.2.2 铅锌业务
7.2.3 新增项目
7.3 葫芦岛锌业股份有限公司
7.3.1 公司简介
7.3.2 营业状况
7.3.3 铅锌业务
7.3.4 区域优势明显
7.4 紫金矿业
7.4.1 公司简介
7.4.2 经营状况
7.4.3 锌业务
7.4.4 对外扩张潜力巨大
7.4.5 最新收购
7.5 中金岭南有色金属股份有限公司
7.5.1 公司简介
7.5.2 经营状况
7.5.3 铅锌业务
7.5.4 发展潜力巨大
7.6 云南驰宏锌锗股份有限公司
7.6.1 公司简介
7.6.2 营业状况
7.6.3 铅锌业务
7.6.4 发展战略
7.7 四川宏达股份有限公司
7.7.1 公司简介
7.7.2 经营状况
7.7.3 锌业务
7.7.4 多元化发展战略
7.8 西部矿业
7.8.1 公司简介
7.8.2 经营状况
7.8.3 铅锌业务
7.8.4 产业链布局优势明显
7.9 其他铅锌企业
7.9.1 白银有色金属有限公司
7.9.2 祥云飞龙实业有限公司
7.9.3 灵宝市新凌铅业有限责任公司
7.9.4 济源市万洋冶炼集团有限公司
7.9.5 济源市金利冶炼有限责任公司
7.9.6 水口山有色金属有限公司
7.9.7 陕西东岭锌业有限公司
7.9.8 库博红烨锌业有限公司
7.9.9 广西成源矿冶有限公司
第八章 中国铅锌行业机会与风险分析
8.1 机会分析
8.2 风险分析
1 Overview of Lead & Zinc
1.1 Definition and Purpose
1.2 Industry Chain
1.3 Process Technology
2 Global Lead & Zinc Industry Development
2.1 Resource Distribution
2.2 Industry Development
2.2.1 Status Quo - Lead
2.2.2 Status Quo -Zinc
2.3 Global Lead & Zinc Market Pattern
2.3.1 Lead Market Pattern
2.3.2 Zinc Market Pattern
3 China Lead & Zinc Industry Development
3.1 Resource Distribution
3.2 Characteristics of Lead & Zinc Mine Resources
3.2.1 Distribution Characteristics
3.2.2 Metallogenic Characteristics
3.2.3 Characteristics of Mineral Deposit and Ore Type
3.2.4 Characteristics of Mineral Components of Deposit
3.2.5 Characteristics of Ore Grade
3.3 Lead & Zinc Production in China
3.3.1 Production Layout
3.3.2 Lead & Zinc Output
3.4 Lead & Zinc Demand in China
3.4.1 Consumption Structure
3.4.2 Consumption of Lead & Zinc
3.5 Status Quo of China Lead & Zinc Industry
3.6 Production of China Lead & Zinc Manufacturers
4 Import and Export of China Lead & Zinc Industry
4.1 Import of Lead & Zinc Concentrate
4.2 Export of Lead & Zinc Concentrate
4.2.1 Export of Lead Concentrate
4.2.2 Export of Zinc Concentrate
5 Lead & Zinc Price in China
5.1 Lead Price
5.2 Zinc Price
6 Downstream Sectors of China Lead & Zinc Industry
6.1 Lead Acid Storage Battery Industry
6.1.1 Application
6.1.2 Current Development
6.1.3 Development Trend
6.2 Galvanization Industry
6.2.1 Classification
6.2.2 Current Development and Trends
7 Key Players
7.1 Henan Yuguang Gold & Lead Group Co., Ltd
7.1.1 Profile
7.1.2 Operation
7.1.3 Lead & Zinc Business
7.1.4 Development Bottlenecks
7.2 Zhuye Smelter Group Co., Ltd.
7.2.1 Profile
7.2.2 Operation
7.2.3 Lead & Zinc Business
7.2.4 New Projects
7.3 Huludao Zinc Industry Co., Ltd
7.3.1 Profile
7.3.2 Operation
7.3.3 Lead & Zinc Business
7.3.4 Regional Advantages
7.4 Zijin Mining Group Company Limited
7.4.1 Profile
7.4.2 Operation
7.4.3 Zinc Business
7.4.4 Great Potentials in Expansion
7.4.5 New Acquisitions
7.5 Shenzhen Zhongjin Lingnan Nonfemet Company Limited
7.5.1 Profile
7.5.2 Operation
7.5.3 Lead & Zinc Business
7.5.4 Great Growth Potentials
7.6 Yunnan Chihong Zinc & Germanium Co., Ltd
7.6.1 Profile
7.6.2 Operation
7.6.3 Lead & Zinc Business
7.6.4 Development Strategies
7.7 Sichuan Hongda Co., Ltd
7.7.1 Profile
7.7.2 Operation
7.7.3 Zinc Business
7.7.4 Diversified Development Strategies
7.8 Western Mining Co., Ltd
7.8.1 Profile
7.8.2 Operations
7.8.3 Lead & Zinc Business
7.8.4 Industry Chain Layout
7.9 Other Lead & Zinc Manufacturers
7.9.1 Baiyin Non-ferrous Metal Co., Ltd
7.9.2 Xiangyun Feilong Industrial Co., Ltd.
7.9.3 Lingbao Xinling Lead Industry Co., Ltd
7.9.4 JiYuan WanYang Smeltery Group Co., Ltd
7.9.5 Jiyuan Jinli Smelter Co., Ltd.
7.9.6 Shuikoushan Non-ferrous Co., Ltd
7.9.7 Shaanxi Dongling Zinc Industrial Co., Ltd
7.9.8 Kubo HongYe Zinc Smelt Co.,Ltd
7.9.9 Guangxi Chengyuan Mining & Smelting Co., Ltd
8 Opportunities and Risks of China Lead & Zinc Industry
8.1 Opportunities
8.2 Risks
表:铅锌定义及用途
图:铅锌行业产业链
表:世界铅储量分布(单位:万吨)
表:世界锌储量分布(单位:万吨)
图:2003-2009全球铅矿及精铅及消费量
图:2003-2009年全球铅市场供需平衡表
图:2003-2009全球锌矿及精锌产量及消费量
图:2003-2009年全球锌市场供需平衡表
图:中国A+B+C级铅储量与国外同期储量基础对比
图:中国A+B+C级锌储量与国外同期储量基础对比
图:铅矿保有储量150万吨以上10个省区
图:锌矿保有储量200万吨以上13个省区
图:铅矿储量在东部、中部以及西部三大经济地带分布比例
图:锌矿储量在东部、中部以及西部三大经济地带分布比例
表:五大铅锌生产基地
图:2006-2008年中国铅及铅矿产量
图:2009年1-10月中国铅及铅矿产量
图:2006-2008年中国锌及锌矿产量
图:2009年1-10月中国锌及锌矿产量
图:中国铅的初级消费结构
图:中国锌的初级消费结构
表:中国主要铅锌企业产能情况
图:2009年1-10月中国精铅主要进口国及进口量
图:2006-2009年中国精铅进出口量对比
表:2003-2008年中国精炼锌出口关税、退税政策
图:2005-2009年中国精锌进出口对比
图:2009年1-10月中国精锌主要进口国及进口量
图:2009年中国市场精铅月平均价走势图
图:2005-2009年中国精铅年度平均价走势
图:2009年中国市场精锌月平均价走势图
图:2005-2009年中国精锌年度平均价走势
图:中国铅酸蓄电池消费结构
图:2006-2009年豫光金铅营业收入变化
图:2009年上半年豫光金铅国内外收入构成
图:2009年上半年豫光金铅行业收入构成
图:2006-2009年豫光金铅电解铅收入占总收入比值
图:2006-2009年豫光金铅电解铅收入变化
图:2009年株洲冶炼国内外收入构成
图:2006-2009年株洲冶炼营业收入变化
图:2009年株洲冶炼产品收入构成
图:2006-2009年株洲冶炼铅锌收入变化
图:2006-2009年葫芦岛锌业营业收入变化
图:2009年上半年葫芦岛锌业产品收入构成
图:2006-2009年葫芦岛锌业营业收入变化
图:紫金矿业经营版图
图:2006-2009年紫金矿业营业收入变化
图:2009年1-9月紫金矿业产品收入构成
图:2006-2009年紫金矿业锌收入变化
图:2006-2009年中金岭南营业收入变化
图:2007-2009年中金岭南铅锌产品收入变化
图:2006-2009年驰宏锌锗营业收入变化
图:2009年上半年驰宏锌锗产品收入构成
图:2006-2009年驰宏锌锗铅锌产品收入构成
图:2006-2009宏达股份营业收入变化
图:2009年上半年宏达股份产品收入构成
图:2005-2009宏达股份锌锭收入构成
图:2006-2009年西部矿业营业收入变化
图:2009年上半年西部矿业产品收入构成
图:2008-2009年西部矿业自产铅类产品营业收入变化
图:2008-2009年西部矿业自产锌类产品营业收入变化
Definition and Application of Lead-Zinc
Lead-Zinc Industry Chain
Distribution of Lead Reserves Worldwide
Distribution of Zinc Reserves Worldwide
Global Consumption of Lead Ore and Refined Lead
Supply & Demand Balance of Global Lead Market, 2003-2009
Output and Consumption of Global Zinc Ore and Zinc Concentrate, 2003-2009
Supply & Demand Balance of Global Zinc Market, 2003-2009
Comparison of A+B+C grade Lead Reserves between China and Foreign Countries
Comparison of A+B+C grade Zinc Reserves between China and Foreign Countries
Ten Provinces (Regions) with Available Reserves of Lead above 1.5 million tons in China
13 Provinces (Regions) with Available Reserves of Zinc above 2 million tons in China
Proportions of Lead Mine Reserves in Eastern, Middle and Western Economic Zone of China
Proportions of Zinc Mine Reserves in Eastern, Middle and Western Economic Zone of China
Five Lead-Zinc Production Bases
China’s Output of Lead and Lead Ore, 2006-2008
China’s Output of Lead and Lead Ore, Jan.-Oct.2009
China’s Output of Zinc and Zinc Ore, 2006-2008
China’s Output of Zinc and Zinc Ore, Jan.-Oct.2009
Primary Consumption of Lead in China
Primary Consumption of Zinc in China
Production Capacity of Major Lead-Zinc Enterprises in China
Countries Exported and Imported Quantity of China Lead Concentrate, Jan.-Oct.2009
Comparison of China Lead Concentrate between Export and Import, 2006-2009
Export Duty and Tax Refund of Refined Zinc in China, 2003-2008
Comparison of China Zinc Concentrate between Export and Import, 2005-2009
Countries Exported and Imported Quantity of China Zinc Concentrate, Jan.-Oct.2009
Monthly Average Price Trend of China Lead Concentrate, 2009
Yearly Average Price Trend of China Lead Concentrate, 2005-2009
Monthly Average Price Trend of China Zinc Concentrate, 2009
Yearly Average Price Trend of China Zinc Concentrate, 2005-2009
Consumption Structure of China Lead Acid Storage Battery
Operating Revenue of Henan Yuguang Gold and Lead Group Co., Ltd, 2006-2009
Domestic and Overseas Income Structure of Henan Yuguang Gold and Lead Group, 1H2009
Income Structure of Henan Yuguang Gold and Lead Group Co., Ltd by Industry, 1H2009
Proportion of Electrolytic Lead Income to Total Revenue of Henan Yuguang Gold and Lead Group, 2006-2009
Income from Electrolytic Lead Business of Henan Yuguang Gold and Lead Group, 2006-2009
Domestic and Overseas Income Structure of Zhuzhou Smelter Group Co., Ltd, 2009
Operating Revenue of Zhuzhou Smelter Group Co., Ltd, 2006-2009
Income Structure of Zhuzhou Smelter Group Co., Ltd by Product, 2009
Income from Lead and Zinc Business of Zhuzhou Smelter Group Co., Ltd, 2006-2009
Operating Revenue of Huludao Zinc Industry Co., Ltd, 2006-2009
Income Structure of Huludao Zinc Industry Co., Ltd by Product, 2006-2009
Business Map of Zijin Mining Group Co., Ltd
Operating Revenue of Zijin Mining Group Co., Ltd, 2006-2009
Income Structure of Zijin Mining Group Co., Ltd by Product, Jan-Sep 2009
Income from Zinc Business of Zijin Mining Group Co., Ltd, 2006-2009
Operating Revenue of Shenzhen Zhongjin Lingnan Nonfemet Company Limited, 2006-2009
Income from Lead and Zinc Business of Shenzhen Zhongjin Lingnan Nonfemet, 2007-2009
Operating Revenue of Yunnan Chihong Zinc & Germanium Co., Ltd, 2006-2009
Income Structure of Yunnan Chihong Zinc & Germanium Co., Ltd by Product, 1H2009
Income from Lead and Zinc Business of Yunnan Chihong Zinc & Germanium Co., Ltd, 2006-2009
Operating Revenue of Sichuan Hongda Co., Ltd, 2006-2009
Income Structure of Sichuan Hongda Co., Ltd by Product, 1H2009
Income from Zinc Ingot Business of Sichuan Hongda Co., Ltd, 2005-2009
Operating Revenue of Western Mining Co., Ltd, 2006-2009
Income Structure of Western Mining Co., Ltd by Product, 1H2009
Operating Revenue from Self-produced Lead Products of Western Mining Co., Ltd, 2008-2009
Operating Revenue from Self-produced Zinc Products of Western Mining Co., Ltd, 2008-2009
如果这份报告不能满足您的要求,我们还可以为您定制报告,请 留言说明您的详细需求。
|