|
报告导航:研究报告—
制造业—能源矿产
|
|
2009年中国镁行业研究报告 |
 |
字数:1.4万 |
页数:41 |
图表数:31 |
|
中文电子版:2500元 |
中文纸版:1250元 |
中文(电子+纸)版:3000元 |
|
英文电子版:1200美元 |
英文纸版:1100美元 |
英文(电子+纸)版:1500美元 |
|
编号:LMX004
|
发布日期:2010-03 |
附件:下载 |
 |
|
|
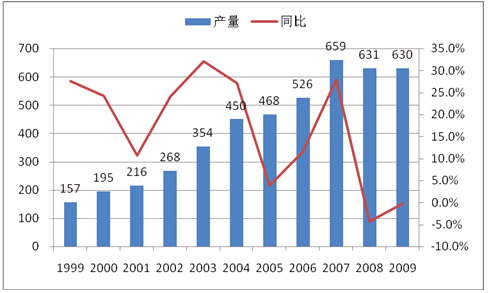
中国自1998年以来,原镁产量一直居历史首位,已经连续10年成为世界最大的原镁产地。2008年中国原镁产量占全球原镁产量的89%左右。2009年中国原镁产量63万吨,同比下滑0.15%。
图:1999-2009年中国原镁产量变化(单位:千吨)

整理:水清木华研究中心
产量下滑的主要原因是2009年上半年受金融危机影响,镁需求低迷,镁生产企业大面积减产所致。2009年全年中国原镁的消费量预计为15-17万吨,与去年大体持平或略微有所增长。尽管上半年中国镁需求依然保持低迷,但是下半年随着中国经济的率先回暖,需求也有所增长。
作为全球最大的镁生产国,中国镁工业是出口主导型的产业,出口量占到产量的71%。
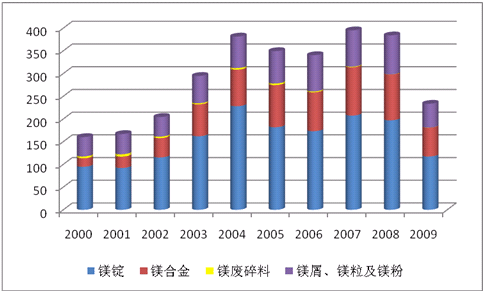
图:2000-2009年中国各种镁产品出口量统计
(单位:千吨)

整理:水清木华研究中心
2009年中国累计出口各类镁产品共23.35万吨,同比下降41.09%,累计金额6.46亿美元,同比减少61.37%,2008-2009年镁产品出口量的减少,尤其是2009年出口量的大幅缩减主要是受金融危机影响,国外需求低迷所致。
本研究报告依据主要针对中国镁以及镁合金行业发展历程、市场变化趋势、出口情况,重点企业经营情况等几个方面进行了分析研究,探讨了中国镁行业的现状以及未来发展趋势。
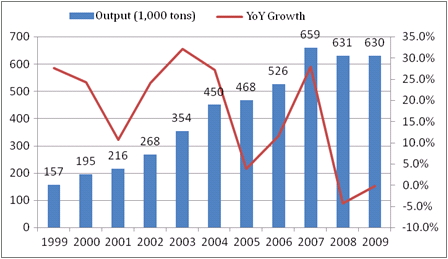
Since 1998, China’s output of primary magnesium has always topped the world, and it has become the world’s largest primary magnesium production area for successive ten years. The primary magnesium output in China accounted for approximately 89% of the world’s total in 2008, and China’s output of primary magnesium reached 630,000 tons in 2009, down 0.15% yr-on-yr.
China’s Output of Primary Magnesium, 1999-2009

Source: ResearchInChina
Inflicted by global economic downturn in the first half of 2009, the output of magnesium fell since magnesium companies reduce their production substantially and the market demand got dampened a lot. It was expected that China’s consumption of primary magnesium would reach 150,000-170,000 tons in 2009, which remained roughly unchanged or a slight growth against a year earlier. In 2H 2009, China’s demand for magnesium grows as China’s economy firstly picks up.
Being the world’s biggest magnesium producer, China’s magnesium industry is export-oriented, and its export volume accounts for 71% of the output.
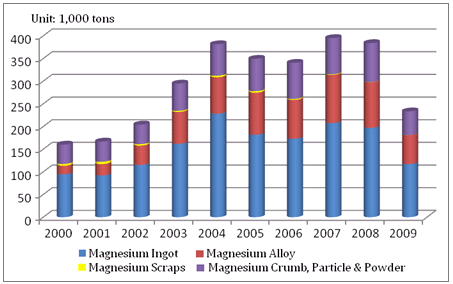
China’s Export Volume of Magnesium Products, 2000-2009

Source: ResearchInChina
The export of magnesium products of all kinds amounted to 233,500 tons in total in 2009, down 41.09% yr-on-yr; and the export value accumulated to US$646 million, decreasing 61.37% yr-on-yr. The drop in China’s export volume of magnesium products during 2008-2009, especially sharp fall in export volume in 2009, resulted from global financial crisis and foreign demand depression.
The report analyzes the development course of China’s magnesium and magnesium alloy industry, market trend, export, and operation of key companies, and discusses the status quo and future development trend of China magnesium industry.
第一章 镁概述
1.1 镁定义以及用途
1.1.1 定义
1.1.2 用途
1.2 镁行业产业链
第二章 中国镁行业发展概况
2.1 中国镁资源分布
2.2 中国镁产量状况分析
2.3 中国镁消费状况分析
2.3.1 消费结构分析
2.3.2 消费状况分析
2.4 中国镁行业发展现状
2.5 中国镁行业竞争格局
第三章 中国镁出口情况
3.1 出口状况分析
3.2 出口国家分析
3.3 出口价格分析
第四章 中国镁市场价格分析
第五章 中国镁合金市场分析
5.1 镁合金定义及应用
5.1.1 定义
5.1.2 应用
5.2 中国镁合金行业发展概况
5.2.1 产量分析
5.2.2 需求量分析
5.3 中国镁合金行业发展现状及趋势
第六章 重点企业分析
6.1 太原市同翔金属镁有限公司
6.1.1 公司简介
6.1.2 公司主要产品
6.1.3 镁产量分析
6.1.4 发展战略
6.2 银光镁业
6.2.1 公司简介
6.2.2 公司主要产品
6.2.3 镁产量分析
6.2.4公司经营状况分析
6.2.5 公司重点项目分析
6.2.6 公司发展战略
6.3 宁夏惠冶镁业
6.3.1 公司简介
6.3.2 公司产品
6.3.3 产品产量分析
6.3.3 公司经营状况分析
6.3.4 公司发展战略
6.4 宏富镁业
6.4.1 公司简介
6.4.2 公司发展动态
6.4.3 公司发展战略
6.5 华亿镁业
6.5.1 公司简介
6.5.2 公司发展历程
6.6 云海金属
6.6.1 公司简介
6.6.2 经营状况分析
6.6.3 公司新建项目
6.6.4 公司发展战略
第七章 中国镁行业机会与风险分析
7.1 机会分析
7.2 风险分析
1. Profile of Magnesium
1.1 Definition & Application
1.1.1 Definition
1.1.2 Application
1.2 Industry Chain
2. Development of China’s Magnesium Industry
2.1 Distribution of Magnesium Resources
2.2 Magnesium Output
2.3 Magnesium Consumption
2.3.1 Consumption Structure
2.3.2 Consumption Status
2.4 Current Development
2.5 Competition Patterns
3 China’s Magnesium Export
3.1 Export
3.2 Export Destinations
3.3 Export Price
4. China’s Magnesium Market Price
5 China’s Magnesium Alloy Market
5.1 Definition & Application of Magnesium Alloy
5.1.1 Definition
5.1.2 Application
5.2 Development of Magnesium Alloy Industry
5.2.1 Output
5.2.2 Demand
5.3 Current Development and Trends
6. Key Companies
6.1 Taiyuan Tongxiang Magnesium
6.1.1 Profile
6.1.2 Main Products
6.1.3 Magnesium Output
6.1.4 Development Strategies
6.2 Yinguang Magnesium
6.2.1 Profile
6.2.2 Main Products
6.2.3 Magnesium Output
6.2.4 Operation
6.2.5 Key Projects
6.2.6 Development Strategies
6.3 Ningxia Hui-ye Magnesium
6.3.1 Profile
6.3.2 Products
6.3.3 Output by Product
6.3.3 Operation
6.3.4 Development Strategies
6.4 Hongfu Magnesium Industry
6.4.1 Profile
6.4.2 Latest Advances
6.4.3 Development Strategies
6.5 Ningxia Huayi Magnesium
6.5.1 Profile
6.5.2 Development Course
6.6 Nanjing Yunhai Special Metals
6.6.1 Profile
6.6.2 Operation
6.6.3 Newly-built Projects
6.6.4 Development Strategies
7. Opportunities and Risks in China’s Magnesium Industry
7.1 Opportunities
7.2 Risks
图1-1 镁行业产业链结构
图2-1 2006年全球菱镁矿主要分布国家及储量(单位:百万吨)
图2-2 2006年中国菱镁矿和白云石已探明储量对比(单位:十亿吨)
图2-3 1998-2008年全球原镁产量变化(单位:千吨)
图2-4 2008年中国镁产量占全球市场份额
图2-5 1999-2009年中国原镁产量变化(单位:千吨)
图2-6 2009年1-12月中国原镁产量变化(单位:千吨)
图2-7 2009年1-11月中国镁主产区产量及同比变化(单位:千吨)
图2-8 2008年中国镁消费结构
图2-9 2001-2008年中国镁消费量变化(单位:千吨)
图2-10 2000-2008年中国各个领域对镁消费情况
图2-11 2009年中国主要镁生产商原镁产能对比(单位:千吨)
图3-1 2000-2009年中国镁产品出口量统计(单位:千吨)
表3-1 中国金属镁出口退税、关税调整
图3-2 2009年中国镁产品出口分布
图3-3 2009年8月8日-2010年2月8日中国金属镁离岸价格走势(单位:美元/吨)
图4-1 2007年10月26日-2010年2月3日中国金属镁市场价格变化(千元/吨)
图5-1 2005-2008年中国镁合金产量变化(单位:千吨)
图5-2 2009年中国镁合金应用领域分布
图5-3 2003-2008年中国镁合金需求量变化(单位:千吨)
表6-1 银光镁业主要产品
表6-2银光镁业主要产品产能情况
图6-1 2007-2010年银光镁业销售收入变化及预期(单位:百万元)
表6-3 2009年银光镁业重点项目建设情况
表6-4 惠冶镁业主要产品产能情况
图6-2 2008-2009年惠冶镁业销售收入变化及2010年预期(单位:百万元)
表6-5 华亿镁业发展历程
图6-3 云海金属镁工厂分布图
图6-4 2006-2009年前三季度云海金属营业收入与净利润变化(单位:百万元)
图6-5 2008年与2009年上半年云海金属主营业务收入构成变化
图6-6 2008年与2009年上半年云海金属主营业务分地区构成
Structure of Magnesium Industry Chains
Magnesite Reserves in Countries, 2006
Comparison between Magnesite and Dolomite Proven Reserves in China, 2006
Global Primary Magnesium Output, 1998-2008
Share of China Magnesium Output in Global Market, 2008
China’s Primary Magnesium Output, 1999-2009
China’s Primary Magnesium Output, Jan-Dec, 2009
Key Magnesium Production Areas in China and YoY Changes, Jan-Nov, 2009
China’s Magnesium Consumption Structure, 2008
China’s Magnesium Consumption, 2001-2008
China’s Magnesium Consumption by Field, 2000-2008
Primary Magnesium Output Capacity of China’s Key Magnesium Producers, 2009
China’s Export Volume of Magnesium Products, 2000-2009
China’s Metal Magnesium Export Tax Rebates and Tariff Adjustments
China’s Magnesium Products Export Distribution, 2009
China’s Metal Magnesium FOB Price Trend, Aug 8, 2009-Feb 8, 2010
China’s Metal Magnesium Market Prices, Oct 26, 2007-Feb 3, 2010
China’s Output of Magnesium Alloys, 2005-2008
China’s Magnesium Alloy Application Fields, 2009
China’s Demand for Magnesium Alloys, 2003-2008
Main Products of Yingang Magnesium
Output Capabilities of Yingang Magnesium’s Main Products
Sales Revenue and Forecast of Yinguang Magnesium, 2007-2010
Construction of Yingang Magnesium’s Key Projects, 2009
Output Capabilities of Ningxia Huiye Magnesium’s Main Products
Sales Revenue of Ningxia Huiye Magnesium, 2008-2009 & Forecast to 2010
Development Course of Ningxia Huayi Magnesium
Magnesium Plants Distribution of Nanjing Yunhai Special Metals
Operating Revenue and Net Profit of Nanjing Yunhai Special Metals, 2006-Q32009
Main Business Revenue Structure of Nanjing Yunhai Special Metals, 2008 & H12009
Main Business Structure of Nanjing Yunhai Special Metals by Region, 2008 & H12009
如果这份报告不能满足您的要求,我们还可以为您定制报告,请 留言说明您的详细需求。
|