|
|
|
报告导航:研究报告—
金融与服务业—房地产
|
|
2009-2010年中国商业地产行业研究报告 |
 |
字数:3.6万 |
页数:102 |
图表数:98 |
|
中文电子版:6000元 |
中文纸版:3000元 |
中文(电子+纸)版:6500元 |
|
英文电子版:2000美元 |
英文纸版:1900美元 |
英文(电子+纸)版:2300美元 |
|
编号:JD002
|
发布日期:2010-07 |
附件:下载 |
 |
|
|
商业地产,又叫商务地产,是指通过合理运营实现房地产升值获取回报的房地产投资品。根据使用用途划分,商务地产可以分为写字楼和商业用房等子行业业态。
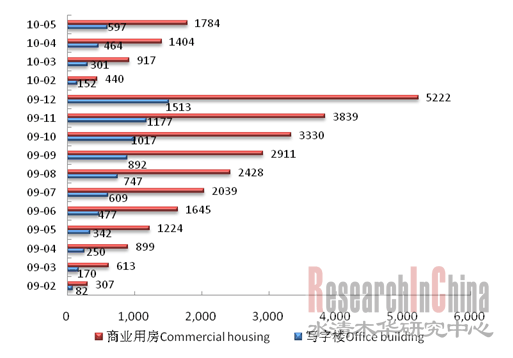
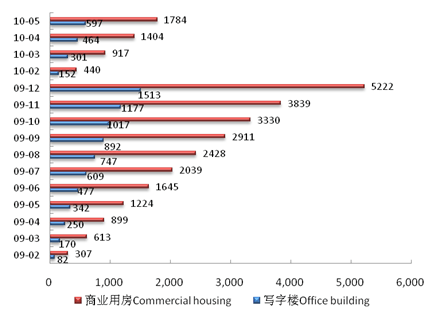
2009年中国经济复苏,商业房地产市场随之升温,销售额与销售面积逐月攀升。进入2010年后,政府加大对楼市的调控力度,频繁出台调控政策,住宅市场迅速降温。不少开发商与投资客纷纷转而投向受新政影响较小的商务地产,使得商务地产逆市上扬,销售面积大幅增长。1-5月,写字楼销售面积累计同比增长74.5%,商业用房累计同比增长45.7%,远远高于商品住宅销售面积19.9%的增幅。
图:2009-2010年中国写字楼和商业用房各月累计销售面积(万平米)

来源:国家统计局;整理:水清木华研究中心
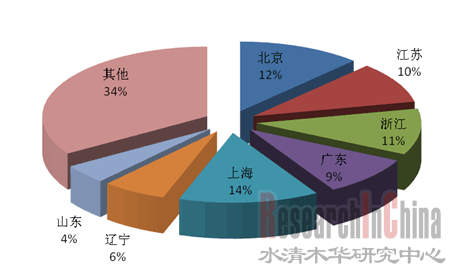
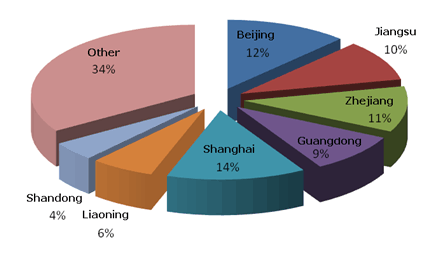
一般而言,商务地产较发达的地区多半是经济发展水平和对外开放程度较高、商业氛围浓厚的地区,如北京、上海、深圳等。这些地区的需求旺盛,租赁、买卖活跃,项目品质优良,其它的二三线城市较之尚有很大差距。2009年,在全国写字楼总投资额中,所占比重排名前五的省市分别是上海、北京、浙江、江苏、广东,比重之和达到56%。
图:2009年全国重点省市写字楼投资额分布

来源:国家统计局;整理:水清木华研究中心
本报告分析了近年来商务地产行业的相关政策、供求状况与投融资情况,着重分析了包括北京市、上海市、广东省、天津市、浙江省等在内的15个省市的商务地产发展情况,力图勾勒出中国各地商务地产行业发展的总貌,梳理出区域行业发展轨迹与趋势。最后,本报告还深入研究了中国重点商业地产企业的经营情况及发展趋势,包括大连万达、新鸿基地产、中国国贸、SOHO中国等。
Commercial real estate, also known as business real estate, refers to those real estate investment goods that can generate benefits in the form of property appreciation via reasonable operation. Business real estate can be divided by use into sub-industries such as office building, commercial housing, etc.
Along with the economic recovery of China in 2009, commercial real estate market showed robust trend with the sales and areas sold soaring month by month. Entering the year of 2010, Chinese Government strengthens the regulation and control over real estate market, frequently releasing regulation policies, which seriously dampens the housing market. In consequence, quite a few developers and investors have successively transferred to slightly-influenced business real estate, which brings along the uptrend of business real estate as well as the substantial increase of areas sold. From January to May, 2010, the accumulative areas sold of office building rose 74.5% year-on-year while that of commercial housing was up 45.7% year-on-year, much higher than the 19.9% growth of the areas sold of commercial residential buildings.
Monthly Accumulated Sold Areas of Office Building and Commercial Housing in China, 2009-2010 (10K M2)

Source: ResearchInChina
Generally speaking, the regions with relatively developed business real estate are mostly regions with higher level of economic development & opening-up degree and strong business climate, e.g. Beijing, Shanghai, Shenzhen, etc., where there are the blooming demand, active leasing & deals, and good project quality, shaping great disparity with the second and third-tier cities. In 2009, Shanghai, Beijing, Zhejiang, Jiangsu and Guangdong ranked the Top 5 in the gross investment of office building nationwide with the total proportion amounting to 56%.
Investment Distribution of Office Buildings in Key Provinces & Cities, China, 2009

Source: ResearchInChina
This report casts light on relevant policies, supply & demand and investment & financing of business real estate industry in recent years, and highlights analysis on the development of business real estate in 15 provinces and cities including Beijing, Shanghai, Guangdong, Tianjin, and Zhejiang, striving to outline the overall development of business real estate all over China as well as the development track and trend of regional industry. At length, the report probes deeply into the operation and development trend of key enterprises in China, such as Dalian Wanda, Sun Hung Kai Properties, China World Trade Center, SOHO China, etc.
第一章 中国商务房地产行业基本情况
1.1 商务房地产的定义及分类
1.2 商务地产业在城市经济中的地位
1.3 商务地产行业特点
1.4 商务地产经营模式
第二章 2009-2010年商务房地产行业政策环境分析
2.1 房地产行业主要政策回顾
2.2 2009-2010年商务房地产行业主要政策分析
第三章 2009-2010年商务房地产行业发展情况分析
3.1 2009-2010年中国商务房地产市场供给情况分析
3.1.1 商务房地产开发规模
3.1.2 商务房地产结构分析
3.2 2009-2010年中国商务房地产市场需求情况分析
3.3 2009-2010年中国商务房地产市场供需关系分析
第四章 2009-2010年商务地产投融资情况
4.1 2009-2010年商务地产投资状况
4.2 2009-2010年商务地产融资情况
4.2.1 房地产开发资金来源分析
4.2.2 融资方式剖析
第五章 2009-2010年商务地产重点省市发展分析
5.1 整体情况分析
5.2 北京市商务房地产行业发展情况
5.2.1 北京市商务房地产行业运行状况
5.2.2 北京市商务地产发展趋势
5.3 上海市商务房地产行业发展情况
5.3.1 上海市商务房地产行业运行状况
5.3.2 上海市商务地产发展趋势
5.4 天津市商务房地产行业发展情况
5.4.1 天津市商务房地产行业运行状况
5.4.2 天津市商务地产发展趋势
5.5 广东省商务房地产行业发展情况
5.5.1 广东省商务房地产行业运行状况
5.5.2 广东省商务地产发展趋势
5.6 浙江省商务房地产行业发展情况
5.6.1 浙江省商务房地产行业运行状况
5.6.2 浙江省商务地产发展趋势
5.7 江苏省商务房地产行业发展情况
5.7.1 江苏省商务房地产行业运行状况
5.7.2 江苏省商务地产发展趋势
5.8 深圳市商务房地产行业发展情况
5.8.1 深圳市商务房地产行业运行状况
5.8.2 深圳市商务地产行业发展趋势
5.9 辽宁省商务房地产行业发展情况
5.9.1 辽宁省商务房地产行业运行状况
5.9.2 辽宁省商务地产行业发展趋势
5.10 山东省商务房地产行业发展情况
5.10.1 山东省商务房地产行业运行状况
5.10.2 山东省商务地产行业发展趋势
5.11 重庆市商务房地产行业发展情况
5.11.1 重庆市商务房地产行业运行状况
5.11.2 重庆市商务地产行业发展趋势
5.12 福建省商务房地产行业发展情况
5.12.1 福建省商务房地产行业运行状况
5.12.2 福建省商务房地产行业发展趋势
5.13 四川省商务房地产行业发展情况
5.13.1 四川省商务房地产行业运行状况
5.13.2 四川省商务房地产行业发展趋势
5.14 湖南省商务房地产行业发展情况
5.14.1 湖南省商务房地产行业运行状况
5.14.2 湖南省商务房地产行业发展趋势
5.15 湖北省商务房地产行业发展情况
5.15.1 湖北省商务房地产行业运行状况
5.15.2 湖北省商务房地产行业发展趋势
5.16 陕西省商务房地产行业发展情况
5.16.1 陕西省商务房地产行业运行状况
5.16.2 陕西省商务房地产行业发展趋势
第六章 2009-2010年商务地产行业重点企业分析
6.1 企业整体发展情况分析
6.2 上海世茂股份有限公司
6.2.1 企业简介
6.2.2 企业经营情况
6.2.3 企业发展规划
6.3 金融街控股股份有限公司
6.3.1 企业简介
6.3.2 企业经营情况
6.3.3 企业发展规划
6.4 中国国际贸易中心股份有限公司
6.4.1 企业简介
6.4.2 企业经营情况
6.4.3 企业发展规划
6.5 上海金桥出口加工区开发股份有限公司
6.5.1 企业简介
6.5.2 企业经营情况
6.5.3 企业发展规划
6.6 上海张江高科技园区开发股份有限公司
6.6.1 企业简介
6.6.2 企业经营情况
6.6.3 企业发展规划
6.7 大连万达商业地产股份有限公司
6.7.1 企业简介
6.7.2 发展概况
6.8 宝龙地产控股有限公司
6.8.1 企业简介
6.8.2 企业经营情况
6.8.3 企业发展规划
6.9 新鸿基地产发展有限公司
6.9.1 企业简介
6.9.2 企业经营情况
6.9.3 企业发展规划
6.10 SOHO中国有限公司
6.10.1 企业简介
6.10.2 企业经营情况
6.10.3 企业发展规划
第七章 中国商务地产发展趋势
1 Overview of Business Real Estate in China
1.1 Definition & Classification
1.2 Position
1.3 Characteristics
1.4 Operation Mode
2 Policy Environment of Business Real Estate, 2009-2010
2.1 Review of Major Policies
2.2 Main Policies during 2009-2010
3 Development of Business Real Estate, 2009-2010
3.1 Supply
3.1.1 Development Scale
3.1.2 Structure
3.2 Demand
3.3 Supply & Demand Relationship
4 Investment and Financing of Business Real Estate, 2009-2010
4.1 Investment
4.2 Financing
4.2.1 Capital Source
4.2.2 Financing Way
5 Development of Business Real Estate in Key Provinces and Cities, 2009-2010
5.1 Overview
5.2 Beijing
5.2.1 Operation
5.2.2 Development Trend
5.3 Shanghai
5.3.1 Operation
5.3.2 Development Trend
5.4 Tianjin
5.4.1 Operation
5.4.2 Development Trend
5.5 Guangdong
5.5.1 Operation
5.5.2 Development Trend
5.6 Zhejiang
5.6.1 Operation
5.6.2 Development Trend
5.7 Jiangsu
5.7.1 Operation
5.7.2 Development Trend
5.8 Shenzhen
5.8.1 Operation
5.8.2 Development Trend
5.9 Liaoning
5.9.1 Operation
5.9.2 Development Trend
5.10 Shandong
5.10.1 Operation
5.10.2 Development Trend
5.11 Chongqing
5.11.1 Operation
5.11.2 Development Trend
5.12 Fujian
5.12.1 Operation
5.12.2 Development Trend
5.13 Sichuan
5.13.1 Operation
5.13.2 Development Trend
5.14 Hunan
5.14.1 Operation
5.14.2 Development Trend
5.15 Hubei
5.15.1 Operation
5.15.2 Development Trend
5.16 Shaanxi
5.16.1 Operation
5.16.2 Development Trend
6 Key Enterprises of Business Real Estate , 2009-2010
6.1 Overview
6.2 Shanghai Shimao Co., Ltd.
6.2.1 Profile
6.2.2 Operation
6.2.3 Development Planning
6.3 Financial Street Holding Co., Ltd.
6.3.1 Profile
6.3.2 Operation
6.3.3 Development Planning
6.4 China World Trade Center
6.4.1 Profile
6.4.2 Operation
6.4.3 Development Planning
6.5 Shanghai Jinqiao Export Processing Zone Development Co., Ltd.
6.5.1 Profile
6.5.2 Operation
6.5.3 Development Planning
6.6 Shanghai Zhangjiang Hi-Tech Park Development Co., Ltd.
6.6.1 Profile
6.6.2 Operation
6.6.3 Development Planning
6.7 Dalian Wanda Commercial Properties Co., Ltd.
6.7.1 Profile
6.7.2 Development
6.8 Powerlong Real Estate Holdings Limited
6.8.1 Profile
6.8.2 Operation
6.8.3 Development Planning
6.9 Sun Hung Kai Properties Limited
6.9.1 Profile
6.9.2 Operation
6.9.3 Development Planning
6.10 SOHO China
6.10.1 Profile
6.10.2 Operation
6.10.3 Development Planning
7 Development Trend of China Business Real Estate
表:商务地产行业分类
图:商务地产子行业投资占房地产投资总额的比重
表:商务地产经营模式
表:2003-2010年房地产行业主要政策
表:2009-2010年房屋新开工面积和竣工面积
表:2009-2010年写字楼新开工面积和竣工面积
表:2009-2010年商业用房新开工面积和竣工面积
图:2007-2009年各类型物业供给(新开工面积)占比
图:2007-2009年各类型物业供给(竣工面积)占比
表:2009-2010年中国商品房销售面积与销售额
表:2009-2010年中国写字楼销售面积与销售额
表:2009-2010年中国商业用房销售面积与销售额
图:2000-2009年中国写字楼销竣比
表:2009-2010年房地产开发投资总额
图:2009-2010年各类型房地产投资月度累计额增速
图:2000-2009年房地产开发企业资金来源合计及增速
图:2004-2009年房地产开发企业资金来源结构
表:2009-2010年房地产开发其他资金来源构成
图:2009年全国重点省份写字楼投资额所占比重
图:2000-2009年北京市写字楼新开工面积及竣工面积
图:2004-2009年北京市写字楼销售面积
图:2008与2009年北京市甲级写字楼空置率月度走势
图:2009-2010年北京市甲级写字楼租金月度走势
图:2000-2009年上海市写字楼新开工面积及竣工面积
图:2003-2009年上海市写字楼销售面积
图:2008与2009年上海市甲级写字楼租金月度走势对比
图:2000-2009年天津市写字楼新开工面积及竣工面积
图:2003-2009年天津市写字楼销售面积
图:2000-2009年天津市写字楼平均销售价格
图:2008-2010年各季度广东省写字楼累计投资完成额
图:2004-2009年广东省写字楼销售面积
图:2008与2009年广州市甲级写字楼空置率月度走势对比
图:2008与2009年广州市甲级写字楼租金月度走势对比
图:2000-2009年浙江省写字楼新开工面积及竣工面积
图:2004-2009年浙江省写字楼销售面积
图:2001-2008年浙江省写字楼平均销售价格
图:2000-2009年江苏省写字楼新开工面积及竣工面积
图:2004-2009年江苏省写字楼销售面积
图:2001-2008年江苏省写字楼平均销售价格
图:2002-2008年深圳市写字楼投资完成额
图:2009-2010年深圳市甲级写字楼空置率月度走势
图:2009-2010年深圳市甲级写字楼租金月度走势
图:2003-2009年辽宁省写字楼投资完成额
图:2000-2009年辽宁省写字楼新开工面积与竣工面积
图:2009-2010年辽宁省写字楼各月销售面积
图:2000-2009年山东省写字楼投资完成额
图:2001-2009年山东省写字楼新开工面积与竣工面积
图:2003-2009年山东省写字楼销售面积
图:2000-2009年重庆市写字楼投资完成额
图:2000-2009年重庆市写字楼新开工面积与竣工面积
图:2009-2010年重庆市写字楼各月销售面积
图:2000-2009年福建省写字楼投资完成额
图:2000-2009年福建省写字楼新开工面积与竣工面积
图:2009-2010年福建省写字楼各月销售面积
图:2000-2009年四川省写字楼投资完成额
图:2000-2009年四川省写字楼新开工面积与竣工面积
图:2009-2010年四川省写字楼各月销售面积
图:2000-2009年湖南省写字楼投资完成额
图:2000-2009年湖南省写字楼新开工面积与竣工面积
图:2003-2009年湖南省写字楼销售面积
图:2000-2009年湖北省写字楼投资完成额
图:2001-2009年湖北省写字楼新开工面积与竣工面积
图:2003-2009年湖北省写字楼销售面积
图:2000-2009年陕西省写字楼投资完成额
图:2001-2009年陕西省写字楼新开工面积与竣工面积
图:2003-2009年陕西省写字楼销售面积
图:2006-2009年世茂股份营业收入及增速
图:2009年世茂股份(分产品)营收结构
表:2009年金融街公司土地储备
图:2009年金融街公司土地储备(分地区)结构
表:2010-2012年世茂股份总体经营规划目标
表:2010-2012年世茂股份计划新开工面积
表:2010-2012年世茂股份计划竣工面积
图:2006-2009年金融街营业收入及增速
图:2007-2009年金融街(分产品)营收结构
表:2009年金融街商务地产项目建筑面积
图:2009年金融街商务地产建筑面积(分地区)结构图
图:2007-2009年中国国贸营业收入及营业利润率
表:2009年中国国贸主营收入构成
图:2007-2009年中国国贸(分产品)营收结构
图:2007-2009年中国国贸写字楼、商场和公寓月租金
图:2007-2009年中国国贸写字楼、商场和公寓出租率
图:2007-2009年浦东金桥营业收入及营业利润率
图:2007-2009年浦东金桥(分产品)营收结构
图:2007-2009年浦东金桥(分产品)毛利率
图:2006-2009年张江高科营业收入及增速
图:2007-2009年张江高科(分产品)营收结构
图:2007-2009年张江高科(分产品)毛利率
表:大连万达商务地产已建项目总建筑面积
图:大连万达商务地产已建项目总建筑面积(分地区)结构图
表:大连万达商务地产在建项目总建筑面积
图:2006-2009年宝龙地产营业收入及增速
图:2008-2009年宝龙地产(分产品)营收结构
表:2009年宝龙地产已竣工及交付项目面积及收入
表:新鸿基地产在香港的土地储备
表:新鸿基地产在中国内地的土地储备
图:2006-2009年新鸿基地产营业收入及增速
图:2009年度新鸿基地产香港土地储备情况
图:2009年度新鸿基地产内地土地储备情况
表:2009-2012年新鸿基地产主要发展中内地项目
图:2005-2009年SOHO中国营业收入及增速
表:2009年SOHO中国商务地产项目合同销售情况
表:SOHO中国正在开发、尚未销售或尚未交付项目
表:2009年SOHO中国新收购项目
图:各种物业业态销售额增速比较
Classification of Business Real Estate Industry
Proportion of Business Real Estate Sub-industry Investment in Total Investment of Real Estate
Operation Mode of Business Real Estate
Major Policies on Real Estate Industry, 2003-2010
Newly-started Construction Areas and Completed Areas of Housing, 2009-2010
Newly-started Construction Areas and Completed Areas of Office Buildings, 2009-2010
Newly-started Construction Areas and Completed Areas of Commercial Housing, 2009-2010
Supply (Newly-started Construction Areas) Proportion of All Types of Property, 2007-2009
Supply (Completed Areas) Proportion of All Types of Property, 2007-2009
Areas Sold and Sales of Commercial Residential Building in China, 2009-2010
Areas Sold and Sales of Office Building in China, 2009-2010
Areas Sold and Sales of Commercial Housing in China, 2009-2010
Ratio of Areas Sold to Completed Areas of Office Building in China, 2000-2009
Gross Investment of Real Estate Development, 2009-2010
Growth Rate of Monthly Accumulative Investment in All Types of Real Estate, 2009-2010
Total and Growth Rate of Capital Source of Real Estate Developers, 2000-2009
Capital Source Structure of Real Estate Developers, 2004-2009
Other Capital Source Structure of Real Estate Development, 2009-2010
Investment Proportion of Office Buildings in National Key Provinces, 2009
Newly-started Construction Areas and Completed Areas of Office Building in Beijing, 2000-2009
Areas Sold of Office Building in Beijing, 2004-2009
Monthly Trend of Vacancy Rate of Grade A Office Building in Beijing, 2008 vs. 2009
Monthly Trend of Grade A Office Building Rental in Beijing, 2009-2010
Newly-started Construction Areas and Completed Areas of Office Building in Shanghai, 2000-2009
Areas Sold of Office Building in Shanghai, 2003-2009
Monthly Trend of Grade A Office Building Rental in Shanghai, 2008 vs. 2009
Newly-started Construction Areas and Completed Areas of Office Building in Tianjin, 2000-2009
Areas Sold of Office Building in Tianjin, 2003-2009
Average Sales Price of Office Building in Tianjin, 2000-2009
Accumulative Fulfilled Investment of Office Building in Guangdong by Quarter, 2008-2010
Areas Sold of Office Building in Guangdong, 2004-2009
Monthly Trend of Vacancy Rate of Grade A Office Building in Guangzhou, 2008 vs. 2009
Monthly Trend of Grade A Office Building Rental in Guangzhou, 2008 vs. 2009
Newly-started Construction Areas and Completed Areas of Office Building in Zhejiang, 2000-2009
Areas Sold of Office Building in Zhejiang, 2004-2009
Average Sales Price of Office Building in Zhejiang, 2001-2008
Newly-started Construction Areas and Completed Areas of Office Building in Jiangsu, 2000-2009
Areas Sold of Office Building in Jiangsu, 2004-2009
Average Sales Price of Office Building in Jiangsu, 2001-2008
Fulfilled Investment of Office Building in Shenzhen, 2002-2008
Monthly Trend of Vacancy Rate of Grade A Office Building in Shenzhen, 2009 vs. 2010
Monthly Trend of Grade A Office Building Rental in Shenzhen, 2009-2010
Fulfilled Investment of Office Building in Liaoning, 2003-2009
Newly-started Construction Areas and Completed Areas of Office Building in Liaoning, 2000-2009
Monthly Areas Sold of Office Building in Liaoning, 2009-2010
Fulfilled Investment of Office Building in Shandong, 2000-2009
Newly-started Construction Areas and Completed Areas of Office Building in Shandong, 2001-2009
Areas Sold of Office Building in Shandong, 2003-2009
Fulfilled Investment of Office Building in Chongqing, 2000-2009
Newly-started Construction Areas and Completed Areas of Office Building in Chongqing, 2000-2009
Monthly Areas Sold of Office Building in Chongqing, 2009-2010
Fulfilled Investment of Office Building in Fujian, 2000-2009
Newly-started Construction Areas and Completed Areas of Office Building in Fujian, 2000-2009
Monthly Areas Sold of Office Building in Fujian, 2009-2010
Fulfilled Investment of Office Building in Sichuan, 2000-2009
Newly-started Construction Areas and Completed Areas of Office Building in Sichuan, 2000-2009
Monthly Areas Sold of Office Building in Sichuan, 2009-2010
Fulfilled Investment of Office Building in Hunan, 2000-2009
Newly-started Construction Areas and Completed Areas of Office Building in Hunan, 2000-2009
Areas Sold of Office Building in Hunan, 2003-2009
Fulfilled Investment of Office Building in Hubei, 2000-2009
Newly-started Construction Areas and Completed Areas of Office Building in Hubei, 2001-2009
Areas Sold of Office Building in Hubei, 2003-2009
Fulfilled Investment of Office Building in Shaanxi, 2000-2009
Newly-started Construction Areas and Completed Areas of Office Building in Shaanxi, 2001-2009
Areas Sold of Office Building in Shaanxi, 2003-2009
Operating Income and Growth Rate of Shanghai Shimao, 2006-2009
Operating Income Structure of Shanghai Shimao (by Product), 2009
Land Reserve of Financial Street Holding Co., Ltd., 2009
Land Reserve (by Region) Structure of Financial Street Holding Co., Ltd., 2009
Overall Business Planning Target of Shanghai Shimao, 2010-2012
Planned Newly-started Construction Areas of Shanghai Shimao, 2010-2012
Planned Completed Areas of Shanghai Shimao, 2010-2012
Operating Income and Growth Rate of Financial Street Holding, 2006-2009
Operating Income Structure of Financial Street Holding (by Product), 2007-2009
Building Areas of Business Real Estate Project of Financial Street Holding, 2009
Building Areas (by Region) Structure Chart of Business Real Estate Project of Financial Street Holding, 2009
Operating Income and Operating Margin of China World Trade Center, 2007-2009
Prime Operating Revenue Structure of China World Trade Center, 2009
Operating Income Structure of China World Trade Center (by Product), 2007-2009
Monthly Rental of Office Building, Shopping Mall and Apartment of China World Trade Center, 2007-2009
Occupancy Rate of Office Building, Shopping Mall and Apartment of China World Trade Center, 2007-2009
Operating Income and Operating Margin of Pudong Jinqiao, 2007-2009
Operating Income Structure of Pudong Jinqiao (by Product), 2007-2009
Gross Margin of Pudong Jinqiao (by Product), 2007-2009
Operating Income and Growth Rate of Zhangjiang Hi-Tech, 2006-2009
Operating Income Structure of Zhangjiang Hi-Tech (by Product), 2007-2009
Gross Margin of Zhangjiang Hi-Tech (by Product), 2007-2009
Total Building Areas of Built Projects of Dalian Wanda Commercial Properties
Total Building Areas (by Region) Structure Chart of Built Projects of Dalian Wanda Commercial Properties
Total Building Areas of Projects under Construction of Dalian Wanda Commercial Properties
Operating Income and Growth Rate of Powerlong Real Estate, 2006-2009
Operating Income Structure of Powerlong Real Estate (by Product), 2008-2009
Area and Revenue of Construction Completed and Delivered Projects of Powerlong Real Estate, 2009
Land Reserve of Sun Hung Kai Properties in Hong Kong
Land Reserve of Sun Hung Kai Properties in Mainland China
Operating Income and Growth Rate of Sun Hung Kai Properties, 2006-2009
Land Reserve of Sun Hung Kai Properties in Hong Kong, 2009
Land Reserve of Sun Hung Kai Properties in Mainland China, 2009
Major Developing Projects of Sun Hung Kai Properties in Mainland China, 2009-2012
Operating Income and Growth Rate of SOHO China, 2005-2009
Contract Sale of Business Real Estate Project of SOHO China, 2009
On-going Projects and Ones Not Yet Sold and Not Yet Delivered of SOHO China
Newly Purchased Projects of SOHO China, 2009
Sales Growth Rates of Various Properties
如果这份报告不能满足您的要求,我们还可以为您定制报告,请 留言说明您的详细需求。
|