|
|
|
报告导航:研究报告—
金融与服务业—金融业
|
|
2009-2010年中国证券行业研究报告 |
 |
字数:3.2万 |
页数:102 |
图表数:105 |
|
中文电子版:6000元 |
中文纸版:3000元 |
中文(电子+纸)版:6500元 |
|
英文电子版:1900美元 |
英文纸版:1800美元 |
英文(电子+纸)版:2200美元 |
|
编号:JD004
|
发布日期:2010-09 |
附件:下载 |
 |
|
|
截止2010年6月底,中国共有证券公司106家,证券从业人员16万人。在地区分布方面,北京、上海和广东地区的证券公司数量最多,分别是17家、14家和23家,合计占比50.5%。其次是江苏、四川、福建等省份。
图:2010年中国证券公司地区分布 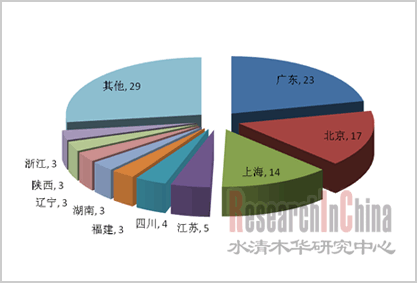 整理:水清木华研究中心 2009年中国证券公司实现营业收入共计2053亿元,其中经纪业务收入1429亿元,占比69.6%。经纪业务比重过高使得证券公司的收入结构不佳,易受股市行情波动影响。2010年上半年市场环境不好,使得证券公司的经纪业务与自营业务收入出现大幅下滑,投行业务成为唯一亮点。
图:2009年部分券商经纪业务(Securities brokerage)收入占比 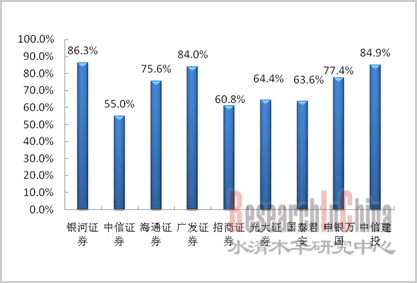 来源:证券业协会;整理:水清木华研究中心 在中国证券行业蓬勃发展的形势下,国外的投资银行也纷纷进军中国市场。外资投资银行主要通过两种方式在中国开展业务,一是在中国设立代表处等分支机构,主要业务是帮助中国企业在海外上市、担任财务顾问、开展B股交易等。另一种方式则是和中国企业合作成立合资证券公司,从而取得在中国证券市场开展证券经纪、证券承销等业务的资格。截止到2010年6月,中国境内共有9家外资参股证券公司。
表:中国外资参股证券公司名单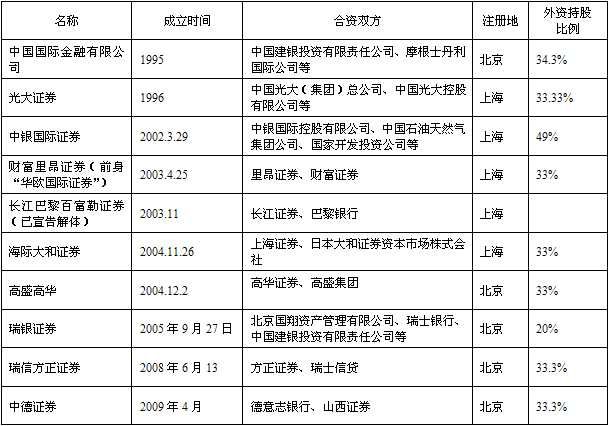 来源:中国证监会;整理:水清木华研究中心
The end of June 2010 saw a total of 106 securities companies and 160, 000 employees in Chinese securities industry. In regard to regional distribution, Beijing, Shanghai and Guangdong possess the largest quantity of securities companies by 17, 14 and 23, respectively, a share of altogether 50.5%, followed by Jiangsu, Sichuan, Fujian, etc.
Regional Distribution of Securities Companies in China, 2010 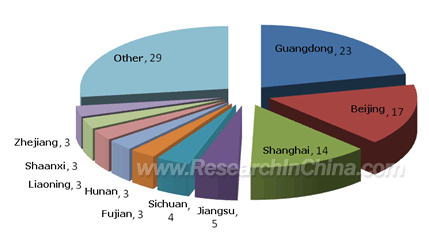 Source: ResearchInChina In 2009, the operating income of Chinese securities companies added up to RMB205.3 billion, of which the revenue from brokerage reached RMB142.9 billion, accounting for 69.6%. However, the high proportion of brokerage led to the unfavorable revenue structure of securities companies as well as the vulnerability to stock fluctuations. The bad market environment in the first half of 2010 caused a sharp drop in their earnings from brokerage and proprietary business, but the investment banking service was exclusively highlighted.
Brokerage Revenue Percentage of Partial Securities Companies, 2009 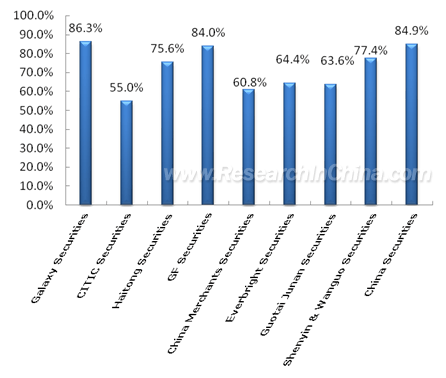 Source: Securities Association of China; ResearchInChina Against the vigorous development of Chinese securities industry, foreign investment banks successively enter the Chinese market and develop their business mainly through two means: 1) to set up branches like representative offices to assist Chinese enterprises in overseas listing, financial consultancy, B-share trading, etc.; 2) to join hands with Chinese enterprises to establish securities joint ventures so as to obtain the qualifications for such businesses as securities brokerage and underwriting in Chinese securities market. Up till June 2010, there were altogether 9 foreign-funded joint stock securities companies in China.
Foreign-funded Joint Stock Securities Companies in China
Source: CSRC; ResearchInChina
第一章 中国证券行业概况
1.1 中国证券行业发展概况
1.2中国证券公司发展概况
1.3 证券行业监管环境
1.4中国证券行业发展趋势
1.4.1行业监管日益规范
1.4.2券商盈利模式趋于多元化
1.4.3行业集中度依然较高
1.4.4金融同业竞争压力加大
第二章 中国证券市场传统业务竞争分析
2.1经纪业务
2.1.1 经纪业务发展概况
2.1.2 市场竞争格局
2.2 投资银行业务
2.2.1 股票承销
2.2.2 债券承销
2.3 资产管理业务
2.3.1 资产管理业务发展概况
2.3.2 中国证券公司资产管理业务竞争情况
2.4自营业务
第三章 中国证券行业创新业务发展情况
3.1 融资融券
3.2股指期货
3.3 直投业务
第四章 中国主要券商分析
4.1银河证券
4.1.1企业简介
4.1.2企业经营情况
4.2 中信证券
4.2.1公司简介
4.2.2企业经营情况
4.3 海通证券
4.3.1 企业简介
4.3.2 企业经营情况
4.4广发证券
4.4.1公司简介
4.4.2企业经营情况
4.5招商证券
4.5.1 企业简介
4.5.2 企业经营情况
4.6 华泰证券
4.6.1 企业简介
4.6.1 企业经营情况
4.7光大证券
4.7.1公司简介
4.7.2企业经营情况
4.8国泰君安证券
4.8.1企业简介
4.8.2企业经营情况
4.9申银万国证券公司
4.9.1企业简介
4.9.2企业经营情况
4.10中信建投证券
4.10.1公司简介
4.10.2企业经营情况
4.11 宏源证券
4.11.1公司简介
4.11.2企业经营情况
第五章 外资证券公司在华发展情况
5.1 外资参股证券公司发展概况
5.2 外资参股证券公司相关政策
5.3 外资参股证券公司业务开展情况
5.3.1 股票和债券承销业务
5.3.2 经纪业务
5.4 高盛高华
5.4.1 企业简介
5.4.2 企业经营情况
5.4.3 企业发展动态
5.5 瑞银证券
5.5.1 企业简介
5.5.2 企业经营情况
5.5.3 企业发展动态
5.6 中德证券
5.6.1 企业简介
5.6.2 企业经营情况
5.6.3 企业发展动态
1 Overview of China Securities Industry
1.1 Industry Development
1.2 Evolution of Securities Companies
1.3 Regulatory Environment
1.4 Development Trends
1.4.1 Increasingly Standardized Industry Regulation
1.4.2 Diversification of Profit Model
1.4.3 Still Higher Industrial Concentration
1.4.4 Intensification of Horizontal Competition
2 Traditional Business Competition in China Securities Market
2.1 Brokerage
2.1.1 Overview
2.1.2 Competition Pattern
2.2 Investment Banking Service
2.2.1 Stock Underwriting
2.2.2 Bond Underwriting
2.3 Asset Management
2.3.1 Overview
2.3.2 Competition
2.4 Proprietary Business
3 Innovation Business in China Securities Industry
3.1 Margin Trading and Securities Lending
3.2 Stock Index Futures
3.3 Direct Investment
4 Major Securities Companies in China
4.1 Galaxy Securities
4.1.1 Profile
4.1.2 Operation
4.2 CITIC Securities
4.2.1 Profile
4.2.2 Operation
4.3 Haitong Securities
4.3.1 Profile
4.3.2 Operation
4.4 GF Securities
4.4.1 Profile
4.4.2 Operation
4.5 China Merchants Securities
4.5.1 Profile
4.5.2 Operation
4.6 Huatai Securities
4.6.1 Profile
4.6.2 Operation
4.7 Everbright Securities
4.7.1 Profile
4.7.2 Operation
4.8 Guotai Junan Securities
4.8.1 Profile
4.8.2 Operation
4.9 Shenyin & Wanguo Securities
4.9.1 Profile
4.9.2 Operation
4.10 China Securities
4.10.1 Profile
4.10.2 Operation
4.11 Hongyuan Securities
4.11.1 Profile
4.11.2 Operation
5 Development in China of Foreign-funded Securities Companies
5.1 Overview
5.2 Policy
5.3 Business
5.3.1 Stock & Bond Underwriting
5.3.2 Brokerage
5.4 Goldman Sachs Gao Hua Securities
5.4.1 Profile
5.4.2 Operation
5.4.3 Development
5.5 UBS Securities
5.5.1 Profile
5.5.2 Operation
5.5.3 Development
5.6 Zhong De Securities
5.6.1 Profile
5.6.2 Operation
5.6.3 Development
图:2005-2010年中国沪深A股市场总市值
图:2009-2010年日均股票成交金额
图:2010年中国证券公司地区分布
表:2009年中国证券公司总资产排名
表:2009年中国证券公司营业收入排名
表:2010年中国上市证券公司的分类评级
表:证券行业制度列表
图:2006-2010年中国股票基金权证总成交量
图:2003-2010年A股有效帐户数及增速
图:2009年部分券商经纪业务收入占比
表:2009年证券公司股票基金交易额排名
表:2009年证券公司营业部平均代理买卖证券业务净收入
表:2010年上半年券商股票债券主承销份额及数量排名
表:2009年证券公司股票主承销金额及家数
图:2009年中国股票承销市场占有率情况
图:2010年上半年证券公司IPO承销金额及市场份额
表:2009年证券公司债券主承销家数及金额
图:2009年债券承销市场占有率情况
图:2008-2009年券商集合理财产品月度募集规模
表:2010年上半年上市券商集合理财产品规模对比
表:2009年度证券公司受托客户资产管理业务净收入前20名排名
表:2009年上市券商自营业务收入
表:2010年7月深交所融资融券余额及市场分额
图:2009年深交所各月平均融资融券余额
图:2010年上半年股指期货日均交易额
表:2010年上市券商股指期货佣金收入贡献对比
表:2010年部分证券公司直投业务开展情况
图:2005-2009年银河证券营业收入
图:2009年银河证券(分业务)营业收入及占比
图:2004-2009年银河证券股票基金交易总金额
图:2007-2009年银河证券经纪业务收入
图:2007-2009年银行证券股票债券承销净收入及比重
图:2007-2009年银河证券自营业务收入
图:2007-2009年中信证券营业收入、利润总额
表:2008-2009年中信证券各省市营业部数量以及营业收入
图:2009年中信证券(分业务)收入结构
表:2008-2009年中信证券经纪业务交易额
图:2008-2009年中信证券经纪业务收入
表:2009年中信证券承销次数、承销金额、承销收入
图:2008-2009年中信证券证券承销业务收入情况
表:2008-2009年中信证券证券投资业务收益
表:2008-2009年中信证券资产管理业务规模
图:2006-2010年海通证券营业收入及利润总额
表:2008-2009年海通证券各省市营业部数量及收入
图:2007-2009年海通证券(分业务)营收结构
表:2008-2009年海通证券代理买卖证券交易额及市场份额
表:2008-2009年海通证券投资银行业务收入明细
表:2008-2009年海通证券证券投资业务收益
图:2006-2010年广发证券营业收入及营业利润
图:2010年广发证券(分业务)营业收入及占比
表:2009-2010年广发证券各省市营业部数量及收入
表:2009-2010年广发证券代理买卖证券情况
图:2009-2010年广发证券经纪业务(分业务)营收占比
图:2009-2010年广发股票与债券承销业务净收入
表:广发证券投资银行业务收入明细
表:2009-2010年广发证券证券投资业务收益
表:广发证券受托资产管理业务情况
图:2007-2010年招商证券营业收入及营业利润
表:2009年招商证券分业务营业收入及利润
图:2009年招商证券(分业务)营业收入结构
图:2004-2009年招商证券股票基金交易总金额
表:2009-2010年招商证券证券承销家数及排名
图:2008-2009年招商证券受托客户资产管理业务(分业务)营收结构
图:2007-2010年华泰证券营业收入及营业利润
表:2010年1-6月华泰证券各省市营业部数量及营业收入、营业利润
表:2009-2010年华泰证券代理买卖证券交易金额及市场份额
表:2009-2010年华泰证券代理买卖证券交易金额及市场份额
表:2010年华泰证券投资银行业务收入明细
表:2009-2010年华泰证券证券投资业务收益
表:2009-2010年华泰证券集合资产管理业务规模及净收入
图:2007-2010年光大证券营业收入及营业利润
表:2008-2009年光大证券各省市营业部数量及营业收入
图:2009年光大证券(分业务)营业收入及占比
表:2008-2009年光大证券经纪业务总交易量及市场份额
图:2006-2009年光大证券股票及债券主承销金额及家数
表:2009 年光大证券证券投资业务收益率
表:2009年光大证券集合理财产品净值及市场份额
图:2006-2009年国泰君安营业收入及营业利润
图:2006-2009年国泰君安(分业务)营收结构
图:2004-2009年国泰君安股票基金交易总金额
图:2006-2009年国泰君安证券经纪业务收入
图:2006-2009年国泰君安受托客户资产管理业务收入
图:2006-2009年国泰君安受托客户资产管理业务手续费收入结构
图:2006-2009年国泰君安投资银行业务收入
图:2006-2009年国泰君安股票及债券主承销家数
图:2006-2009年国泰君安自营业务收入
图:2006-2009年申银万国营业收入及净利润
图:2009年申银万国(分业务)营业收入及占比
图:2004-2009年申银万国股票基金交易总金额
图:2007-2009年申银万国股票债券主承销金额及家数
图:2007-2009年申银万国受托客户资产管理业务收入
图:2006-2009年中信建投营业收入及净利润
图:2008-2009年中信建投(分业务)营收结构
图:2004-2009年中信建投股票基金交易总金额
图:2007-2009年中信建投股票债券主承销金额及家数
图:2008-2009年中信建投自营业务营业收入及营业利润
图:2007-2010年宏源证券营业收入及净利润
图:2008-2009年宏源证券(分业务)营收结构
表:2008-2009年宏源证券代理买卖证券情况
表:2009年宏源证券证券承销次数、承销金额和承销收入情况
表:2008-2009年宏源证券证券投资收益
表:中国外资参股证券公司名单
表:外资参股证券公司业务范围统计
表:2009年外资参股证券公司股票及债券承销金额及市场份额
表:2010年上半年外资参股证券公司股票与债券承销家数
图:2006-2009年高盛高华营业收入及净利润
图:2009年高盛高华(分业务)营业收入及占比
图:2009年高盛高华股票及债券承销金额及市场占有率
表:瑞银证券股权结构
图:2007-2009年瑞银证券营业收入及净利润
图:2009年瑞银证券(分业务)营业收入结构
图:2007-2009年瑞银证券(分业务)营业收入
表:2007-2010年瑞银证券股票及债券主承销金额、家数及市场份额
图:2009年中德证券(分业务)营业收入及占比
Aggregate Market Value of Shanghai and Shenzhen A-share Market, 2005-2010
Daily Average Turnover in Value, 2009-2010
Regional Distribution of Securities Companies in China, 2010
Total Assets Ranking of Chinese Securities Companies, 2009
Operating Income Ranking of Chinese Securities Companies, 2009
Classified Rating of Chinese Listed Securities Companies, 2010
Securities Industry System
Total Transaction Amount of Stock Fund Warrants in China, 2006-2010
Quantity & Growth Rate of A-share Effective Accounts, 2003-2010
Revenue Percentage of Brokerage of Partial Securities Companies, 2009
Ranking of Stock Fund Transaction Volume of Securities Companies, 2009
Average Net Income of Vicariously Traded Securities by Sales Dept. of Securities Companies, 2009
Ranking of Stock & Bond Underwriting Share and Quantity of Securities Companies, 1H 2010
Stock Underwriting Amount and Quantity of Securities Companies, 2009
Market Share of Stock Underwriting in China, 2009
IPO Underwriting Amount and Market Share of Securities Companies, 1H 2010
Bond Underwriting Amount and Quantity of Securities Companies, 2009
Market Share of Bond Underwriting, 2009
Monthly Fund Raising of Collective Financial Products by Securities Companies, 2008-2009
Comparison of Collective Financial Product Scale of Listed Securities Companies, 1H 2010
Top 20 Securities Companies by Net Income from Asset Management Business, 2009
Proprietary Business Revenue of Listed Securities Companies, 2009
Margin Trading and Securities Lending Balance and Market Share of Shenzhen Stock Exchange, Jul.2010
Monthly Average Balance of Margin Trading and Securities Lending in Shenzhen Stock Exchange, 2009
Daily Average Trading Volume of Stock Index Futures, 1H 2010
Comparison of Commission Income Contribution from Stock Index Futures of Listed Securities Companies, 2010
Direct Investment Business of Partial Securities Companies, 2010
Operating Income of Galaxy Securities, 2005-2009
Operating Income and Proportion of Galaxy Securities (by Sector), 2009
Total Trading Volume of Stock Fund of Galaxy Securities, 2004-2009
Revenue of Galaxy Securities from Brokerage, 2007-2009
Net Income and Proportion of Stock & Bond Underwriting of Galaxy Securities, 2007-2009
Proprietary business Revenue of Galaxy Securities, 2007-2009
Operating Income and Total Profit of CITIC Securities, 2007-2009
Quantity and Operating Income of Provincial & Municipal Business Dept. of CITIC Securities, 2008-2009
Revenue Structure of CITIC Securities (by Sector), 2009
Trading Volume of Brokerage of CITIC Securities, 2008-2009
Revenue of CITIC Securities from Brokerage, 2008-2009
Times, Amount & Revenue of Underwriting of CITIC Securities, 2009
Revenue of CITIC Securities from Securities Underwriting, 2008-2009
Securities Investment Income of CITIC Securities, 2008-2009
Asset Management Business Scale of CITIC Securities, 2008-2009
Operating Income and Total Profit of Haitong Securities, 2006-2010
Quantity and Revenue of Provincial & Municipal Business Dept. of Haitong Securities, 2008-2009
Operating Income Structure of Haitong Securities (by Sector), 2007-2009
Vicariously Traded Securities Value and Market Share of Haitong Securities, 2008-2009
Earnings of Haitong Securities from Investment Banking Services, 2008-2009
Securities Investment Business Income of Haitong Securities, 2008-2009
Operating Income and Operating Profit of GF Securities, 2006-2010
Operating Income and Proportion of GF Securities (by Sector), 2010
Quantity and Revenue of Provincial & Municipal Business Dept. of GF Securities, 2009-2010
Vicariously Traded Securities of GF Securities, 2009-2010
Operating Income Proportion of Brokerage (by Sector) of GF Securities, 2009-2010
Net Income of GF Securities from Stock & Bond Underwriting, 2009-2010
Earnings of GF Securities from Investment Banking Services
Securities Investment Business Income of GF Securities, 2009-2010
Asset Management Business of GF Securities
Operating Income and Operating Profit of China Merchants Securities, 2007-2010
Operating Income and Profit of China Merchants Securities by Sector, 2009
Operating Income Structure of China Merchants Securities (by Sector), 2009
Total Trading Volume of Stock Fund of China Merchants Securities, 2004-2009
Quantity and Ranking of Securities Underwriting of China Merchants Securities, 2009-2010
Operating Income Structure of Asset Management Business (by Sector) of China Merchants Securities, 2008-2009
Operating Income and Operating Profit of Huatai Securities, 2007-2010
Quantity, Operating Income and Operating Profit of Provincial & Municipal Business Dept. of Huatai Securities, Jan.-Jun.2010
Trading Volume and Market Share of Brokerage of Huatai Securities, 2009-2010
Revenue of Huatai Securities from Investment Banking Services, 2010
Securities Investment Business Income of Huatai Securities, 2009-2010
Collective Asset Management Business Scale and Net Income of Huatai Securities, 2009-2010
Operating Income and Operating Profit of Everbright Securities, 2007-2010
Quantity and Operating Income of Provincial & Municipal Business Dept. of Everbright Securities, 2008-2009
Operating Income and Proportion of Everbright Securities (by Sector), 2009
Total Trading Volume and Market Share of Brokerage of Everbright Securities, 2008-2009
Stock & Bond Underwriting Amount and Quantity of Everbright Securities, 2006-2009
Securities Investment Business Yield of Everbright Securities, 2009
Net Value and Market Share of Collective Financial Products of Everbright Securities, 2009
Operating Income and Operating Profit of Guotai Junan Securities, 2006-2009
Operating Income Structure of Guotai Junan Securities (by Sector), 2006-2009
Total Trading Volume of Stock Fund of Guotai Junan Securities, 2004-2009
Revenue of Guotai Junan Securities from Brokerage, 2006-2009
Revenue of Guotai Junan Securities from Asset Management Business, 2006-2009
Structure of Commission Charge of Guotai Junan Securities from Asset Management Business, 2006-2009
Revenue of Guotai Junan Securities from Investment Banking Services, 2006-2009
Quantity of Stock & Bond Underwriting of Guotai Junan Securities, 2006-2009
Proprietary Business Revenue of Guotai Junan Securities, 2006-2009
Operating Income and Net Income of Shenyin & Wanguo Securities, 2006-2009
Operating Income and Proportion of Shenyin & Wanguo Securities (by Sector), 2009
Total Trading Volume of Stock Fund of Shenyin & Wanguo Securities, 2004-2009
Stock & Bond Underwriting Amount and Quantity of Shenyin & Wanguo Securities, 2007-2009
Revenue of Shenyin & Wanguo Securities from Asset Management Business, 2007-2009
Operating Income and Net Income of China Securities, 2006-2009
Operating Income Structure of China Securities (by Sector), 2008-2009
Total Trading Volume of Stock Fund of China Securities, 2004-2009
Stock & Bond Underwriting Amount and Quantity of China Securities, 2007-2009
Operating Income and Operating Profit of Proprietary Business of China Securities, 2008-2009
Operating Income and Net Income of Hongyuan Securities, 2007-2010
Operating Income Structure of Hongyuan Securities (by Sector), 2008-2009
The Vicariously Traded Securities of Hongyuan Securities, 2008-2009
Times, Amount and Revenue of Securities Underwriting of Hongyuan Securities, 2009
Securities Investment Income of Hongyuan Securities, 2008-2009
Foreign-funded Joint Stock Securities Companies in China
Business Scope of Foreign-funded Joint Stock Securities Companies
Stock & Bond Underwriting Amount and Market Share of Foreign-funded Joint Stock Securities Companies, 2009
Stock & Bond Underwriting Quantity of Foreign-funded Joint Stock Securities Companies, 2010H1
Operating Income and Net Income of Goldman Sachs Gao Hua Securities, 2006-2009
Operating Income and Proportion of Goldman Sachs Gao Hua Securities (by Sector), 2009
Stock & Bond Underwriting Amount and Market Share of Goldman Sachs Gao Hua Securities, 2009
Equity Structure of UBS Securities
Operating Income and Net Income of UBS Securities, 2007-2009
Operating Income Structure of UBS Securities (by Sector), 2009
Operating Income of UBS Securities (by Sector), 2007-2009
Amount, Quantity and Market Share of Stock & Bond Underwriting of UBS Securities, 2007-2010
Operating Income and Proportion of Zhong De Securities (by Sector), 2009
如果这份报告不能满足您的要求,我们还可以为您定制报告,请 留言说明您的详细需求。
|