|
|
|
报告导航:研究报告—
生命科学—制药医疗
|
|
2010年中国血液制品行业研究报告 |
 |
字数:1.6万 |
页数:59 |
图表数:56 |
|
中文电子版:4500元 |
中文纸版:2250元 |
中文(电子+纸)版:5000元 |
|
英文电子版:1600美元 |
英文纸版:1500美元 |
英文(电子+纸)版:1900美元 |
|
编号:YF008
|
发布日期:2010-11 |
附件:下载 |
 |
|
|
2009年中国血液制品市场规模接近70亿元人民币,未来2-3年内还将继续扩大。主要原因有:
- 中国血液制品行业下游需求不断扩大;
- 中国人口基数大,人口老龄化越来越严重;
- 血液制品适应症不断增加。
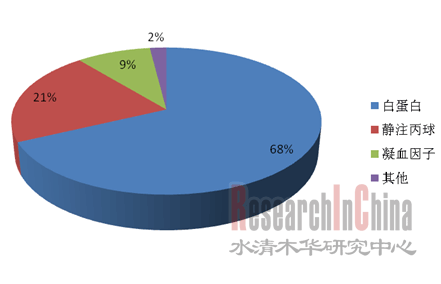
受中国白蛋白需求旺盛等因素,中国血液制品产品结构与国外凝血因子占主导地位不同。2009年中国血液制品产品中,白蛋白占68%,静丙占21%,凝血因子占9%。
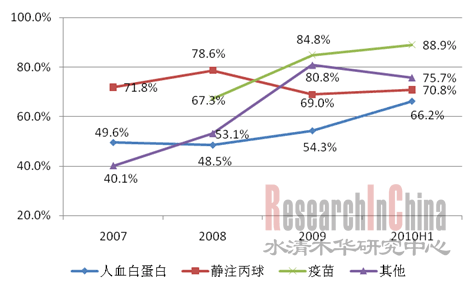
图:2009年中国血液制品产品结构  整理:水清木华研究中心 截止2009年底,国内通过 GMP 认证的血液制品生产企业共有33 家,年投浆量 在3500吨左右。其中年投浆量在300吨以上的仅有华兰生物、天坛生物、上海莱士、远大蜀阳、中国生物、上生所等少数几家。 华兰生物是中国血制品行业的龙头企业,不仅浆站较多,血浆资源相对丰富,而且血浆利用率高,产品品种丰富。截至2010年10月,华兰生物共拥有18个浆站,其中正常采浆的浆站13家,安装验收的1家,建设中3家,待建设1家。2010年1-8月,华兰生物已有人血白蛋白、静注人免疫球蛋白、破伤风人免疫球蛋白、乙肝免疫球蛋白、人免疫球蛋白、人凝血酶原复合物、狂犬病人免疫球蛋白、人凝血因子VIII等8种血液制品通过中检所批发签,合计批发签量达227.2万瓶。2010年1-6月,华兰生物实现血制品收入3.43亿元,同比增长67%。其中人血白蛋白收入1.24亿元,同比增长13%;静注丙球收入1.21亿元,同比增长61%;其他小制品收入9795万元,同比增长38%。
图:2007-2010H1华兰生物(分产品)毛利率  来源:公司年报,水清木华研究中心
In 2009, Chinese blood products market valued nearly RMB7 billion and it will continue to expand in the next two or three years. The main reasons include:
- The demand from the downstream of China blood products industry keeps growing.
- China has a large population, and the aging of which grows obviously severe
- The indications of blood products are increasing.
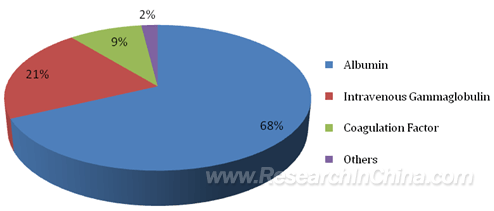
Due to the strong demand for albumin in China, the product structure of blood products in China distinguishes from foreign product structure which is dominated by coagulation factor. In 2009, in the product structure of blood products in China, albumin accounted for 68%, intravenous gammaglobulin 21% and coagulation factor 9%.
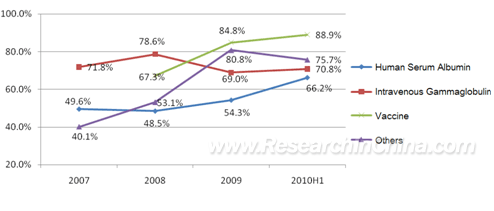
Product Structure of Blood Products in China, 2009  Source: ResearchInChina By the end of 2009, 33 Chinese manufacturers of blood products had obtained GMP certification, with the annual plasma volume of around 3,500 tons totally. However, only Hualan Biological Engineering Ltd, Beijing Tiantan Biological Products Co., Ltd, Shanghai RAAS Blood Products Co., Ltd, Sichuan Yuanda Shuyang Pharmaceutical Co., Ltd, Sino Biopharmaceutical Limited and CNBG Shanghai Institute of Biological Products have the annual plasma volume of over 300 tons respectively. Hualan Biological Engineering Ltd, as a leading enterprise in China blood products industry, owns a lot of plasma stations and relatively abundant plasma resources with high utilization rate and many varieties. As of October 2010, Hualan Biological Engineering Ltd had had 18 plasma stations, including 13 plasma collection stations in operation, one being examined, 3 under construction and one to be built. From January to August of 2010, human serum albumin, intravenous human immunoglobulin, tetanus human immunoglobulin, hepatitis B immunoglobulin, human immunoglobulin, human prothrombin complex, rabies immunoglobulin and human clotting Factor VIII of Hualan Biological Engineering Ltd were approved by National Institute for the Control of Pharmaceutical And Biological Products, with the total release volume of 2.272 million bottles. From January to June of 2010, Hualan Biological Engineering Ltd achieved the revenue of RMB343 million from blood products (a 67% YoY rise), including RMB124 million from human serum albumin (a 13% YoY rise), RMB121 million from intravenous gammaglobulin (a 61% YoY rise) and RMB97.95 million from other products (a 38% YoY rise).
Gross Margin of Hualan Biological Engineering Ltd (by Product), 2007- H1 2010  Source: ResearchInChina, Hualan Biological Engineering Ltd
第一章 血液制品行业概述
1.1血液制品定义
1.2血液制品分类
1.3重组血液制品
1.4血液制品产业链
1.5血液制品特点
第二章 中国血液制品行业总体概述
2.1总体概况
2.2运行环境
2.2.1国际市场
2.2.2政策环境
2.2.3国内生物制药市场
2.3投浆量
2.4进出口分析
第三章 主要血液制品市场分析
3.1人血白蛋白
3.2静注人免疫球蛋白
3.3凝血因子
3.4乙肝免疫球蛋白
3.5人免疫球蛋白
3.6人凝血酶原复合物
3.7破伤风免疫球蛋白
3.8狂犬病人免疫球蛋白
第四章 国内主要厂商
4.1华兰生物
4.1.1公司介绍
4.1.2经营状况
4.1.3公司血液制品经营状况
4.2上海莱士
4.2.1公司介绍
4.2.2经营状况
4.2.3公司战略
4.3天坛生物
4.3.1公司介绍
4.3.2经营状况
4.3.3公司血液制品经营状况
4.4中国生物制药公司
4.4.1公司介绍
4.4.2经营状况
4.4.3山东泰邦生物
4.4.4西安回天血液制品有限责任公司
4.4.5贵阳黔峰生物制品有限责任公司
4.5四川远大蜀阳药业
4.5.1公司介绍
4.5.2经营状况
4.6上海生物制品研究所
4.6.1公司介绍
4.6.2经营状况
4.7山西康宝生物
4.7.1公司介绍
4.7.2经营状况
4.8绿十字
4.8.1公司介绍
4.8.2经营状况
4.9江西博雅生物制药有限公司
4.9.1公司介绍
4.9.2经营状况
1 Profile of Blood Products
1.1 Definition
1.2 Classification
1.3 Recombinant Blood Products
1.4 Industry Chain
1.5 Features
2 Overview of China Blood Products Industry
2.1 General Overview
2.2 Operating Environment
2.2.1 International Market
2.2.2 Policies
2.2.3 Domestic Biopharmaceutical Market
2.3 Plasma Volume
2.4 Import & Export
3 Main Blood Product Markets
3.1 Human Serum Albumin
3.2 Intravenous Human Immunoglobulin
3.3 Coagulation Factor
3.4 Hepatitis B Immunoglobulin
3.5 Human Immunoglobulin
3.6 Human Prothrombin Complex
3.7 Tetanus Immunoglobulin
3.8 Rabies Immunoglobulin
4 Key Manufacturers in China
4.1 Hualan Biological Engineering Ltd
4.1.1 Profile
4.1.2 Operation
4.1.3 Blood Products
4.2 Shanghai RAAS Blood Products Co., Ltd
4.2.1 Profile
4.2.2 Operation
4.2.3 Strategies
4.3 Beijing Tiantan Biological Products Co., Ltd
4.3.1 Profile
4.3.2 Operation
4.3.3 Blood Products
4.4 Sino Biopharmaceutical Limited
4.4.1 Profile
4.4.2 Operation
4.4.3 Shandong Taibang Biological Products Co. Ltd
4.4.4 Xi’an Hui Tian Blood Products Co. Ltd
4.4.5 Guiyang Qianfeng Biological Product Liability Co., Ltd.
4.5 Sichuan Yuanda Shuyang Pharmaceutical Co., Ltd
4.5.1 Profile
4.5.2 Operation
4.6 CNBG Shanghai Institute of Biological Products
4.6.1 Profile
4.6.2 Operation
4.7 Shanxi Kangbao Biological Product Co., Ltd
4.7.1 Profile
4.7.2 Operation
4.8 Green Cross
4.8.1 Profile
4.8.2 Operation
4.9 Jiangxi Boya Biopharmaceutical Co., Ltd
4.9.1 Profile
4.9.2 Operation
表:血液制品的分类及作用
表:基因重组类血制品与传统血制品对比
图:血液制品产业链
图:2003-2009年中国血液制品市场规模
图:2009年中国血液制品产品结构
图:2009年国际血液制品产品结构
图:2009年中国血液制品生产企业占比
表:国内血液制品生产企业产品线对比
表:2007-2010.1-8中国血液制品批签发量
图:2003-2008年国际血液制品市场规模
表:全球血液制品生产商分类
图:2009年国际血液制品巨头销售额
表:中国血液制品主要政策
图:2005-2009年中国生物生化制药销售收入及同比增长率
图:2002-2009年中国年投浆量
表:2009年中国血液制品厂商生产情况
图:2009年中国人血白蛋白市场主要厂商及份额
图:2009年中国静注人免疫球蛋白主要厂商及份额
图:2005年部分国家和地区静注人免疫球蛋白人均消费量
图:2009年中国人凝血因子VIII市场主要厂商及份额
图:2009年中国乙肝免疫球蛋白市场主要厂商批签发量及份额
图:2009年中国人免疫球蛋白批签发量主要厂商及份额
图:2009年中国人凝血酶原复合物市场主要厂商及份额
图:2009年中国破伤风免疫球蛋白主要厂商及批签发量份额
图:2009年中国狂犬病人免疫球蛋白主要厂商及批签发量份额
图:2006-2010H1华兰生物营业收入和净利润
图:2007-2010H1华兰生物(分行业)营业收入
图:2007-2009年华兰生物(分地区)营业收入
图:2007-2010H1华兰生物(分产品)毛利率
表:截至2010年10月华兰生物采浆站分布
表:2010.01-2010.08华兰生物血液制品批签发数量
图:2007-2010H1华兰生物血液制品(分产品)营业收入
图:2006-2010H1上海莱士营业收入和净利润
表:2009-2010.1-8上海莱士血液制品批签发量
图:2005-2010H1上海莱士(分产品)营业收入
图:2005-2009年上海莱士(分产品)毛利率
图:2007-2011E年上海莱士投浆量
图:2008-2009年上海莱士(分地区)营业收入
图:2006-2010Q3天坛生物营业收入和净利润
图:2007-2009年天坛生物(分产品)营业收入
图:2007-2009年天坛生物(分产品)毛利率
图:2007-2009年天坛生物(分地区)营业收入
图:2007-2010H1天坛生物血液制品营业收入
图:2007-2010Q2中国生物制药公司营业收入和毛利润
图:2007-2009年中国生物制药公司(分产品)营业收入
图:2007-2008年山东泰邦生物营业收入和利润总额
图:2007-2008年西安回天血液制品有限责任公司营业收入和利润总额
图:2007-2008年贵阳黔峰生物营业收入和利润总额
表:2007-2010.1-8贵阳黔峰生物血液制品批签发量
图:2007-2008年远大蜀阳药业营业收入和利润总额
表:2007-2010.1-8蜀阳药业血液制品批签发量
图:2007-2008年上海生物制品研究所营业收入及利润总额
表:2007-2010.1-8上海生物制品研究所血液制品批签发量
图:2007-2008年山西康宝生物营业收入和利润总额
表:2007-2010.1-8山西康宝生物血液制品批签发量
图:2007-2008年绿十字(中国)营业收入和利润总额
表:2007-2010.1-8绿十字(中国)血液制品批签发量
图:2007-2008年江西博雅生物制药营业收入和利润总额
表:2007-2010.1-8江西博雅生物血液制品批签发量
Classification and Effects of Blood Products
Comparison between Gene Recombinant Blood Products and Traditional Blood Products
Blood Product Industry Chain
Blood Products Market Scale in China, 2003-2009
Product Structure of Blood Products in China, 2009
Product Structure of International Blood Products , 2009
Market Shares of Blood Products Manufacturing Enterprises in China, 2009
Product Lines Contrast of Blood Products Manufacturing Enterprises in China
Release Volume of Blood Products in China, 2007-Aug. 2010
Global Blood Products Market Scale, 2003-2008
Classification of Global Blood Products Manufacturing Enterprises
Sales of Global Blood Products Giants, 2009
Major Policies for Blood Products in China
Sales Revenue and YoY Growth Rate of Biological and Biochemical Pharmacy in China, 2005-2009
Annual Plasma Volume in China, 2002-2009
Production of Blood Products Manufacturing Enterprises in China, 2009
Major Manufacturers and Their Shares in Chinese Human Serum Albumin Market, 2009
Major Manufacturers and Their Shares in Chinese Intravenous Human Immunoglobulin Market, 2009
Per Capita Consumption of Intravenous Human Immunoglobulin in Some Countries and Regions, 2005
Major Manufacturers and Their Shares in Chinese Human Clotting Factor VIII Market, 2009
Major Manufacturers and Their Release Volume & Shares in Chinese Hepatitis B Immunoglobulin Market, 2009
Major Manufacturers and Their Shares in Chinese Human Immunoglobulin Market, 2009
Major Manufacturers and Their Shares in Chinese Human Prothrombin Complex Market, 2009
Major Manufacturers and Their Release Volume in Chinese Tetanus Immunoglobulin Market, 2009
Major Manufacturers and Their Release Volume in Chinese Rabies Immunoglobulin Market, 2009
Operating Income and Net Income of Hualan Biological Engineering Ltd, 2006- H1 2010
Operating Income of Hualan Biological Engineering Ltd (by Sector), 2007- H1 2010
Operating Income of Hualan Biological Engineering Ltd (by Region), 2007-2009
Gross Margin of Hualan Biological Engineering Ltd (by Product) , 2007- H1 2010
Distribution of Plasma Collection Stations of Hualan Biological Engineering Ltd, by Oct. 2010
Release Volume of Blood Products of Hualan Biological Engineering Ltd, 2007- Aug. 2010
Operating Income of Blood Products of Hualan Biological Engineering Ltd (by Product), 2007- H1 2010
Operating Income and Net Income of Shanghai RAAS Blood Products Co., Ltd, 2006- H1 2010
Release Volume of Blood Products of Shanghai RAAS Blood Products Co., Ltd, 2007- Aug. 2010
Operating Income of Shanghai RAAS Blood Products Co., Ltd (by Product), 2005- H1 2010
Gross Margin of Shanghai RAAS Blood Products Co., Ltd (by Product), 2005-2009
Plasma Volume of Shanghai RAAS Blood Products Co., Ltd, 2007-2011E
Operating Income of Shanghai RAAS Blood Products Co., Ltd (by Region), 2008-2009
Operating Income and Net Income of Beijing Tiantan Biological Products Co., Ltd, 2006- Q3 2010
Operating Income of Beijing Tiantan Biological Products Co., Ltd (by Product) , 2007-2009
Gross Margin of Beijing Tiantan Biological Products Co., Ltd (by Product) , 2007-2009
Operating Income of Beijing Tiantan Biological Products Co., Ltd (by Region), 2007-2009
Operating Income of Blood Products of Beijing Tiantan Biological Products Co., Ltd , 2007- H1 2010
Operating Income and Gross Profit of Sino Biopharmaceutical Limited, 2007- Q2 2010
Operating Income of Sino Biopharmaceutical Limited (by Product), 2007-2009
Operating Income and Total Profit of Shandong Taibang Biological Products Co. Ltd, 2007-2008
Operating Income and Total Profit of Xi’an Hui Tian Blood Products Co. Ltd, 2007-2008
Operating Income and Total Profit of Guiyang Qianfeng Biological Product Liability Co., Ltd., 2007-2008
Release Volume of Blood Products of Guiyang Qianfeng Biological Product Liability Co., Ltd., 2007-Aug. 2010
Operating Income and Total Profit of Sichuan Yuanda Shuyang Pharmaceutical Co., Ltd, 2007-2008
Release Volume of Blood Products of Sichuan Yuanda Shuyang Pharmaceutical Co., Ltd, 2007-Aug. 2010
Operating Income and Total Profit of CNBG Shanghai Institute of Biological Products, 2007-2008
Release Volume of Blood Products of CNBG Shanghai Institute of Biological Products, 2007-Aug .2010
Operating Income and Total Profit of Shanxi Kangbao Biological Products Co., Ltd, 2007-2008
Release Volume of Blood Products of Shanxi Kangbao Biological Products Co., Ltd, 2007-Aug. 2010
Operating Income and Total Profit of Green Cross (China) , 2007-2008
Release Volume of Blood Products of Green Cross (China), 2007- Aug. 2010
Operating Income and Total Profit of Jiangxi Boya Biopharmaceutical Co., Ltd., 2007-2008
Release Volume of Blood Products of Jiangxi Boya Biopharmaceutical Co., Ltd., 2007- Aug. 2010
如果这份报告不能满足您的要求,我们还可以为您定制报告,请 留言说明您的详细需求。
|