|
|
|
报告导航:研究报告—
制造业—建筑
|
|
2010年全球及中国低辐射玻璃行业研究报告 |
 |
字数:2.9万 |
页数:85 |
图表数:83 |
|
中文电子版:6000元 |
中文纸版:3000元 |
中文(电子+纸)版:6500元 |
|
英文电子版:1700美元 |
英文纸版:1600美元 |
英文(电子+纸)版:2000美元 |
|
编号:LMX008
|
发布日期:2010-11 |
附件:下载 |
 |
|
|
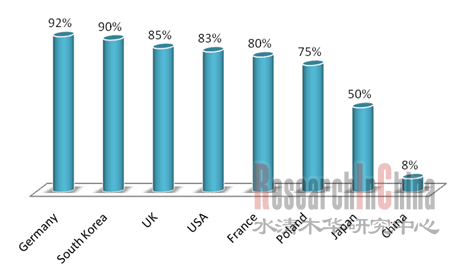
自20世纪70年代发生全球性的能源危机后,世界各国对能源的利用情况进行全面分析,诊断建筑能耗是一个重要的组成部分。各国一致认为必须对建筑设计制定节能标准,并提出法规予以执行。于是各国纷纷建立了自己的建筑节能标准,采用各种政策推荐建材节能,极大的推进了low-e玻璃的使用。1990-2005年全球low-e玻璃销量快速增长。2005年全球low-e玻璃销量突破2.5亿平米,年均复合增速达到18%左右。 目前,各发达国家的low-e玻璃都得到了大规模的普及。在德国,low-e玻璃的使用率达到92%,韩国为90%,波兰为75%。中国节能玻璃的普及率仅为10%,low-e玻璃的普及率则只有8%。因此,未来中国low-e玻璃的发展空间非常大,未来几年中国将迎来low-e玻璃的加速发展阶段,预计到2012年,公共建筑和住宅low-e玻璃使用总量将达到1.48亿平方米。
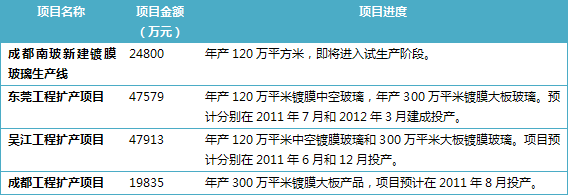
图:2009年全球主要国家low-e玻璃普及率  整理:水清木华研究中心 水清木华研究中心《2010年全球及中国低辐射玻璃行业研究报告》除了重点分析全球、中国低辐射玻璃行业的供需状况外,还着重研究了PPG Industries、NSG、AGC、Saint-Gobain 4家全球重点低辐射玻璃企业和南玻、台玻、信义、耀皮等11家中国重点企业。 国内low-e玻璃生产线主要为离线法,low-e玻璃生产线主要集中在南玻、信义、耀皮等大型企业手中,小企业涉足本行业的难度较大。以南玻集团为例,2010年上半年,公司工程玻璃产业营业收入占总收入的比重为25.98%,随着2010-2011年公司低辐射玻璃项目的陆续投产,公司工程玻璃收入有望继续保持增长。
表:南玻集团工程玻璃项目投资规划 来源:公司年报;整理:水清木华研究中心
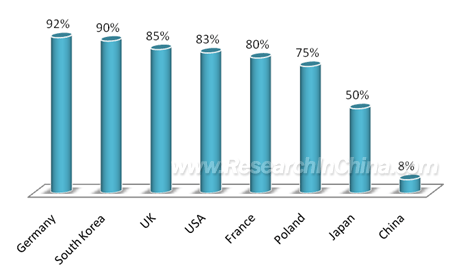
Based on a comprehensive analysis of energy consumption in the aftermath of the energy crisis in 1970s, it has become a global consensus that buildings account for a significant proportion of energy consumption, and standards as well as laws and regulations for the implementation of such standards should be formulated for the energy saving of buildings. As a result, governments worldwide have successively established their own energy-efficient standards for buildings, and implemented a variety of policies to promote energy-efficient building materials, which has greatly boosted the application of low emissivity (Low-E) glass. The sales of Low-E glass worldwide grew rapidly during 1990-2005, and exceeded 250 million m2 in 2005, with a CAGR of around 18%. Currently, Low-E glass is widely applied in developed countries. The utilization rate of Low-E glass is 92% in Germany, 90% in South Korea and 75% in Poland. While in China, the penetration rate of energy-efficient glass is only 10%, and the Low-E glass’ 8%. Therefore, China will have a large space for the development of Low-E glass in the future, and will see rapid growth of Low-E glass in the coming years. It is projected that a total of 148 million m2 of Low-E glass will be applied in the public and residential buildings by 2012.
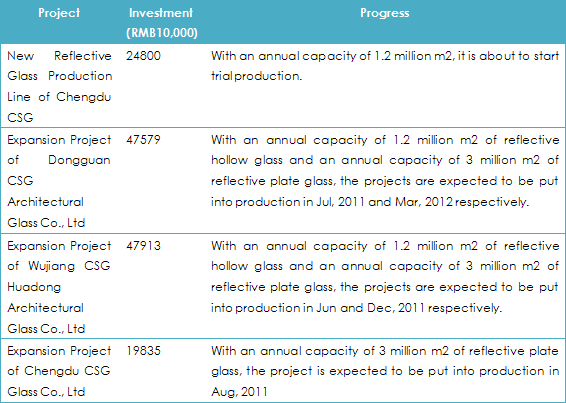
Low-E Glass Penetration Rate in Major Countries, 2009  Source: ResearchInChina Besides analyzing the supply and demand of Low-E glass in China and worldwide, the report also delves into the four key global Low-E glass companies - PPG Industries, NSG, AGC and Saint-Gobain, as well as eleven key Chinese companies like CSG, TGI, Xinyi Glass and Yaohua Pilkington. The Low-E glass production lines in China, mostly adopting offline process, are dominated by large companies such as CSG, Xinyi Glass and Yaohua Pilkington, and it is difficult for small companies to enter the industry. Taking CSG as an example, architectural glass business accounted for 25.98% of the company’s total operating income in H1 2010, and is expected to continue to grow along with the Low-E glass projects successively put into production in 2010-2011.
Investment Plan for CSG Architectural Glass Projects  Source: CSG, ResearchInChina
第一章 低辐射玻璃产品概述
1.1产品定义及分类
1.2节能效果
第二章 全球低辐射玻璃行业发展状况
2.1发展历程
2.2主要国家建筑节能政策
2.2.1德国
2.2.2美国
2.2.3日本
2.3应用状况
第三章 中国低辐射玻璃行业运行环境分析
3.1政策环境分析
3.2社会环境分析
3.2.1环境保护问题分析
3.2.2居民消费水平分析
3.3技术环境分析
第四章 中国低辐射玻璃生产状况
4.1生产成本分析
4.2产能状况分析
4.3企业竞争格局分析
第五章 中国低辐射玻璃需求状况
5.1推广low-e玻璃重要性
5.2应用现状
5.3需求状况分析
第六章 全球重点企业分析
6.1 PPG Industries
6.1.1 公司介绍
6.1.2 公司经营状况
6.1.3 公司在华业务
6.2 NSG
6.2.1 公司介绍
6.2.2 公司经营状况
6.2.3 公司建筑玻璃业务
6.2.4 公司在华业务
6.3 AGC
6.3.1 公司介绍
6.3.2 公司经营状况
6.3.3 公司玻璃业务经营状况
6.3.4 公司在华业务
6.4 Saint-Gobain
6.4.1 公司介绍
6.4.2 公司经营状况
6.4.3 公司在华业务
6.4.4圣戈班玻璃有限公司
第七章 中国重点企业分析
7.1南玻集团
7.1.1 公司介绍
7.1.2 公司经营状况
7.1.3 公司工程玻璃产品
7.1.4 公司项目规划
7.2 台玻集团
7.2.1 公司介绍
7.2.2 公司主要产品
7.2.3 台玻长江玻璃有限公司
7.3信义玻璃
7.3.1 公司介绍
7.3.2 公司经营状况
7.3.3 公司项目规划
7.4 耀皮玻璃
7.4.1 公司介绍
7.4.2 公司经营状况
7.4.3 公司项目规划
7.5 山东蓝星
7.5.1 公司介绍
7.5.2 公司低辐射玻璃工程案例
7.5.3 公司发展动态
7.6 耀华玻璃
7.6.1 公司介绍
7.6.2 公司经营状况
7.7 中航三鑫
7.7.1 公司介绍
7.7.2 公司经营状况
7.7.3 公司项目规划
7.8 厦门明达
7.8.1 公司介绍
7.8.2 公司主要低辐射玻璃产品
7.9 其他公司
7.9.1 株洲旗滨
7.9.2 中山格兰特
7.9.3 华东镀膜
1. Low-E Glass Products
1.1 Definition and Categories
1.2 Energy-efficient Effect
2. Global Low-E Glass Industry Development
2.1 Development Course
2.2 Energy-efficient Policies for Buildings in Major Countries
2.2.1 Germany
2.2.2 The United States
2.2.3 Japan
2.3 Application
3. Operational Environment of China’s Low-E Glass Industry
3.1 Policy Environment
3.2 Social Environment
3.2.1 Environmental Protection Issue
3.2.2 Residents’ Consumption Level
3.3 Technology Environment
4. China’s Low-E Glass Production
4.1 Production Cost
4.2 Capacity
4.3 Enterprise Competition Layout
5. China’s Low-E Glass Demand
5.1 Importance of Popularizing Low-E Glass
5.2 Application
5.3 Demand
6. Major Companies Worldwide
6.1 PPG Industries
6.1.1 Profile
6.1.2 Operation
6.1.3 Development in China
6.2 NSG
6.2.1 Profile
6.2.2 Operation
6.2.3 Architectural Glass Business
6.2.4 Development in China
6.3 AGC
6.3.1 Profile
6.3.2 Operation
6.3.3 Operation of Glass Business
6.3.4 Development in China
6.4 Saint-Gobain
6.4.1 Profile
6.4.2 Operation
6.4.3 Development in China
6.4.4 Saint-Gobain Glass Co., Ltd
7. China’s Major Companies
7.1 CSG
7.1.1 Profile
7.1.2 Operation
7.1.3 Architectural Glass Products
7.1.4 Project Plan
7.2 TGI
7.2.1 Profile
7.2.2 Main Products
7.2.3 TG Changjiang Float Glass Co., Ltd (CFG)
7.3 Xinyi Glass
7.3.1 Profile
7.3.2 Operation
7.3.3 Project Plan
7.4 Yaohua Pilkington
7.4.1 Profile
7.4.2 Operation
7.4.3 Project Plan
7.5 Blue Star Glass
7.5.1 Profile
7.5.2 Low-E Glass Projects
7.5.3 Development
7.6 Yaohua Glass
7.6.1 Profile
7.6.2 Operation
7.7 China Aviation Sanxin (CAS)
7.7.1 Profile
7.7.2 Operation
7.7.3 Project Plan
7.8 Intex Glass (Xiamen)
7.8.1 Profile
7.8.2 Major Low-E Glass Products
7.9 Others
7.9.1 Zhuzhou Kibing
7.9.2 Grand Glass
7.9.3 Huadong Coating Glass
图:玻璃分类
表:离线法与在线法low-e玻璃的区别
表:低辐射玻璃主要品种及适用性
图:各种玻璃传热系数对比
表:各种玻璃节能效果对比
图:国外low-e玻璃发展历程
表:德国建筑节能相关政策
图:1990-1999年德国low-e玻璃使用量及使用率
表:美国建筑节能相关政策
表:日本建筑节能相关政策
图:1990-2005年全球low-e玻璃销量及复合增速
图:1985-1996年欧洲low-e玻璃销量及复合增速
图:2009年全球主要国家节能玻璃普及率
图:2009年全球主要国家low-e玻璃普及率
表:国外low-e玻璃工艺及主要生产企业
表:历年中国建筑节能相关政策及法规
表:相关贸易政策
图:各种玻璃CO2、SO2排放量对比
图:1995-2009年城镇家庭平均每人全年住房消费性支出(单位:元)
图:low-e玻璃制造成本结构(以进口设备为例)
表:中国主要low-e生产企业及产能
表:中国采用国产设备的low-e生产线
图:2008-2010年中国low-e玻璃实际产能(单位:万平方米)
图:2009年中国主要low-e生产企业实际产能分布
图:中国社会总能耗中各种能耗占比
图:中国北方住宅建筑能耗中各种能耗占比
图:中国low-e玻璃与白玻的价格比
图:2006-2012年中国low-e玻璃需求量及预测
图:PPG玻璃业务结构
图:2007-2010年前三季度PPG收入与净利润(单位:百万美元)
图:2007-2010年上半年PPG(分产品)收入构成(单位:百万美元)
图:2006年与2009年PPG(分地区)收入构成
表:PPG在中国的low-e玻璃业务合作情况
表:NSG FY2011二季度累计(2010.4.1-2010.9.30)(分地区/分产品)营业收入
图:NSG 2011二季度累计(2010.4.1-2010.9.30)营业收入(分地区/分产品)构成
表:NSG FY2011二季度累计(2010.4.1-2010.9.30)(分地区/分产品)营业利润
图:NSG 2010FY与2011FY二季度累计(分地区)营业收入与营业利润
表:NSG在华业务布局
图:2007-2008年天津NSG安全玻璃有限公司营业收入与利润总额(单位:百万元)
图:2009-2010年二季度AGC收入与营业利润(单位:100M日元)
图:2009Q2-2010Q2 AGC收入与利润(分产品)构成
表:AGC平板玻璃分类及主要产品
图:2009-2010年二季度AGC玻璃业务收入与营业利润(单位:100M日元)
图:2009-2010年二季度AGC玻璃业务(分地区/分产品)收入(单位:100M日元)
图:2009Q2-2010Q2 AGC玻璃业务收入与营业利润(单位:100M日元)
表:AGC中国主要特种玻璃公司
图:2007-2008年旭硝子特种玻璃(大连)有限公司营业收入与利润总额(单位:百万元)
图:2007-2010年前三季度 Saint-Gobain收入与净利润(单位:十亿欧元)
图:2009-2010年前三季度 Saint-Gobain收入(分产品)构成
图:2009-2010年前三季度 Saint-Gobain收入(分地区)构成
图:2009年Saint-Gobain在欧洲、拉美以及亚太地区收入占比
图:2002-2008年圣戈班中国公司收入(单位:百万欧元)
图:圣戈班中国业务布局
图:南玻集团产业链结构
图:2007-2010年前三季度南玻集团营业收入与净利润(单位:百万元)
图:2008-2010年上半年南玻集团(分产业)营业收入构成
图:2010年上半年南玻集团营业收入(分地区)构成
表:南玻集团工程玻璃事业部下属公司信息(限大陆地区)
图:2009年南玻集团下属工程玻璃生产企业主要财务运行数据(单位:百万元)
表:南玻集团工程玻璃项目投资规划
表:长江玻璃公司基本信息
表:长江玻璃产品生产线情况
图:2007-2010年上半年信义玻璃营业收入与净利润(单位:百万港元)
图:2008-2010年上半年信义玻璃(分产品)营业收入构成
图:2008-2010年上半年信义玻璃(分地区)营业收入构成
表:耀皮玻璃主要产品及下属公司信息
图:2007-2010年前三季度耀皮玻璃营业收入和净利润(单位:百万元)
图:2008-2010年上半年耀皮玻璃(分产品)营业收入构成
图:2008-2010年上半年耀皮玻璃(分地区)营业收入构成
表:耀皮玻璃项目进展
图:公司架构
表:山东蓝星低辐射玻璃主要工程案例
表:耀华玻璃主要产品及子公司
图:2006-2008年耀华玻璃营业收入与利润总额(单位:百万元)
表:中航三鑫low-e玻璃产品分类及规格
图:2007-2010年前三季度中航三鑫营业收入与净利润(单位:百万元)
图:2004-2010年上半年中航三鑫(分产品)收入构成
图:2004-2010年上半年中航三鑫(分产品)营业利润构成
图:中航三鑫、南玻及信义工程玻璃毛利率比较
表:中航三鑫新增生产线情况
图:2007-2008年中山格兰特营业收入与利润总额(单位:百万元)
图:2007-2008年华东镀膜营业收入与利润总额(单位:百万元)
Glass Categories
Difference between Off-line and On-line Low-E Glasses
Major Categories and Applicability of Low-E Glass
Comparison of Heat Transfer Coefficient of Glass by Category
Comparison of Energy- Efficient Effect of Glass by Category
Low-E Glass Development in Foreign Countries
Energy-Efficient Policies for Buildings in Germany
Low-E Glass Consumption and Utilization Rate in Germany, 1990-1999
Energy-Efficient Policies for Buildings in the United States
Energy-Efficient Policies for Buildings in Japan
Low-E Glass Sales & CAGR Worldwide, 1990-2005
Low-E Glass Sales & CAGR in Europe, 1985-1996
Energy-Efficient Glass Penetration Rate in Major Countries, 2009
Low-E Glass Penetration Rate in Major Countries, 2009
Foreign Low-E Glass Technologies and Major Manufacturers
Comparison of Glass CO2 and SO2 Emissions by Category
Yearly per Capita Housing Expenditure of Urban Household, 1995-2009
Low-E Glass Manufacturing Cost Structure (Imported Equipment)
China’s Major Low-E Glass Manufacturers and Capacities
China’s Low-E Glass Production Lines Adopting Domestic-made Equipment
China’s Actual Low-E Glass Capacity, 2008-2010
Distribution of Actual Capacities of China’s Major Low-E Glass Manufacturers, 2009
China’s Energy Consumption by Category
Energy Consumption of Buildings in Northern China by Category
Price Ratio of Low-E Glass to Clear Glass in China
China’s Low-E Glass Demand, 2006-2012E
PPG Glass Business Structure
PPG Income & Net Profit, 2007-Q1-Q3 2010
PPG Income Structure by Product, 2007-H1 2010
PPG Income Structure by Region, 2006 vs. 2009
Cooperation of PPG Low-E Glass Business in China
NSG Operating Income by Region/Product, Q1-Q2 FY2011 (Apr 1-Sep 30, 2010)
NSG Operating Income Structure by Region/Product, Q1-Q2 FY2011 (Apr 1-Sep 30, 2010)
NSG Operating Profit by Region/Product, Q1-Q2 FY2011 (Apr 1-Sep 30, 2010)
NSG Operating Income and Profit by Region, Q1-Q2 FY2010 vs. Q1-Q2 FY2011
NSG Business Distribution in China
Operating Income and Total Profit of Tianjin NSG Safety Glass, 2007-2008
AGC Income and Operating Profit, 2009-Q2 2010
AGC Income and Profit by Product, Q2 2009-Q2 2010
AGC Flat Glass Classifications and Major Products
AGC Glass Business Income & Operating Profit, 2009-Q2 2010
AGC Glass Business Income by Region/Product, 2009-Q2 2010
AGC Glass Business Income & Operating Profit, Q2 2009-Q2 2010
Major Specialty Glass Companies of AGC China
Operating Income and Total Profit of AGC Flat Glass (Dalian) Co., Ltd, 2007-2008
Saint-Gobain Income & Net Profit, 2007-Q1-Q3 2010
Saint-Gobain Income Structure by Product, 2009-Q1-Q3 2010
Saint-Gobain Income Structure by Region, 2009-Q1-Q3 2010
Income Ratio of Saint-Gobain in Europe, Latin America and Asia Pacific, 2009
Income of Saint-Gobain China, 2002-2008
Saint-Gobain Business Distribution in China
CSG Industry Chain Structure
CSG Operating Income & Net Profit, 2007-Q1-Q3 2010
CSG Operating Income Structure by Industry, 2008-H1 2010
CSG Operating Income Structure by Region, H1 2010
Subordinates of CSG Architectural Glass Division (Mainland China)
Main Financial Data of CSG Architectural Glass Subsidiaries, 2009
Investment Plan of CSG Architectural Glass Projects
CFG Profile
CFG Production Lines
Xinyi Glass Operating Income & Net Profit, 2007-H1 2010
Xinyi Glass Operating Income by Product, 2008-H1 2010
Xinyi Glass Operating Income by Region, 2008-H1 2010
Major Products and Subsidiaries of Yaohua Pilkington
Yaohua Pilkington Operating Income and Net Profit, 2007-Q1-Q3 2010
Yaohua Pilkington Operating Income by Product, 2008-H1 2010
Yaohua Pilkington Operating Income by Region, 2008-H1 2010
Yaohua Pilkington Glass Project Progress
Company Structure
Major Low-E Glass Projects of Blue Star Glass
Major Products and Subsidiaries of Yaohua Glass
Yaohua Glass Operating Income & Total Profit, 2006-2008
CAS Low-E Glass Product Categories & Specifications
CAS Operating Income & Net Profit, 2007-Q1-Q3 2010
CAS Income by Product, 2004-H1 2010
CAS Operating Profit by Product, 2004-H1 2010
Architectural Glass Gross Margin Comparison among CAS, CSG and Xinyi Glass
New Production Lines of CAS
Grand Glass Operating Income & Total Profit, 2007-2008
Huadong Coating Glass Operating Income & Total Profit, 2007-2008
如果这份报告不能满足您的要求,我们还可以为您定制报告,请 留言说明您的详细需求。
|