|
|
|
报告导航:研究报告—
生命科学—制药医疗
|
|
2009-2010年中国骨科器械行业研究报告 |
 |
字数:2.0万 |
页数:59 |
图表数:55 |
|
中文电子版:5500元 |
中文纸版:2750元 |
中文(电子+纸)版:6000元 |
|
英文电子版:1700美元 |
英文纸版:1600美元 |
英文(电子+纸)版:2000美元 |
|
编号:ZT001
|
发布日期:2010-11 |
附件:下载 |
 |
|
|
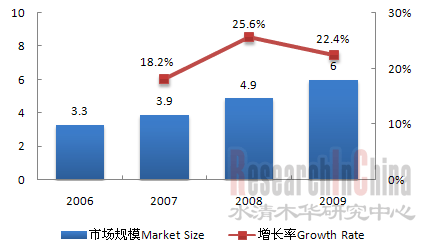
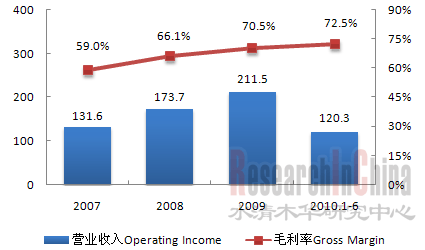
受惠于人口老龄化,消费升级和政策扶持,骨科器械行业近年来发展迅猛,2006-2009复合年增长率高达22.1%,2009年市场规模达60亿元人民币。关节、创伤和脊柱产品是中国骨科器械市场三大主流产品,2009年市场规模分别达18亿元、16.7亿元和14.9亿元。 图:2006-2009年市场规模及增长率(人民币:十亿元)  来源:China Orthopaedics,水清木华研究中心 受研发和生产技术等限制,中国骨科器械市场主要被外资企业主导,2009年外资企业合占中国骨科器械56%的市场份额,主要包括强生、美敦力、辛迪思、史塞克等。不过,国内本土企业凭借低廉的生产成本、成熟的制造工艺、完善的医疗市场销售渠道等本土优势,正不断加大在骨科器械市场的争夺,努力从中低端市场向高端市场突破,未来国产代替进口趋势明显。特别是创生、康辉和威高三大国内企业,2009年合计占创伤产品市场的17.1%,脊柱产品市场的13.7%,显示了强劲的市场竞争力。 以创生为例。2009年,公司总收入2.11亿元,比2008年增长21.3%,其中创伤产品收入1.35亿元,占中国创伤产品市场份额8%,仅次于辛迪思,居第二位;脊柱产品收入0.31亿元,占中国脊柱产品市场份额3%,居第六位。 图:2007-2010年创生营业收入及毛利率(人民币:百万元)  来源:公司年报;整理:水清木华研究中心 创生正加大生产、销售、并购以及新品研发力度以提升公司的核心竞争力。2010年6月,公司计划将上市募集的5.2亿元资金,主要用作扩大产能和设备升级(约2亿元),产品研发、市场拓展和销售渠道建设(约1亿元)以及并购(约1.8亿元)。截至2010年6月,创生在现有88种骨科产品的基础上,另有11个新产品正在研发,7个新产品处在临床测试阶段,其中包括5个脊柱产品及2个关节产品;公司位于常州的新建厂房正有条不紊建设中,有望2010年12月底前完工;公司新增40家分销商,总计达到430家,其中包括51家海外分销商。
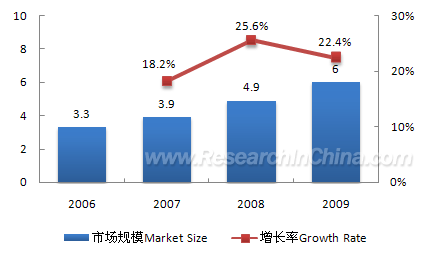
Benefiting from population aging, consumption upgrading and policy
support, the orthopedic instrument industry has witnessed rapid
development in recent years. The annual compound growth rate during
2006-2009 was as high as 22.1%, and the market size in 2009 reached RMB6
billion. Joint, trauma and vertebral column products, the three major
products in Chinese orthopedic instrument market, achieved market size
of RMB1.8 billion, RMB1.67 billion and RMB1.49 billion respectively in
2009.
Market Size and Growth Rate, 2006-2009 (RMB bn)  Source: China Orthopaedics; ResearchInChina Subject
to R&D and production technology constraints, Chinese orthopedic
instrument market is mainly dominated by foreign-funded enterprises
(with 56% market share in 2009), including Johnson & Johnson,
Medtronic, Synthes, and Stryker. However, by virtue of such advantages
as low production cost, mature manufacturing technology, and sound
medical marketing channels, local enterprises are scrambling for larger
share in the orthopedic instrument market and heading towards the
high-end market form low and medium-end market, so, the future will see
an evident trend of import products being replaced with domestic
products. Trauson Holdings, Kanghui Medical and Weigao Group, the three
major domestic enterprises, in particular, held an accumulative total of
17.1% in trauma product market and 13.7% in vertebral column product
market in 2009, indicating powerful market competitiveness. Take
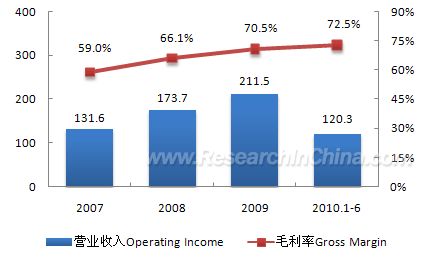
Trauson Holdings as an example. In 2009, the company obtained total
revenue of RMB211 million, up 21.3% from 2008, hereinto, trauma products
realized revenue of RMB135 million and held 8% of the domestic trauma
product market, only second to Synthes; vertebral column products made
revenue of RMB31 million and occupied 3% of the domestic vertebral
column product market, ranking the 6th.
Operating Income and Gross Margin of Trauson Holdings, 2007-2010 (RMB mln)  Source: company annual report; ResearchInChina Trauson
Holdings is strengthening production, sales, M&A, and the R&D
of new products so as to improve the core competitiveness. In June 2010,
the company planned to invest the RMB520 million raised through public
offering in capacity expansion and equipment upgrading (about RMB200
million), product R&D, market expansion and marketing channel
construction (approximately RMB100 million), and M&A (roughly RMB180
million). Up to June 2010, besides the existing 88 kinds of orthopedic
products, Trauson Holdings was engaged in the R&D of 11 new products
as well as the clinical test of 7 new products, including 5 vertebral
column products and 2 joint products; its new factory in Changzhou was
under construction according to schedule and was anticipated to be
completed by the end of Dec. 2010; adding 40 new distributors, the
company expanded the total number of distributors to 430, including 51
overseas distributors.
第一章 骨科器械行业概述
1.1 定义及分类
1.2 产业链
第二章 中国骨科器械行业概述
2.1 总体概况
2.2 运行环境
2.2.1 国际环境
2.2.2 政策环境
2.3 市场分析
2.3.1 发展现状
2.3.2 市场规模及毛利
2.3.3 市场供需
2.3.4 细分市场
2.3.5 竞争格局
2.3.6 销售渠道
2.3.7 市场预测
2.4 风险分析
2.4.1 监管风险
2.4.2 医疗事故诉讼、赔偿风险
第三章 中国骨科器械行业进出口分析
3.1 中国骨科器械行业进出口分析
3.1.1 骨科器械进口情况
3.1.2 骨科器械出口情况
3.1.3骨科器械进出口比较
3.2创伤与脊柱产品进出口分析
3.2.1创伤与脊柱产品进口情况
3.2.2 创伤与脊柱产品出口情况
3.2.3 创伤与脊柱产品进出口比较
3.3 人工关节产品进出口分析
3.3.1 人工关节产品进口情况
3.3.2 人工关节产品出口情况
3.3.3 人工关节产品进出口比较
第四章 中国市场主要骨科器械生产企业分析
4.1 强生(Johnson & Johnson)
4.1.1 强生公司
4.1.2强生(中国)及强生(苏州)医疗器械有限公司
4.2 美敦力(Medtronic)
4.2.1 公司介绍
4.2.2 中国市场经营情况
4.3 创生控股(Trauson Holdings)
4.3.1 公司介绍
4.3.2 经营情况
4.3.3 业务发展情况
4.4 常州康辉医疗(Kanghui Medical)
4.4.1 公司介绍
4.4.2 公司经营情况
4.4.3 业务发展情况
4.5 山东威高集团(Weigao Group)
4.5.1 山东威高集团
4.5.2 山东威高骨科材料有限公司(Weigao Orthopaedic)
4.5.3 美敦力威高骨科器械有限公司
4.6 苏州欣荣博尔特(Xinrong Best)
4.6.1 公司介绍
4.6.2 经营情况
4.6.3 业务发展情况
4.7天津威曼生物(Walkman)
4.7.1 公司介绍
4.7.2 经营情况
4.7.3 业务创新
4.8 北京蒙太因(Montagne)
4.8.1 公司介绍
4.8.2 经营情况
4.8.3 业务发展情况
4.9 北京力达康(LDK)
4.9.1 公司介绍
4.9.2 经营情况
4.10 天津人立骨科(Renli)
4.10.1 公司介绍
4.10.2 经营情况
1. Overview of Orthopedic Instrument Industry
1.1 Definition and Classification
1.2 Industrial Chain
2. Overview of Chinese Orthopedic Instrument Industry
2.1 Profile
2.2 Operating Environment
2.2.1 International Environment
2.2.2 Policy Environment
2.3 Market
2.3.1 Status Quo
2.3.2 Market Size and Gross Profit
2.3.3 Supply and Demand
2.3.4 Segmented Market
2.3.5 Competition Pattern
2.3.6 Marketing Channel
2.3.7 Forecast
2.4 Risk
2.4.1 Regulation Risk
2.4.2 Medical Malpractice Lawsuit & Compensation
3. Import and Export of Chinese Orthopedic Instrument Industry
3.1 Import and Export
3.1.1 Import
3.1.2 Export
3.1.3 Comparison between Import and Export
3.2 Import & Export of Trauma and Vertebral Column Products
3.2.1 Import
3.2.2 Export
3.2.3 Comparison between Import and Export
3.3 Import & Export of Artificial Joint Products
3.3.1 Import
3.3.2 Export
3.3.3 Comparison between Import and Export
4. Major Orthopedic Instrument Manufacturers in Chinese Market
4.1 Johnson & Johnson
4.1.1 Johnson & Johnson
4.1.2 Johnson & Johnson (China) and Johnson & Johnson Medical (Suzhou) Ltd.
4.2 Medtronic
4.2.1 Profile
4.2.2 Operation in China
4.3 Trauson Holdings
4.3.1 Profile
4.3.2 Operation
4.3.3 Business Development
4.4 KangHui Medical
4.4.1 Profile
4.4.2 Operation
4.4.3 Business Development
4.5 Weigao Group
4.5.1 Weigao Group
4.5.2 Weigao Orthopaedic
4.5.3 Medtronic Weigao Orthopaedic Device Company Limited
4.6 Xinrong Best
4.6.1 Profile
4.6.2 Operation
4.6.3 Business Development
4.7 Walkman
4.7.1 Profile
4.7.2 Operation
4.7.3 Business Innovation
4.8 Montagne
4.8.1 Profile
4.8.2 Operation
4.8.3 Business Development
4.9 LDK
4.9.1 Profile
4.9.2 Operation
4.10 Renli
4.10.1 Profile
4.10.2 Operation
表:骨科器械分类和材质
图:骨科器械行业产业链
图:2002-2009年中国医疗器械市场规模及增长率(人民币:十亿元)
图:2006-2009年中国骨科器械市场规模及增长率(人民币:十亿元)
图:2003-2015年全球骨科市场规模(美元:十亿元)
图:2009年全球骨科器械区域市场份额
图:2007-2009年六大骨科器械巨头骨科产品销售额及全球占比(美元:十亿元)
表:全球骨科医疗器械企业在华投资情况(美元:百万元)
表:中国有关医疗器械行业的主要法律、法规
表:骨科器械行业相关政策
表:中国主要骨科器械生产商
表:2007-2009年中国主要骨科器械生产商毛利率
图:2010年全球部分国家65岁或以上人口数及比例(单位:百万人)
图:2008年部分国家关节炎患者人口数(单位:百万人)
图:2006-2009年中国骨科器械细分市场规模(人民币:十亿元)
图:2009年中国骨科器械及其细分市场内外资企业市场占比
图:2009年中国创伤产品各企业市场份额
图:2009年中国脊柱产品各企业市场份额
图:2.5-3.5年产品注册证审批流程
图:中国骨科器械销售渠道示意图
图:2008年全球和中国骨科产品市场份额对比
图:2009-2010年9月中国骨科器械进口数量(单位:吨)
图:2009-2010年9月中国骨科器械进口金额(美元:百万元)
图:2009-2010年9月中国骨科器械出口数量(单位:吨)
图:2009-2010年9月中国骨科器械出口金额(美元:百万元)
图:2009.10-2010.9中国骨科器械进出口数量(单位:吨)
图:2009.10-2010.9中国骨科器械年进出口金额(美元:百万元)
图:2009-2010年9月中国创伤与脊柱产品进口数量(单位:吨)
图:2009-2010年9月中国创伤与脊柱产品进口金额(美元:百万元)
图:2009-2010年9月中国创伤与脊柱产品出口数量(单位:吨)
图:2009-2010年9月中国创伤与脊柱产品出口金额(美元:百万元)
图:2009.10-2010.9中国创伤与脊柱产品进出口数量(单位:吨)
图:2009.10-2010.9中国创伤与脊柱产品进出口金额(美元:百万元)
图:2009-2010年9月中国人工关节产品进口数量(单位:吨)
图:2009-2010年9月中国人工关节产品进口金额(美元:百万元)
图:2009-2010年9月中国人工关节产品出口数量(单位:吨)
图:2009-2010年9月中国人工关节产品出口金额(美元:百万元)
图:2009.10-2010.9中国人工关节产品进出口数量(单位:吨)
图:2009.10-2010.9中国人工关节产品进出口金额(美元:百万元)
图:2006-2009年强生总收入与医疗器械和骨科分部收入及占比(美元:十亿元)
图:2007-2010财年美敦力年收入与骨科业务收入及占比(美元:十亿元)
图:2007-2010年创生营业收入及毛利率(人民币:百万元)
图:2007-2009年创生骨科产品国内国际市场收入(人民币:百万元)
图:2007-2010年创生骨科产品生产能力(百万件)
图:2007-2010年康辉医疗营业收入及毛利率(人民币:百万元)
图:2007-2009年康辉医疗国内国际市场收入(人民币:百万元)
图:2006-2010年威高集团总收入与骨科分部收入及占比(人民币:百万元)
图:2007-2010年威高骨科营业收入及毛利率(人民币:百万元)
图:2007-2010年威高骨科产品产量(千件)
图:2009-2010年美敦力威高营业收入(人民币:百万元)
图:2005-2008年苏州欣荣营业收入和毛利率(人民币:百万元)
图:2005-2008年威曼生物营业收入和毛利率(人民币:百万元)
图:2007-2009年蒙太因销售收入及净利润率(人民币:百万元)
图:2007-2008年力达康营业收入及毛利率(人民币:百万元)
图:2005-2008年天津人立营业收入及毛利率(人民币:百万元)
Classification and Materials of Orthopedic Instrument
Orthopedic Instrument Industrial Chain
Chinese Medical Device Market Size and Growth Rate, 2002-2009
Chinese Orthopedic Instrument Market Size and Growth Rate, 2006-2009
Global Orthopedic Instrument Market Size, 2003-2015E
Global Orthopedic Instrument Market Share by Region, 2009
Orthopedic Product Sales and Proportion of Top 6 Orthopedic Instrument Magnates, 2007-2009
Investment in China by Global Orthopedic Instrument Enterprises
China’s Major Laws and Regulations concerning Medical Device Industry
Relevant Policies of Orthopedic Instrument Industry
Major Orthopedic Instrument Manufacturers in China
Gross Margin of Major Orthopedic Instrument Manufacturers in China, 2007-2009
Population and Proportion of People Aged 65 or above by Country, 2010
Arthritis Patient Population by Country, 2008
Orthopedic Instrument Segmented Market Size in China, 2006-2009
Proportion of Domestically-funded Enterprises and Foreign-funded Enterprises in Chinese Orthopedic Instrument Market & Segmented Market, 2009
Market Share of Trauma Product Manufacturers in China, 2009
Market Share of Vertebral Column Product Manufacturers in China, 2009
Approval Flow of 2.5-3.5-Year Product Registration Certificate
Chinese Orthopedic Instrument Marketing Channels
Market Share of Orthopedic Products, Global vs. China, 2008
Import Volume of Orthopedic Instrument in China, 2009-Sep.2010
Import Value of Orthopedic Instrument in China, 2009-Sep.2010
Export Volume of Orthopedic Instrument in China, 2009-Sep.2010
Export Value of Orthopedic Instrument in China, 2009-Sep.2010
Import & Export Volume of Orthopedic Instrument in China, Oct.2009 –Sep.2010
Import & Export Value of Orthopedic Instrument in China, Oct.2009 –Sep.2010
Import Volume of Trauma and Vertebral Column Products in China, 2009-Sep.2010
Import Value of Trauma and Vertebral Column Products in China, 2009-Sep.2010
Export Volume of Trauma and Vertebral Column Products in China, 2009-Sep.2010
Export Value of Trauma and Vertebral Column Products in China, 2009-Sep.2010
Import & Export Volume of Trauma and Vertebral Column Products in China, Oct.2009 –Sep.2010
Import & Export Value of Trauma and Vertebral Column Products in China, Oct.2009 –Sep.2010
Import Volume of Artificial Joint Products in China, 2009-Sep.2010
Import Value of Artificial Joint Products in China, 2009-Sep.2010
Export Volume of Artificial Joint Products in China, 2009-Sep.2010
Export Value of Artificial Joint Products in China, 2009-Sep.2010
Import & Export Volume of Artificial Joint Products in China, Oct.2009 –Sep.2010
Import & Export Value of Artificial Joint Products in China, Oct.2009 –Sep.2010
Johnson & Johnson Total Revenue and Revenue & Proportion of Medical Device Division and Orthopedics Division, 2006-2009
Medtronic Annual Revenue and Revenue & Proportion of Orthopedic Business, FY2007-FY2010
Operating Income and Gross Margin of Trauson Holdings, 2007-2010
Domestic and International Market Revenue of Orthopedic Products of Trauson Holdings, 2007-2009
Orthopedic Product Capacity of Trauson Holdings, 2007-2010
Operating Income and Gross Margin of KangHui Medical, 2007-2010
Domestic and International Market Revenue of KangHui Medical, 2007-2009
Total Revenue of Weigao Group and Revenue & Proportion of Orthopedics Division, 2006-2010
Operating Income and Gross Margin of Weigao Orthopaedic, 2007-2010
Weigao Orthopaedic Product Output, 2007-2010
Operating Income of Medtronic Weigao Orthopaedic Device Company Limited, 2009-2010
Operating Income and Gross Margin of Xinrong Best, 2005-2008
Operating Income and Gross Margin of Walkman, 2005-2008
Revenue and Net Profit Margin of Montagne, 2007-2009
Operating Income and Gross Margin of LDK, 2007-2008
Operating Income and Gross Margin of Renli, 2005-2008
如果这份报告不能满足您的要求,我们还可以为您定制报告,请 留言说明您的详细需求。
|