|
|
|
报告导航:研究报告—
农业与食品—农业
|
|
2010年中国水产养殖行业研究报告 |
 |
字数:3.5万 |
页数:85 |
图表数:71 |
|
中文电子版:6000元 |
中文纸版:3000元 |
中文(电子+纸)版:6500元 |
|
英文电子版:1600美元 |
英文纸版:1700美元 |
英文(电子+纸)版:1900美元 |
|
编号:DYY017
|
发布日期:2010-12 |
附件:下载 |
 |
|
|
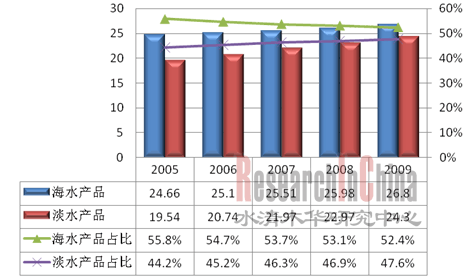
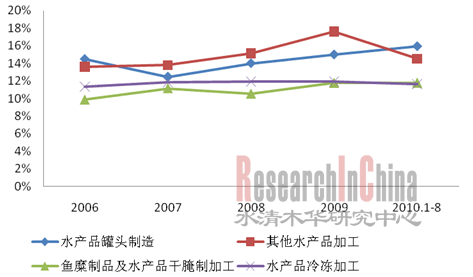
近年来,随着人民生活水平的提高,高蛋白水产品消费量逐年增加。强大的需求拉动了水产品产量的增长,2009年中国水产品产量达5120万吨,同比增长4.6%。从产品结构来看,海水产品与淡水产品产量占比差距逐年缩小,海水产品占比52.4%,淡水产品占比47.6%。 图:2005-2009年中国海水产品和淡水产品产量(单位:百万吨)  来源:国家统计局;整理:水清木华研究中心 随着海外市场需求量增加,中国水产品出口量也随之增加。2010年前三季度中国水产品出口量230.2万吨,出口额95.2亿美元,分别同比增长8.9%和25.6%,其中对虾、贝类、罗非鱼、鳗鱼、大黄鱼等名优养殖水产品仍是主要出口品种,该5个品种出口额之和占水产品贸易出口总额的50.2%。各品种出口单价同比均有所上涨,其中,鳗鱼和大黄鱼出口均价涨幅较大,分别同比增长38.7%和43.4%。山东、广东等沿海省份是中国水产品主要出口省份,而日美欧韩依然是中国最重要的出口市场。 从水产品加工看,2006-2010年,水产品加工企业营业收入不断增加,2010年1-8月行业整体营业收入达到1980亿元。从各子行业来看,受消费者饮食习惯影响,冷冻加工食品市场需求不断增大,2010年1-8月其营业收入达到1505亿元,占整个水产品加工的76%。但由于冷冻储藏、运输及采购等成本上升相对较快,2006-2010年8月,行业毛利率一直处于较低水平,在11%-12%范围波动。 图:2006-2010年1-8月中国水产品加工各子行业毛利率(单位:%)  来源:WIND;整理:水清木华研究中心 本报告除了对水产养殖行业情况进行整体分析外,还对好当家、壹桥苗业、国联水产、獐子岛、大湖股份、东方海洋、海大集团等行业内主要公司的经营状况和发展策略进行了分析。 好当家主要养殖毛利率较高的海参及海蜇产品,2010年上半年公司养殖业毛利率达到47.1%。根据公司规划,2014 年公司将拥有海参围堰养殖面积5万亩,凭借水域资源丰富,公司未来利润增长空间较大。 壹桥苗业是国内海珍育苗养殖的龙头企业。壹桥苗业主要从事海参、虾夷贝苗的培育和销售,2010年上半年,公司营业收入达到1.4亿元,综合毛利率达到45.4%,高于同行业其他公司水平。但公司下游产业区域分布主要在辽宁省,公司销售区域较集中,由此为公司带来区域销售方面的经营风险。 国联水产和獐子岛是典型的产业一体化企业,其中国联水产的主要收入来源是对虾加工及出口,獐子岛主要养殖虾夷扇贝及鲍鱼,产品毛利率较高;大湖股份主营淡水鱼产品,2010年主打品牌战略,建立了鲜活水产品定点专供营销模式,同时,销售市场从中南向西南拓展;东方海洋主营水产品出口业务,其经营模式为“水产养殖+水产加工”,2010年公司开始研发三文鱼养殖,不断完善公司产品结构;2010年主营水产饲料的海大集团也增加了鱼、虾苗种业务,介入水产品育苗行业,开始向产业一体化方向发展。
Alongside with the improving living standard of people, the consumtion
of high-protein aquatic products goes up year by year, and the robust
demand drives the output of aquatic products to grow ever. In 2009,
China’s output of aquactic products achieved 51.20 million tons, up 4.6%
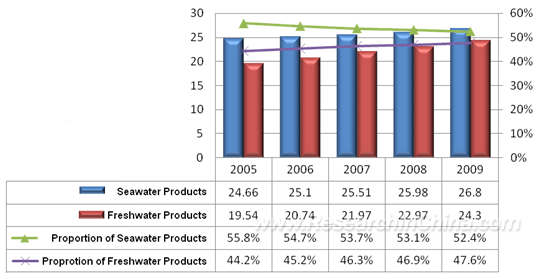
from a year earlier. As far as the product mix is considered, the
output of seawater products has an annually bridging gap with that of
freshwater products in percentage, with a share of 52.4% and 47.6% ,
respectively. Outputs of Seawater Products and Freshwater Products in China, 2005-2009 (mln tons)  Source: NBS; ResearchInChina China
increases its export volume of aquatic products with the soaring demand
in overseas market. In the first three quarters of 2010, the export
volume and value of aquatic products of China reached 2.302 million tons
and USD 9.52 billion respectively, an increase of 8.9% and 25.6% from
the same period of last year. Of all, prawn, shellfish, tilapia, eel and
large yellow croaker are still major exporting varieties, with the
total export value providing 50.2% of the total export value of aquatic
products. As for the unit export price, eel and large yellow croaker
gained the huge growth by 38.7% and 43.4% respectively. Coastal
provinces like Shandong and Guangdong are the major exporters of aquatic
products which are largely exported to the US, Japan and South Korea. Concerning
the processing of aquatic products, the operating income of aquatic
product processing enterprises has increased since 2006. Between January
and August of 2010, the yields of the industry totaled RMB 198 billion.
When it comes to the sub-industries, the frozen processed food market
experiences a burgeoning demand influenced by the dietary habit of
consumers. In Jan.-Aug. 2010, the operating income of this sub-industry
reaped RMB 150.5 billion, contributing 76% of the whole aquatic products
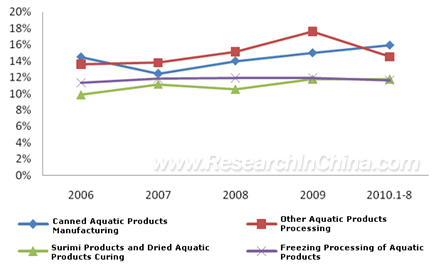
processing industry. However, the soaring cost in refrigerating
storage, transportation and procurement resulted in the meager gross
margin which fluctuated between 11% and 12% during 2006-Aug. 2010. Gross Margin of Aquatic Products Processing in China by Sub-industry, Jan.-Aug., 2006-2010  Source: WIND; ResearchInChina The
report analyzes the aquaculture industry as a whole and highlights the
operation and development of the leading domestic enterprises, including
HOMEY Group International, Dalian Yiqiao Marine Seeds Co., Ltd,
Zhanjiang Guolian Aquatic Products Co., Ltd., Zhangzidao Fishery Group,
Dahu Aquaculture Company Limited, Shandong Oriental Ocean Sci-Tech Co.,
Ltd and Guangdong Haid Group Co., Ltd. HOMEY Group International
is mainly engaged in the cultivation of sea cucumber and jelly fish
products with higher gross margin. In the first half of 2010, the gross
margin of the company realized 47.1%. HOMEY Group International plans to
expand the sea cucumber cofferdam breeding area to 50,000 mu by 2014.
And it is expected to see a potential growth in the profit for the
company thanks to the rich aquatorium resources. Dalian Yiqiao
Marine Seeds Co., Ltd, a domestic flagship enterprise involved in the
breeding of rare seafood seed, focuses on the cultivation and sales of
sea cucumber and shrimp seeds. In the first half of 2010, the operating
income of the company recorded RMB 140 million, with the integrated
gross margin reaching 45.4%, higher than its counterparts. However, the
downstream industry of the company concentrates in Liaoning Province by
region which means the converged sales regions, thus bringing risk in
operation. Zhanjiang Guolian Aquatic Products Corp. Ltd. and
Zhangzidao Fishery Group are both typical industry integrated
enterprises; wherein, the revenue of the former is primarily sourced
from the processing and exporting of prawn; while the latter focuses on
the breeding of patinopecten yesoensis and abalone which features higher
gross margin. Dahu Aquaculture Company Limited, committing itself to
freshwater fish products, launched brand strategy in 2010 and
established the designated sales outlets of fresh and live aquatic
products, expanding its selling markets towards Southwest China from
Central South. In addition, Shandong Oriental Ocean Sci-Tech Co., Ltd is
specialized in export business of aquatic products with the business
pattern of “Aquaculture plus Aquatic Product Processing”, and the
company in 2010 dabbled in salmon breeding, in a move to further perfect
its product structure. In the same year, Guangdong Haid Group Co., Ltd.
which placed aquatic feed as its major business also introduced fish
& shrimp seed business and was involved in aquatic products seed
breeding sector, ushering into an era of industry integration.
第一章 水产养殖产业相关概述
1.1基本概念
1.2产品类型
1.2.1常规水产品
1.2.2名优珍品
1.2.3出口优势产品
第二章 2010年中国水产养殖产业运行环境
2.1产业政策
2.1.1水产养殖质量安全管理规定
2.1.2有机认证标准
2.2 生态环境
第三章 2010年中国水产养殖业发展概况
3.1市场发展概况
3.2市场供需情况
3.3水产品加工行业概况
第四章 2010年中国水产品细分市场概况
4.1常规鱼市场
4.2虾蟹市场
4.3龟鳖类市场
4.4贝类市场
4.5 海珍品苗种
第五章 2010年中国水产养殖产品进出口分析
5.1 进出口概况
5.2 进出口分析
5.2.1 出口种类
5.2.2 出口省份
5.2.3 出口市场
5.2.4 来料加工出口缩减
5.2.5 进口量继续增长
第六章 2010年中国水产养殖地域分析
6.1福建
6.1.1 产量
6.1.2 进出口
6.2山东
6.2.1 产量
6.2.2 进出口
6.3江苏
6.3.1 产量
6.3.2 进出口
6.4辽宁
6.4.1 产量
6.4.2 进出口
6.5广东
6.5.1 产量
6.5.2 进出口
6.6浙江
6.6.1 产量
6.6.2 进出口
第七章 中国水产养殖业重点企业经营状况
7.1 壹桥苗业
7.1.1 公司简介
7.1.2 公司经营状况
7.1.3 公司优势及发展战略
7.2 国联水产
7.2.1 公司简介
7.2.2公司经营状况
7.2.3公司优势及发展战略
7.3海大集团
7.3.1 公司简介
7.3.2 公司经营状况
7.3.3 公司发展战略
7.4山东好当家
7.4.1 公司简介
7.4.2 公司经营状况
7.4.3 公司发展战略
7.5大湖股份
7.5.1 公司简介
7.5.2 公司经营状况
7.5.3 公司发展战略
7.6山东东方海洋
7.6.1 公司简介
7.6.2 公司经营状况
7.6.3 公司发展战略
7.7大连獐子岛
7.7.1 公司简介
7.7.2 公司经营状况
7.7.3 公司发展战略
7.8 广州陆仕水产
7.8.1 公司简介
7.8.2 公司经营
7.8.3 公司发展战略
7.9山东寻山水产
7.9.1 公司简介
7.9.2 公司发展战略
7.10大连玉璘
7.10.1 公司简介
7.10.2 公司发展战略
1.Overview of Aquaculture Industry
1.1 Basic Concepts
1.2 Product Types
1.2.1Regular Aquatic Products
1.2.2 Famous Products
1.2.3 Superior Products for Export
2. Operation Environment of China Aquaculture Industry, 2010
2.1 Industry Policy
2.1.1 Regulation on Quality Safety Management of Aquaculture
2.1.2 Organic Certification Standard
2.2 Ecological Environment
3. Development of China Aquaculture Industry, 2010
3.1 Market Development
3.2 Supply & Demand
3.3 Aquatic Products Processing
4. Market Segments of Aquatic Products, 2010
4.1 Regular Fish Market
4.2 Shrimp & Crab Market
4.3 Terrapin Market
4.4 Shellfish Market
4.5 Rare Seafood Seed
5. Import & Export of Chinese Aquaculture Products, 2010
5.1 Overview
5.2 Import & Export
5.2.1 Export Varieties
5.2.2 Exporting Province
5.2.3 Export Market
5.2.4 Contracting Export Volume of Processing Products
5.2.5 Import Volume Keeps Growing
6. Aquaculture Regions in China, 2010
6.1 Fujian
6.1.1 Output
6.1.2 Import & Export
6.2 Shandong
6.2.1 Output
6.2.2 Import & Export
6.3 Jiangsu
6.3.1 Output
6.3.2 Import & Export
6.4 Liaoning
6.4.1 Output
6.4.2 Import & Export
6.5 Guangdong
6.5.1 Output
6.5.2 Import & Export
6.6 Zhejiang
6.6.1 Output
6.6.2 Import & Export
7. Key Enterprises
7.1 Dalian Yiqiao Marine Seeds Co., Ltd
7.1.1 Profile
7.1.2 Operation
7.1.3 Advantages & Development Strategy
7.2 Zhanjiang Guolian Aquatic Products Co., Ltd
7.2.1 Profile
7.2.2 Operation
7.2.3 Advantages & Development Strategy
7.3 Guangdong Haid Group Co., Ltd.
7.3.1 Profile
7.3.2 Operation
7.3.3 Development Strategy
7.4 HOMEY Group International
7.4.1 Profile
7.4.2 Operation
7.4.3 Development Strategy
7.5 Dahu Aquaculture Company Limited
7.5.1 Profile
7.5.2 Operation
7.5.3 Development Strategy
7.6 Shandong Oriental Ocean Sci-Tech Co., Ltd
7.6.1 Profile
7.6.2 Operation
7.6.3 Development Strategy
7.7 Zhangzidao Fishery Group
7.7.1 Profile
7.7.2 Operation
7.7.3 Development Strategy
7.8 Guangzhou LUXE Seafood ENT.LTD
7.8.1 Profile
7.8.2 Operation
7.8.3 Development Strategy
7.9 Xunshan Group
7.9.1 Profile
7.9.2 Development Strategy
7.10 Dalian RainLion Group
7.10.1 Profile
7.10.2 Development Strategy
表:中国支持水产养殖业的五大政策及影响
图:2009年中国各用海类型确权面积百分比
图:2005-2009年中国水产品产量及同比增长
图:2005-2009年中国海水产品和淡水产品产量
图:2005-2009年中国城镇居民水产品及食品人均消费支出及增长率
图:2006-2010.08中国水产品加工企业个数
图:2006-2010.08中国水产品加工各子行业企业个数
图:2006-2010年1-8月中国水产品加工行业主营业务收入及利润总额
图:2006-2010年1-8月中国水产品加工各子行业毛利率
图:2006-2010年1-8月中国水产品加工各子行业行业主营业务收入及利润总额
图:2006-2009中国海水及淡水鱼类产量
图:2006-2009中国海水及淡水虾蟹产量
表:2010年中国常见龟鳖种苗的市场价格
图:2006-2009中国海水及淡水贝类产量
表:中国海珍品育苗企业
表:2009年中国主要水产品(分类别)出口量及占比
表:2010年1-9月中国水产品(分产品)出口量及出口额
表:2009年中国水产品主要出口省份及出口数量
表:2010年1-3季度中国水产品主要出口省份及出口金额
表:2009年中国水产品主要出口市场及出口量
表:2010年1-9月中国水产品主要出口市场及出口额
表:2010年1-9月中国主要进口水产品数量及金额
图:2010年1-9月中国主要水产品进口市场份额
图:2004-2009福建省海水及淡水养殖产品产量
表:2010年1-8月福建省水产品出口量及金额
图:2004-2009山东省海水及淡水养殖产品产量
表:2008-2009年山东省水产品主要出口市场出口量及出口额
表:2010年1-10月山东省水产品进出口情况
图:2004-2009江苏省海水及淡水养殖产品产量
表:2010年1-6月江苏省水产品主要出口品种及出口额
表:2010年1-6月江苏省水产品主要出口市场及出口额
图:2004-2009辽宁省海水及淡水养殖产品产量
表:2010年1-10月辽宁省水产品进出口数量及金额
图:2010年1-10月辽宁省水产品主要出口市场份额
图:2004-2009广东省海水及淡水养殖产品产量
表:2009年广东省主要水产品出口统计表
表:2009年广东省主要进口产品统计表
图:2004-2009浙江省海水及淡水养殖产品产量
表:2009-2010年1-9月浙江省主要出口水产品种、数量及金额
表:2010年1-9月浙江省水产品出口主要国家、出口量及金额
图:2007-2010.6壹桥苗业主营业务收入及净利润
表:2010年1-6月壹桥苗业(分行业和产品)营业收入
表:2007-2010.6年壹桥苗业区域市场销售额及所占比重
表:2010年1-6月壹桥苗业营业收入分地区统计
图:国联水产纵向一体化产业链
表:2007-2010.9国联水产营业收入和净利润
图:2007-2010.9国联水产营业收入及净利润
图:2010H1国联水产主营业务分种类构成
表:2010H1国联水产主营业务收入、成本、毛利率等统计
表:2010H1国联水产主营业务收入及同比增长分地区统计
表:国联水产生产优势
表:海大集团产品品种及用途
图:2006-2010.9 海大集团营业收入和净利润
表:2010年1-6海大集团(分行业)主营业务
表:2010年1-6月海大集团主营业务收入及毛利率(分产品)变化
图:好当家业务模式
图:2008-2010.9好当家主营业务收入及净利润
表:2009年好当家(分产品及行业)营业收入及利润率
表:2010年1-6月好当家(分产品及行业)营业收入及利润率
表:好当家海域资源情况
表:2010年1-6月大湖股份(分行业、产品)营业收入及利润率
图:2008-2010.6大湖股份主营业务收入及净利润
表:东方海洋各海域面积及亩产
表:2010年1-6东方海洋(分行业)主营业务及毛利率
图:2010年1-6月东方海洋(分地区)主营业务构成
图:2007-2010.09东方海洋主营业务及净利润
表:2010年1-6月獐子岛(分产品)主营业务收入及毛利率
表:2010年1-6月獐子岛(分行业)主营业务及毛利率
图;2007-2010.9獐子岛主营业务收入及净利润
表;2010年1-6月 (分地区)主营业务及占比
表:大连玉璘集团五大产业基地
China’s Five Major Supporting Policies on Aquaculture Industry and the Influence
Percentage of Established Sea Properties by Utilization Type in China, 2009
Output and YoY Growth of China Aquatic Products, 2005-2009
Output of China Seawater Products and Freshwater Products, 2005-2009
Per Capita Consumption Expenditure and Its Growth of Aquatic Products and Food of Chinese Residents in Urban Regions, 2005-2009
Number of Aquatic Product Processing Enterprises in China, 2006-Aug. 2010
Number of Enterprises in Aquatic Product Processing Sub-industries of China, 2006-Aug.2010
Operating Income and Total Profit of China Aquatic Product Processing Industry, Jan.-Aug., 2006-2010
Gross Margin of China Aquatic Product Processing by Sub-industry, Jan.-Aug.,2006-2010
Operating Income and Total Profit of China Aquatic Product Processing by Sub-industry, Jan.-Aug., 2006-2010
Output of Saltwater Fish and freshwater Fish of China, 2006-2009
Output of Saltwater Shrimp & Crab and Freshwater Shrimp & Crab of China, 2006-2009
Market Prices of Common Testudinate Germchit in China, 2010
Output of Saltwater and Freshwater Shellfish in China, 2006-2009
Rare Seafood Breeding Enterprisesin China
Export Volume and Percentage of Major Aquatic Products in China by Type, 2009
Export Volume and Value of China Aquatic Products by Product, Jan.-Sep. ,2010
Provinces (China) Exporting Aquatic Products and Export Volume, 2009
Provinces (China) Exporting Aquatic Products and Export Value, Q1-Q3,2010
Major Export Markets and Export Volume of Aquatic Products in China, 2009
Major Export Markets and Export Value of Aquatic Products in China, Jan.-Sep.,2010
Import Volume and Import Value of Major Aquatic Products in China, Jan.-Sep.,2010
Market Share of Major Imported Aquatic Products in China, Jan.-Sep.,2010
Output of Saltwater and Freshwater Aquaculture Products in Fujian, 2004-2009
Export Volume and Value of Aquatic Products in Fujian, Jan.-Aug.,2010
Output of Saltwater and Freshwater Aquaculture Products in Shandong, 2004-2009
Export Volume and Value of Aquatic Products in Shandong, 2008-2009
Import & Export of Aquatic Products in Shandong, Jan.-Oct., 2010
Output of Saltwater and Freshwater Aquaculture Products in Jiangsu, 2004-2009
Export Products and Value of Aquatic Products in Jiangsu, Jan.-Jun.,2010
Major Export Markets and Export Value of Aquatic Products in Jiangsu, Jan.-Jun., 2010
Output of Saltwater and Freshwater Aquaculture Products in Liaoning, 2004-2009
Import & Export Volume and Value of Aquatic products in Liaoning, Jan.-Oct.,2010
Market Share of Major Exported Aquatic Products in Liaoning, Jan.-Oct.,2010
Output of Saltwater and Freshwater Aquatic Products in Guangdong, 2004-2009
Major Exported Aquatic Products in Guangdong, 2009
Major Imported Aquatic Products in Guangdong, 2009
Output of Saltwater and Freshwater Aquaculture Products in Zhejiang, 2004-2009
Variety, Volume and Value of Major Exported Aquatic Products in Zhejiang, Jan.-Sep., 2009-2010
Export Destinations, Export Volume and Export Value of Aquatic Products in Zhejiang, Jan.-Sep.,2010
Operating Income and Net Income of Dalian Yiqiao Marine Seeds, 2007-Jun.2010
Operating Income of Dalian Yiqiao Marine Seeds by Sector and Product, Jan.-Jun.,2010
Regional Market Sales and Percentage of Dalian Yiqiao Marine Seeds, 2007-Jun. 2010
Operating Income of Dalian Yiqiao Marine Seeds by Region, Jan.-Jun. ,2010
Vertical Integrated Industry Chain of Zhanjiang Guolian Aquatic Products Co., Ltd
Operating Income and Net Income of Zhanjiang Guolian Aquatic Products, 2007-Sep.2010
Operating Income,Operating Profit and Net Income of Zhanjiang Guolian Aquatic Products, 2007-Sep.2010
Major Businesses of Zhanjiang Guolian Aquatic Products by Variety, H1 2010
Operating Income, Cost and Gross Margin of Guolian Aquatic Products, H1 2010
Operating Income and YoY Growth of Guolian Aquatic Products by Region, H1 2010
Production Edge of Guolian Aquatic Products
Product Varieties and Applications of Guangdong Haid Group
Operating Income and Net Income of Guangdong Haid Group, 2006-Sep.2010
Major Businesses of Guangdong Haid Group by Sector, Jan.-Jun. ,2010
Operating Income and Gross Margin of Guangdong Haid Group by Product, Jan.-Jun. ,2010
Business Pattern of HOMEY Group International
Operating Income and Net Income of HOMEY Group International, 2008-Sep.2010
Operating Income and Profit Margin of HOMEY Group International by Product and Sector, 2009
Operating Income and Profit Margin of HOMEY Group International by Product and Sector, Jan.-Jun., 2010
Sea Area Resources of HOMEY Group International
Operating Income and Profit Margin of Dahu Aquaculture Company Limited by Product and Sector, Jan.-Jun.,2010
Operating Income and Net Income of Dahu Aquaculture Company Limited, 2008-Jun.2010
Waters Area and Yield per Mu of Shandong Oriental Ocean Sci-Tech
Major Businesses and Gross Margin of Shandong Oriental Ocean Sci-Tech by Sector, Jan.-Jun., 2010
Major Businesses of Shandong Oriental Ocean Sci-Tech by Region, Jan.-Jun., 2010
Major Businesses and Net Income of Shandong Oriental Ocean Sci-Tech, 2007-Sep.2010
Operating Income and Gross Margin of Zhangzidao Fishery Group by Product, Jan.-Jun., 2010
Major Businesses and Gross Margin of Zhangzidao Fishery Group by Sector, Jan.-Jun., 2010
Operating Income and Net Income of Zhangzidao Fishery Group, 2007-Sep.2010
Major Businesses and Percentage of Zhangzidao Fishery Group by Region, Jan.-Jun., 2010
Five Largest Industry Bases of Dalian RainLion Group
如果这份报告不能满足您的要求,我们还可以为您定制报告,请 留言说明您的详细需求。
|