|
|
|
报告导航:研究报告—
TMT产业—电子半导体
|
|
2010-2011年全球及中国中小显示屏行业研究报告 |
 |
字数:2.2万 |
页数:115 |
图表数:104 |
|
中文电子版:7500元 |
中文纸版:3750元 |
中文(电子+纸)版:8000元 |
|
英文电子版:2200美元 |
英文纸版:2300美元 |
英文(电子+纸)版:2500美元 |
|
编号:ZYW066
|
发布日期:2011-05 |
附件:下载 |
 |
|
|
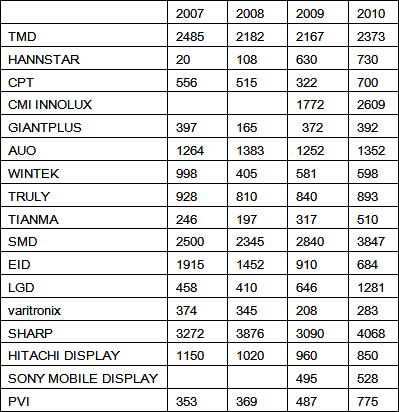
中小显示屏指11英寸以下的显示屏。随着高世代(Generation)TFT-LCD 生产线的大量投产,原来主攻大尺寸的3代-5.5代线的厂商竞争力明显不如6代-10代TFT-LCD生产线。这些厂家陆续转型成为中小显示屏厂家,因此市场供过于求的现象开始出现,尤其在中尺寸(5-11英寸)领域,价格大幅度下降。 中小显示屏行业产值在2006年出现下滑,但是市场也逐渐发生了变化。 首先,随着智能手机的快速增长,手机显示屏的尺寸越来越大。主流智能手机的显示屏尺寸达到3.5英寸,高端智能手机的显示屏达到4.3英寸,是普通手机的2倍。分辨率(Resoultion)也越来越高,主流分辨率为800*480或800*854,高端分辨率达到960*640,是普通手机的4倍。 手机显示屏的平均价格(ASP)由连续下跌转为持续上涨,2010年手机显示屏平均价格为8.06美元,比2009年增长11.8%。预计到2013年,手机显示屏的平均价格都处于上涨态势中。 其次,中尺寸显示屏市场开始爆发。2009年上网本的大量出现,使得中小尺寸显示屏行业在经济危机的背景中依然取得了增长。2010年,则是平板电脑的大量出货带动中尺寸显示屏市场的成长。 中小显示屏行业在一年内也经历了比较大的变动。华映(CPT)和彩晶(HANNSTAR)彻底转型为中小显示屏厂家。CPT在2010年出货量高达3.52亿片,比2009年增长135%;HANNSTAR在2010年出货量高达2.48亿片,比2009年增长505%。虽然出货量大增,但是平均单价不高,毛利低。加上TFT-LCD生产线的高额折旧费用,这两个厂家还处于亏损的泥潭之中。 三星移动显示(SMD)在OLED耕耘多年以后,终于在2010年取得重大突破。依靠一条折旧完毕的4.5代 LTPS TT-LCD生产线,SMD的OLED出货量大增。三星、诺基亚、HTC和联想都大量采用OLED做手机显示屏。2010年OLED产业产值比2009年增长92%,这其中SMD贡献超过95%。2011年,SMD也将靠OLED力压夏普,成为全球第一大中小显示屏厂家。 2010年下半年,因为LG Display产能不足,苹果iPhone显示屏增加了供应商,夏普和TMD入选。夏普本来就为苹果供应除iPhone和iPad之外的显示屏。受到苹果的长期订单和巨额现金支援,夏普重开了2008年底因为经济危机而关闭的天理(TENRI)和三重(MIE)的三条中小尺寸显示屏生产线。 2010年底, 鸿海有意收购日立显示50%的股权,出价1000亿日元,但没用谈妥。2011年初,SONY MOBILE DISPLAY 将旗下子公司STMD卖给京瓷。在卖出STMD同时,索尼买下了爱普生显示器件(EID)的4代线,同时花7.8亿人民币收购爱普生在苏州的后段模组厂。 在2004、2005还是全球第一大中小显示屏厂商的爱普生,最近几年的业绩连续下滑,很有可能最终退出此领域。 2007-2010年全球主要中小尺寸面板厂家收入(百万美元) 整理:水清木华研究中心
The small & medium-sized display devices refer to the ones sized
below 11 inches. Along with the massive operation of high-generation
TFT-LCD production lines, the original manufacturers specialized in
large-sized G3-G5.5 lines have been markedly inferior to those of G6-G10
TFT-LCD production lines; in consequence, they have successively
transferred into the fabrication of small & medium-sized display
devices, which initiated the oversupply, particularly in the
medium-sized field (5-11 inches) whose price plunged. The output value of small & medium-sized display devices dropped in 2006 and the market underwent changes. Firstly,
mobile phone display features even larger sizes as the smart phone
flourishes. The display size of mainstream smart phone reaches 3.5
inches, and that of the high-end one rests on 4.3 inches which is the
double of that of common mobile phone. The resolution also becomes
higher, with the mainstream one of 800*480 or 800*854, and the high-end
one of 960*640, a quadruple of the common mobile phone. The ASP
of mobile phone display has been on the rise from the ever falling
status. It turned out to be US$8.06 in 2010, up 11.8% against 2009, and
promisingly, it will maintain the growth momentum by 2013. Secondly,
the medium-sized display market thrives. As the netbook was massively
rolled out into the market in 2009, the small & medium-sized display
industry still achieved growth against the economic crisis. And in
2010, the large shipment of tablet PC fueled the growth of medium-sized
display market. The small & medium-sized display industry
experienced sharp fluctuations in 2010. CPT and HANNSTAR were completely
transformed into the manufacturers of small & medium-sized display
devices. The shipment of CPT in 2010 was as high as 352 million, up 135%
from 2009; and that of HANNSTAR registered 248 million, up 505% against
2009. However, subject to the not high average unit price and the low
gross profit despite the booming shipment, as well as the high
depreciation of TFT-LCD production line, both of the manufacturers were
suffering from loss. SMD has been engaged in OLED for years,
and it ultimately made significant breakthrough in 2010. By virtue of
the fully depreciated G4.5 LTPS TFT-LCD production line, the OLED
shipment of SMD greatly expanded. Samsung, Nokia, HTC, and Lenovo
massively employed OLED as mobile phone display. In 2010, the output
value of OLED industry rose 92% from 2009, of which SMD contributed more
than 95%. In 2011, SMD will excel Sharp by means of OLED and blossom
into the world’s largest manufacturer of small & medium-sized
display. In H2 2010, due to the deficient capacity of LG
Display, Apple iPhone increased its display suppliers Sharp and TMD.
Sharp originally provided display devices for Apple except iPhone and
iPad. Benefiting from the long-term orders and the fabulous cash support
of Apple, Sharp reopened the three production lines (closed at the end
of 2008 because of the economic downturn) of small & medium-sized
display devices of TENRI and MIE. In late 2010, Hon Hai
intended to purchase ? 50% equities of Hitachi Display for JPY100
billion, but the negotiation failed. In early 2011, Sony Mobile Display
sold its subsidiary-STMD to Kyocera; meanwhile, Sony acquired the G4
line of EID, and purchased the back-end module fab of Epson in Suzhou
for RMB780 million. Epson, the global largest manufacturer of
small & medium-sized display in 2004 and 2005, has witnessed the
declined performance during the recent years, and it is probable to
retreat from the field ultimately.
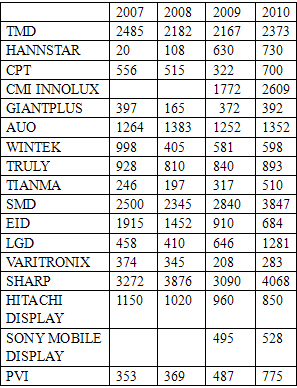
Revenue of Global Major Small & Medium-sized Panel Manufacturers, 2007-2010 (US$ mln)  Source: ResearchInChina
第一章、 中小尺寸面板简介
第二章、中小尺寸产业现状与未来
2.1、中小尺寸面板行业规模
2.2、中小尺寸面板技术现状
2.3、中小尺寸面板下游应用
2.4、中小尺寸面板地域格局
2.5、全球中小尺寸显示屏厂家收入、出货量对比
第三章、中小尺寸面板相关行业分析
3.1、手机
3.1.1、手机市场规模
3.1.2、手机产业格局
3.1.3、智能手机市场与产业
3.1.4、中国手机产业
3.2、手机显示屏市场现状与未来
3.3、手机显示屏主要厂家市场占有率
3.4、手机显示屏厂家与手机厂家配套关系
3.5、平板电脑与上网本市场
3.6、平板电脑与上网本显示屏主要厂家市场占有率
3.7、数码相机与数码相机显示屏市场
3.8、车载显示屏与PND市场
3.9、车载显示屏与PND产业
3.10、数码相框(DPF)
3.11、电子书阅读器(E-Reader)
3.12、元太科技
第四章、OLED
4.1、OLED产业规模
4.2、OLED产业格局
第五章、中小尺寸显示屏厂家研究
5.1、LG DISPLAY
5.2、AUO
5.3、WINTEK
5.4、TRULY
5.5、TIANMA
5.6、BOE
5.7、SMD
5.8、EID
5.9、HANNSTAR
5.10、CPT
5.11、CHIMEI INNOLUX
5.12、Varitronix
5.13 GIANTPLUS
5.14、Sony Mobile Display
5.15、SHARP
5.16、HITACHI DISPLAY
5.17、TMD
1 Profile of Small & Medium-sized Panels
2 Status Quo and Future of Small & Medium-sized Industry
2.1 Scale of Small & Medium-sized Panel Industry
2.2 Current Technology of Small & Medium-sized Panels
2.3 Applications of Small & Medium-sized Panels
2.4 Regional Pattern of Small & Medium-sized Panels
2.5 Revenue and Shipment of Small & Medium-sized Display Manufacturers Worldwide
3 Industries Related to Small & Medium-sized Panels
3.1 Mobile Phone
3.1.1 Market Size
3.1.2 Industry Pattern
3.1.3 Smartphone Market and Industry
3.1.4 Chinese Mobile Phone Industry
3.2 Status Quo and Future of Mobile Phone Display Market
3.3 Market Shares of Major Mobile Phone Display Manufacturers
3.4 Supply Relationship between Mobile Phone Display Manufacturers and Mobile Phone Manufacturers
3.5 Tablet PC and Netbook Market
3.6 Market Shares of Tablet PC and Netbook Display Manufacturers
3.7 Digital Camera and Its Display Market
3.8 On-board Display and PND Market
3.9 On-board Display and PND Industry
3.10 DPF
3.11 E-Reader
4 OLED
4.1 Industry Scale
4.2 Industry Pattern
5 Manufacturers of Small & Medium-sized Display Devices
5.1 LG DISPLAY
5.2 AUO
5.3 WINTEK
5.4 TRULY
5.5 TIANMA
5.6 BOE
5.7 SMD
5.8 EID
5.9 HANNSTAR
5.10 CPT
5.11 CHIMEI INNOLUX
5.12 Varitronix
5.13 GIANTPLUS
5.14 Sony Mobile Display
5.15 SHARP
5.16 HITACHI DISPLAY
5.17 TMD
2004-2011年全球中小尺寸面板行业收入与增幅
2004-2011年全球中小尺寸面板出货量
2009-2011年全球中小尺寸面板产值技术分布
2009-2011年全球中小尺寸面板出货量技术分布
2010年全球中小尺寸面板产值下游应用分布
2010年全球中小尺寸面板出货量下游应用分布
2010年全球中小尺寸面板产值地域分布
2010年全球中小尺寸面板出货量地域分布
2007-2014年全球手机出货量
2008年1季度-2011年1季度每季度全球手机出货量 与年度增幅
2009-2010年全球主要手机品牌出货量
2009年1季度-2010年4季度全球五大手机厂家运营利润率
2011年1季度全球主要智能手机厂家市场占有率
2010-2011年全球主要手机厂家智能手机出货量
2000-2010年中国手机出口量与增幅
2002-2010年中国手机出口额与增幅
2002-2010年中国手机出口量与ASP
2010年中国手机产量地域分布
2007-2013年手机显示屏出货量与手机显示屏平均价格
2007-2013年手机显示屏市场规模
2007-2013年手机显示屏市场技术分布(REVENUE)
2007-2013年手机显示屏出货量尺寸分布
2008-2012年手机显示屏出货量分辨率(RESOLUTION)分布
2010年全球手机显示屏主要厂家出货量市场占有率
2010年全球手机显示屏主要厂家收入市场占有率
2010年中国大陆手机显示屏收入市场占有率
2010年诺基亚手机显示屏出货量主要厂家供应比例
2010年三星手机显示屏出货量主要厂家供应比例
2010年LG手机显示屏出货量主要厂家供应比例
2010年RIM、APPLE、HTC、MOTOROLA、SE、ZTE手机显示屏出货量主要厂家供应比例
2007-2013年全球笔记本电脑出货量与增幅
2008-2012年NETBOOK、iPad、平板电脑出货量
2010年平板电脑/上网本面板主要厂家市场占有率(REVENUE)
2010年平板电脑/上网本面板主要厂家市场占有率(SHIPMENT)
2011年平板电脑/上网本面板主要厂家市场占有率(SHIPMENT)
2004-2011年数码相机出货量统计及预测
2009年全球主要数码相机厂家市场占有率(按销量)
2010年全球数码相机显示屏供应厂家市场占有率(按出货量)
2009年1季度-2010年4季度车载显示屏与PND出货量
2007-2012年PND与车载显示器出货量
2010年PND显示屏主要厂家市场占有率(shipment)
2010年车载显示屏主要厂家市场占有率(shipment)
2010年车载面板尺寸分布
2005-2011年数码相框出货量与增幅
2010年数码相框显示屏主要厂家市场占有率(SHIPMENT)
2009年电子书阅读器成本结构
2010年电子书阅读器成本结构
2005-2011年元太收入、毛利率与运营利润率
2006-2013年OLED产值
2007-2013年AM-OLED出货量下游应用分布
2009-2011年全球主要OLED厂家收入
2010年2季度全球主要OLED厂家出货量市场占有率
2002-2010年LG DISPLAY收入与毛利率
2002-2010年LG DISPLAY收入与运营利润率
2009年1季度-2011年1季度LG DISPLAY每季度收入与运营利润率、毛利率
2009年1季度-2011年1季度LG DISPLAY每季度出货量与平均价格
2009年1季度-2011年1季度LG DISPLAY每季度产品下游应用分布
2004-2011年友达收入与运营利润率
2009年1季度-2011年1季度友达中小尺寸面板收入、出货量与平均价格
2009年1季度-2011年1季度友达收入下游应用分布
友达2011年1季度各生产线产能
2003-2011年胜华收入与毛利率
2003-2011年胜华收入与运营利润率
2006-2011年胜华收入产品分布
2009-2010年胜华客户结构
2001-2010年信利半导体毛利率、纯利率、运营利润率统计
2006-2009年信利液晶产品收入技术分布
2005-2010年深天马收入与利润总额
2010年天马收入分布(按产品)
2009-2013年SMD收入与EBITDA
2009年1季度-2011年1季度SMD每季度收入与运营利润率
2009年1季度-2011年1季度SMD出货量与平均售价
2010年1季度-2011年2季度SMD收入产品分布
2006-2010财年EID收入技术分布
2003-2011年彩晶收入与运营利润率
2009年1季度-2011年1季度彩晶收入与中小尺寸出货量
2004-2010年华映收入与运营利润率
2008年4季度-2010年4季度华映大尺寸TFT-LCD面板出货量与ASP
2008年4季度-2010年4季度华映中小尺寸TFT-LCD面板出货量与收入
2009年1季度-2010年4季度新奇美(CHIMEI INNOLUX)收入、EBITDA、毛利率
2009年1季度-2010年4季度新奇美(CHIMEI INNOLUX)大尺寸面板出货量与ASP
2009年1季度-2010年4季度新奇美(CHIMEI INNOLUX)中小尺寸面板出货量与ASP
2009年1季度-2010年4季度新奇美(CHIMEI INNOLUX)收入下游应用分布
2009年1季度-2010年4季度新奇美(CHIMEI INNOLUX)收入尺寸分布
2002-2010年精电国际收入与运营利润率
2007-2010年精电收入地域分布
2002-2010年凌巨收入与毛利率
全球主要中小尺寸面板厂家2009-2010年出货量
2007-2011年全球主要中小尺寸面板厂家收入(百万美元)
2010年1季度-2011年1季度全球主要手机品牌出货量
2011年1季度全球主要手机品牌销售额(单位:百万美元)
2010年3季度全球智能手机操作系统出货量
2010年1季度-2011年4季度SMD OLED产能\产量\收入\成本\毛利
LG DISPLAY中小尺寸产品一览
友达手机显示屏产品
SMD产品一览
EID产品一览
2009年华映大陆公司简介及财务数据
2010年4季度新奇美(CHIMEI INNOLUX)各生产线产能
奇美电子中小尺寸产品
夏普常见中小尺寸LCD产品
日立显示TFT-LCD面板生产线简介
2003-2010财年TMD收入统计
TMDisplay TFT-LCD面板生产线
Revenue and Growth Margin of Global Small & Medium-sized Panel Industry, 2004-2011
Shipment of Small & Medium-sized Panel Worldwide, 2004-2011
Output Value of Small & Medium-sized Panel Worldwide by Technology, 2009-2011
Shipment of Small & Medium-sized Panel Worldwide by Technology, 2009-2011
Output Value of Small & Medium-sized Panel Worldwide by Application, 2010
Shipment of Small & Medium-sized Panel Worldwide by Application, 2010
Output Value of Small & Medium-sized Panel Worldwide by Region, 2010
Shipment of Small & Medium-sized Panel Worldwide by Region, 2010
Global Mobile Phone Shipment, 2007-2014E
Global Mobile Phone Shipment and Annual Growth Margin, 2008Q1-2011Q1
Shipment of Major Mobile Phone Brands Worldwide, 2009-2010
Operating Margin of Global Top 5 Mobile Phone Manufacturers, 2009Q1-2010Q4
Market Share of Global Major Smartphone Manufacturers, 2011Q1
Smartphone Shipment of Global Major Mobile Phone Manufacturers, 2010-2011
Export Volume and Growth Margin of Mobile Phones in China, 2000-2010
Export Value and Growth Margin of Mobile Phones in China, 2002-2010
Export Volume and ASP of Mobile Phones in China, 2002-2010
Mobile Phone Output in China by Region, 2010
Shipment and Average Price of Mobile Phone Display, 2007-2013E
Market Size of Mobile Phone Display, 2007-2013E
Technology Distribution of Mobile Phone Display Market, 2007-2013E
Shipment of Mobile Phone Display by Size, 2007-2013E
Shipment of Mobile Phone Display by Resolution, 2008-2012E
Market Share of Major Mobile Phone Display Manufacturers Worldwide by Shipment, 2010
Market Share of Major Mobile Phone Display Manufacturers Worldwide by Revenue, 2010
Market Share of Mobile Phone Display Manufacturers in Mainland China by Revenue, 2010
Supply Proportion of Nokia Mobile Phone Display Shipment by Manufacturer, 2010
Supply Proportion of Samsung Mobile Phone Display Shipment by Manufacturer, 2010
Supply Proportion of LG Mobile Phone Display Shipment by Manufacturer, 2010
Supply Proportion of RIM, APPLE, HTC, MOTOROLA, SE, and ZTE Mobile Phone Display Shipment by Manufacturer, 2010
Global Notebook PC Shipment and Growth Margin, 2007-2013E
Shipment of NETBOOK, iPad, and Tablet PC, 2008-2012E
Market Share of Tablet PC/ Netbook Panel Manufacturers by Revenue, 2010
Market Share of Tablet PC/ Netbook Panel Manufacturers by Shipment, 2010
Market Share of Tablet PC/ Netbook Panel Manufacturers by Shipment, 2011
Shipment of Digital Camera, 2004-2011
Market Share of Global Major Digital Camera Manufacturers by Sales Volume, 2009
Market Share of Global Digital Camera Display Suppliers by Shipment, 2010
Shipment of On-board Display and PND, 2009Q1-2010Q4
Shipment of PND and On-board Display, 2007-2012E
Market Share of PND Manufacturers by Shipment, 2010
Market Share of On-board Display Manufacturers by Shipment, 2010
On-board Panel Distribution by Size, 2010
DPF Shipment and Growth Margin, 2005-2011
Market Share of DPF Display Manufacturers by Shipment, 2010
Cost Structure of E-reader, 2009
Cost Structure of E-reader, 2010
Revenue, Gross Margin, and Operating Margin of E Ink, 2005-2011
OLED Output Value, 2006-2013E
AM-OLED Shipment by Application, 2007-2013E
Revenue of Global Major OLED Manufacturers, 2009-2011
Market Share of Global Major OLED Manufacturers by Shipment, 2010Q2
Revenue and Gross Margin of LG DISPLAY, 2002-2010
Revenue and Operating Margin of LG DISPLAY, 2002-2010
Revenue, Operating Margin, and Gross Margin of LG DISPLAY, 2009Q1-2011Q1
Shipment and Average Price of LG DISPLAY, 2009Q1-2011Q1
Product Distribution of LG DISPLAY by Application, 2009Q1-2011Q1
AUO Revenue and Operating Margin, 2004-2011
Revenue, Shipment, and Average Price of AUO Small & Medium-sized Panels, 2009Q1-2011Q1
AUO Revenue by Application, 2009Q1-2011Q1
Capacity of AUO Production Lines, 2011Q1
WINTEK Revenue and Gross Margin, 2003-2011
WINTEK Revenue and Operating Margin, 2003-2011
WINTEK Revenue by Product, 2006-2011
Client Structure of WINTEK, 2009-2010
Gross Margin, Net Profit Margin, and Operating Margin of Truly Semiconductors, 2001-2010
Revenue of Truly LCD Products by Technology, 2006-2009
TIANMA Revenue and Total Profit, 2005-2010
TIANMA Revenue by Product, 2010
SMD Revenue and EBITDA, 2009-2013E
SMD Revenue and Operating Margin, 2009Q1-2011Q1
SMD Shipment and ASP, 2009Q1-2011Q1
SMD Revenue by Product, 2010Q1-2011Q2
EID Revenue by Technology, FY2006-FY2010
HANNSTAR Revenue and Operating Margin, 2003-2011
HANNSTAR Revenue and Small & Medium-sized Panel Shipment, 2009Q1-2011Q1
CPT Revenue and Operating Margin, 2004-2010
Large-sized TFT-LCD Panel Shipment and ASP of CPT, 2008Q4-2010Q4
Small & Medium-sized TFT-LCD Panel Shipment and Revenue of CPT, 2008Q4-2010Q4
Revenue, EBITDA, and Gross Margin of CHIMEI INNOLUX, 2009Q1-2010Q4
Large-sized Panel Shipment and ASP of CHIMEI INNOLUX, 2009Q1-2010Q4
Small & Medium-sized Panel Shipment and ASP of CHIMEI INNOLUX, 2009Q1-2010Q4
Revenue of CHIMEI INNOLUX by Application, 2009Q1-2010Q4
Revenue of CHIMEI INNOLUX by Size, 2009Q1-2010Q4
Varitronix Revenue and Operating Margin, 2002-2010
Varitronix Revenue by Region, 2007-2010
GIANTPLUS Revenue and Gross Margin, 2002-2010
Shipment of Global Major Small & Medium-sized Panel Manufacturers, 2009-2010
Revenue of Global Major Small & Medium-sized Panel Manufacturers, 2007-2011
Shipment of Major Mobile Phone Brands Worldwide, 2010Q1-2011Q1
Sales of Major Mobile Phone Brands Worldwide, 2011Q1
Shipment of Smartphone Operating System Worldwide, 2010Q3
SMD OLED Capacity, Output, Revenue, Cost, and Gross Profit, 2010Q1-2011Q4
Small & Medium-sized Products of LG DISPLAY
AUO Mobile Phone Displays
Products of SMD
Products of EID
Profile and Financial Data of CPT Mainland Branches, 2009
Capacity of CHIMEI INNOLUX Production Lines, 2010Q4
Small & Medium-sized Products of CHIMEI INNOLUX
Small & Medium-sized LCD Products of SHARP
TFT-LCD Panel Production Line of HITACHI DISPLAY
TMD Revenue, FY2003-FY2010
TFT-LCD Panel Production Line of TMDisplay
如果这份报告不能满足您的要求,我们还可以为您定制报告,请 留言说明您的详细需求。
|