|
|
|
报告导航:研究报告—
金融与服务业—零售与日用
|
|
2011年中国纺织面料行业研究报告 |
 |
字数:2.9万 |
页数:98 |
图表数:94 |
|
中文电子版:7000元 |
中文纸版:3500元 |
中文(电子+纸)版:7500元 |
|
英文电子版:2100美元 |
英文纸版:2200美元 |
英文(电子+纸)版:2400美元 |
|
编号:ZJF021
|
发布日期:2011-05 |
附件:下载 |
 |
|
|
中国是世界上最大的棉花、羊绒、麻和丝绸的生产国,也是最大的纺织品生产国和出口国。2010年,中国纺织工业规模以上企业总产值达到47650亿元,同比增长12.7%;面料出口金额356.84亿美元,同比增长30.81%,出口数量达到288.31亿米,同比增长17.5%。 图:2002-2011年中国布产量(单位:亿米) 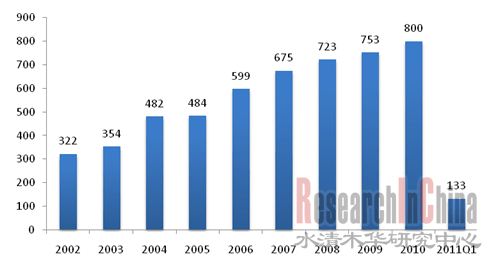 来源:国家统计局,水清木华研究中心 原材料的成本上涨、技术研发与创新、汇率和贸易壁垒等带来的额外成本等因素造成了面料价格的持续上升,2010年纯棉面料价格上涨近100%,真丝面料价格增长30%以上。纺织面料产销基本平衡,产销率保持在99%以上。 尽管纺织面料价格上涨较快,但随着人们生活水平的提高,市场对其下游包括服装、家居用品、商用纺织品的需求也越来越大。因此,纺织面料产业仍有巨大的挖掘潜力,尤其具有高质量、健康、时尚的产品更能获得市场认可。 图:2002-2011年4月中国服装产量(单位:百万件) 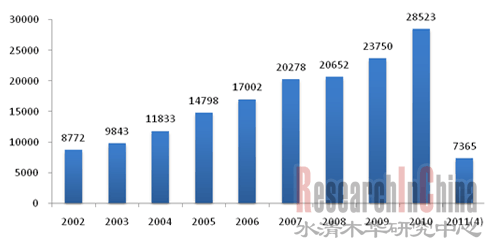 来源:国家统计局,水清木华研究中心 截止2010年末,中国共有超过32,000家纺织企业,其中绝大多数企业均有纺织面料业务。各厂商在不同的细分市场上有着不同表现: 棉纺(Cotton Fabric): 魏桥纺织股份有限公司(Weiqiao Textile Co., Ltd.)是中国最大的棉纺织生产商,最大的纺织品服装出口企业,也是目前世界上纺织能力最大的棉纺织企业。年产棉纱线88.2万吨、坯布16.34亿米、牛仔布1.75亿米。 毛纺(Woolen Fabric):江苏阳光股份有限公司(Jiangsu Sunshine Co., Ltd.)是国内最大的精毛纺生产企业,年产精纺呢绒1800万米,高档服装120万套,80支以上的高档产品占中国高档面料市场的75%以上的市场份额。 丝绸(Silk Fabric): 浙江嘉欣丝绸股份有限公司(Zhejiang Jiaxin Silk Co., Ltd)中国最大的丝绸产品生产和出口企业之一,年产(加工)印花及染色布2000多万米、梭织绸50多万米、针织绸300吨、喷织绸100多万米、服装500万件(套)。 麻纺(Hemp Fabric): 湖南华升集团公司(Hunan Huasheng Group Corp. )是全国最大的专业从事麻类纺织品及服装生产和出口的企业,其年产长麻纺5.5万锭,棉纺锭5万锭,年生产能力为苎麻纱1.2万吨,坯布3200万米,印染布1200万米,服装300万件。 纺织化纤(Chemical Fiber Fabric): 吉林化纤集团有限责任公司(Jilin Chemical Fiber Group Co., Ltd.)是中国最重要的化纤原料及产品生产基地之一,年生产能力粘胶短纤维6.5万吨,粘胶长丝2.2万吨,化纤浆粕5.5万吨,竹短纤5万吨,综合生产能力44.6万吨。
China is the largest producer of cotton, cashmere, flax, and silk, as
well as the biggest manufacturer and exporter of textiles in the world.
In 2010, the output value of enterprises above the designated size (i.e.
with annual sales above RBM5 million) in Chinese textile industry
totaled RMB4765 billion, up 12.7% YoY; the export value of fabrics
reached US$35.68 billion, up 30.81% YoY, and the export volume hit 28.83
billion meters, up 17.5% YoY. Fabric Output in China, 2002-2011 (Unit: 100M meters) 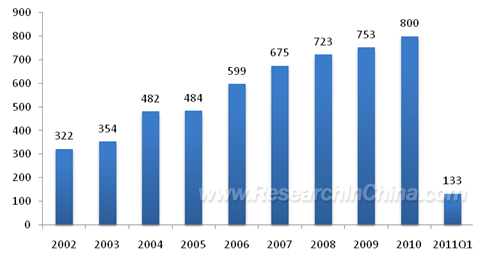 Source: National Bureau of Statistics of China; ResearchInChina Subject
to factors like the additional costs resulted from the climbing cost of
raw materials, technical R&D and innovations as well as exchange
rate and trade barriers, the prices of fabrics have been on the rise. In
2010, the price of pure cotton fabric rose approximately 100%, and that
of silk fabric expanded more than 30%. The output and sales of textile
fabric achieved a rough balance, and the output-sales ratio hovered
above 99%. Along with the improvement of people’s living
standard, the market demand for downstream products like clothes,
household articles, and commercial textiles has been increasing despite
the rapidly rising prices of textile fabrics; consequently, textile
fabric industry still boasts huge development potentiality, and
high-quality, healthy, and fashionable products can gain greater market
recognition, especially. Clothing Output in China, 2002-2011 (Unit: mln pieces) 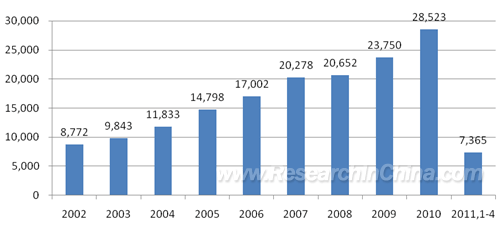 Source: National Bureau of Statistics of China; ResearchInChina Up
to the end of 2010, China had been in possession of over 32,000 textile
enterprises, a majority of which had been engaged in textile fabric
business. The performances of the manufacturers varied in different
market segments. Cotton Fabric:
Weiqiao Textile Co., Ltd.
is the largest cotton fabric manufacturer and textile clothing exporter
in China, as well as the cotton fabric enterprise with the most
powerful textile capability across the world. It boasts the annual
output of 882-kiloton cotton yarn, 1,634 million meters of greige cloth,
and 175 million meters of jean. Woolen Fabric:
Jiangsu Sunshine Co., Ltd.,
the largest domestic manufacturer of worsted fabric, characterizes the
annual output of 18 million meters of worsted wool and 1.20 million
suits of top-grade clothing. Its top-grade products of above 80S enjoy
more than 75% shares in Chinese high-grade fabric market. Silk Fabric:
Zhejiang Jiaxin Silk Co., Ltd., one
of the biggest producers and exporters of silk products in China,
features the annual output (processing) of over 20 million meters of
printing & dyeing fabric, more than 500 km tatting silk, 300-ton
knitted silk, over 1 million meters of jet-weaving silk, and 5 million
pieces (suits) of clothes. Hemp Fabric:
Hunan Huasheng Group Corp.
is the largest domestic enterprise specializing in the production and
export of hemp fabrics and clothes. It boasts the annual output of
55K-spindle long hemp fabric and 50K-spindle cotton fabric, and the
annual capacity of 12-kiloton ramie yarn, 32 million meters of greige
cloth, 12 million meters of printing & dyeing fabric, and 3 million
pieces of clothing. Chemical Fiber Fabric:
Jilin Chemical Fiber Group Co., Ltd., one
of the most important production bases of chemical fiber raw materials
and products in China, possesses the annual capacity of 65-kiloton
viscose staple fiber, 22-kiloton viscose filament, 55-kiloton chemical
fiber pulps, and 50-kiloton bamboo staple fiber, with the comprehensive
production capacity of 446 kilotons.
第一章 中国纺织面料产业概述
1.1 纺织面料定义与分类
1.2 纺织面料市场规模
1.3 市场供需
1.3.1 市场供给
1.3.2 市场需求
1.4 进出口分析
第二章 中国纺织面料业发展环境
2.1 产业环境
2.2 政策环境
2.3 技术环境
2.4 中国纺织面料上下游发展状况
2.4.1 中国纺织面料上游发展状况
2.4.1.1 棉花
2.4.1.2毛绒
2.4.1.3 蚕丝
2.4.1.4 纱线
2.4.1.5 化纤
2.4.2 中国纺织面料下游发展状况
2.4.2.1 服装
2.4.2.2 家用纺织品
2.4.2.3 产业用纺织品
第三章 纺织面料业细分行业分析
3.1 棉纺
3.1.1 棉纺市场概况
3.1.2 地区产量
3.1.3 重点企业
3.2 毛纺
3.2.1 毛纺市场概况
3.2.2 地区产量
3.2.3 重点企业
3.3 丝绸
3.3.1丝绸市场概况
3.3.2 地区产量
3.3.3 重点企业
3.4 麻纺
3.4.1 麻纺市场概况
3.4.2 地区产量
3.4.3 重点企业
3.5 纺织化纤
3.5.1 纺织化纤市场概况
3.5.2 地区产量
3.5.3 重点企业
第四章 中国纺织面料业主要公司分析
4.1 华芳股份有限公司
4.1.1 企业简介
4.1.2 华芳股份经营分析
4.1.3 企业发展动态及战略
4.2 鲁泰纺织股份有限公司
4.2.1 企业简介
4.2.2 鲁泰纺织经营分析
4.2.3企业发展动态及战略
4.3 华孚色纺股份有限公司
4.3.1 企业简介
4.3.2 华孚色纺经营分析
4.3.3 企业发展动态及战略
4.4 福建凤竹纺织科技股份有限公司
4.4.1 企业简介
4.4.2 凤竹纺织经营分析
4.4.3 企业发展动态及战略
4.5 魏桥纺织股份有限公司
4.5.1 企业简介
4.5.2 魏桥纺织经营分析
4.5.3 企业发展动态及战略
4.6 宁波维科精华集团股份有限公司
4.6.1 企业简介
4.6.2 维科精华经营分析
4.6.3 企业发展动态及战略
4.7 江苏阳光股份有限公司
4.7.1 企业简介
4.7.2 江苏阳光经营分析
4.7.3 企业发展动态及战略
4.8 宁夏中银绒业股份有限公司
4.8.1 企业简介
4.8.2 中银绒业经营分析
4.8.3 企业发展动态及战略
4.9 山东济宁如意毛纺织股份有限公司
4.9.1 企业简介
4.9.2 山东如意经营分析
4.9.3 企业发展动态及战略
4.10 浙江嘉欣丝绸股份有限公司
4.10.1 企业简介
4.10.2 嘉欣丝绸经营分析
4.10.3 企业发展动态及战略
4.11 江苏新民纺织科技股份有限公司
4.11.1 企业简介
4.11.2 新民科技经营分析
4.11.3 企业发展动态及战略
4.12 湖南华升股份有限公司
4.12.1 企业简介
4.12.2 华升股份经营分析
4.12.3 企业发展动态及战略
4.13 金达控股有限公司
4.13.1 企业简介
4.13.2 金达控股经营分析
4.13.3 企业发展动态及战略
4.14 浙江金鹰股份有限公司
4.14.1 企业简介
4.14.2 金鹰股份经营分析
4.14.3 企业发展动态及战略
4.15吉林化纤股份有限公司
4.15.1 企业简介
4.15.2 吉林化纤经营分析
4.15.3 企业发展动态及战略
4.16江苏霞客环保色纺股份有限公司
4.16.1 企业简介
4.16.2 霞客环保经营分析
4.16.3 企业发展动态及战略
4.17 上海嘉麟杰纺织品股份有限公司
4.17.1 企业简介
4.17.2 嘉麟杰经营分析
4.17.3 企业发展动态及战略
1 Overview of China Textile Fabric Industry
1.1 Definition & Classification
1.2 Market Size
1.3 Supply & Demand
1.3.1 Supply
1.3.2 Demand
1.4 Import & Export
2 Development Environment of China Textile Fabric Industry
2.1 Industry Environment
2.2 Policy Environment
2.3 Technology Environment
2.4 Upstream & Downstream
2.4.1 Upstream
2.4.1.1 Cotton
2.4.1.2 Nap
2.4.1.3 Silk
2.4.1.4 Yarn
2.4.1.5 Chemical Fiber
2.4.2 Downstream
2.4.2.1 Apparel
2.4.2.2 Household Textiles
2.4.2.3 Industrial Textiles
3 Segmented Industries
3.1 Cotton Fabric
3.1.1 Market Overview
3.1.2 Regional Output
3.1.3 Key Enterprises
3.2 Woolen Fabric
3.2.1 Market Overview
3.2.2 Regional Output
3.2.3 Key Enterprises
3.3 Silk Fabric
3.3.1 Market Overview
3.3.2 Regional Output
3.3.3 Key Enterprises
3.4 Hemp Fabric
3.4.1 Market Overview
3.4.2 Regional Output
3.4.3 Key Enterprises
3.5 Chemical Fiber Fabric
3.5.1 Market Overview
3.5.2 Regional Output
3.5.3 Key Enterprises
4 Major Companies
4.1 Huafang Co., Ltd.
4.1.1 Profile
4.1.2 Operation
4.1.3 Developments & Strategy
4.2 Luthai Textile Co., Ltd.
4.2.1 Profile
4.2.2 Operation
4.2.3 Developments & Strategy
4.3 Huafu Top Dyed Melange Yarn Co., Ltd.
4.3.1 Profile
4.3.2 Operation
4.3.3 Developments & Strategy
4.4 Fujian Fynex Textile Science & Technology Co., Ltd.
4.4.1 Profile
4.4.2 Operation
4.4.3 Developments & Strategy
4.5 Weiqiao Textile Co., Ltd.
4.5.1 Profile
4.5.2 Operation
4.5.3 Developments & Strategy
4.6 Ningbo Veken Elite Group Co., Ltd.
4.6.1 Profile
4.6.2 Operation
4.6.3 Developments & Strategy
4.7 Jiangsu Sunshine Co., Ltd.
4.7.1 Profile
4.7.2 Operation
4.7.3 Developments & Strategy
4.8 Ningxia Zhongyin Cashmere Co., Ltd.
4.8.1 Profile
4.8.2 Operation
4.8.3 Developments & Strategy
4.9 Shandong Jining Ruyi Woolen Textile Co., Ltd.
4.9.1 Profile
4.9.2 Operation
4.9.3 Developments & Strategy
4.10 Zhejiang Jiaxin Silk Co., Ltd
4.10.1 Profile
4.10.2 Operation
4.10.3 Developments & Strategy
4.11 Jiangsu Xinmin Textile Science & Technology Co., Ltd.
4.11.1 Profile
4.11.2 Operation
4.11.3 Developments & Strategy
4.12 Hunan Huasheng Co., Ltd.
4.12.1 Profile
4.12.2 Operation
4.12.3 Developments & Strategy
4.13 Kingdom Holdings Ltd.
4.13.1 Profile
4.13.2 Operation
4.13.3 Developments & Strategy
4.14 Zhejiang Golden Eagle Co., Ltd.
4.14.1 Profile
4.14.2 Operation
4.14.3 Developments & Strategy
4.15 Jilin Chemical Fiber Co., Ltd.
4.15.1 Profile
4.15.2 Operation
4.15.3 Developments & Strategy
4.16 Jiangsu Xiake Color Spinning Co., Ltd.
4.16.1 Profile
4.16.2 Operation
4.16.3 Developments & Strategy
4.17 Shanghai Challenge Textile Co., Ltd.
4.17.1 Profile
4.17.2 Operation
4.17.3 Developments & Strategy
表:纺织面料按原料和工艺分类
图:2002-2011年中国纺织行业企业数量
图:2008-2011年4月纺织面料柯桥纺织价格指数
图:2002-2010年第一季度国内布产量
图:2002-2011年第一季度国内无纺布产量
图:2002-2011年第一季度国内毛机织物(呢绒)产量
图:2009-2011年第一季度国内色织布、丝织物和麻纺织物产量
图:2004-2011年第一季度全国棉布产销量
图:2004-2011年第一季度全国混纺交织布产销量
图:2004-2011年第一季度全国纯化纤布产销量
图:2004-2011年第一季度全国呢绒产销量
表:纺织制品出口退税率调整
图:2002-2011年第一季度中国棉纱线进出口数量及单价
图:2002-2011年第一季度中国生丝和山羊绒出口数量及单价
图:2002-2011年第一季度中国毛纺原料进口均价
图:2002-2011年第一季度中国纺织纤维进口均价
图:2002-2011年第一季度中国机织物进出口数量
图:2007-2010年1-11月国内面料进口结构
图:2007-2010年1-11月国内面料出口结构
图:2010年国内面料出口市场
图:2002-2010年国内棉花产量
图:2002-2011年第一季度国内绒线(毛线)产量
图:2002-2010年国内生丝产量
图:2002-2011年第一季度国内纱产量
图:2002-2011年第一季度国内化学纤维产量
图:2002-2011年4月国内服装产量
图:2002-2011年第一季度国内纱各地区产量
图:2002-2011年第一季度国内布各地区产量
表:棉纺面料重点企业
图:2002-2011年第一季度国内绒线(毛线) 主要地区产量
图:2002-2011年第一季度国内毛机织物(呢绒) 主要地区产量
表:毛纺面料重点企业
图:2002-2010年度国内生丝主要地区产量
表:丝绸面料重点企业
图:2009-2011年第一季度国内亚麻布(含亚麻≥55%)主要地区产量
图:2009-2011年第一季度国内苎麻布(含苎麻≥55%)主要地区产量
表:麻纺面料重点企业
图:2002-2011年第一季度国内无纺布各地区产量
表:纺织化纤面料重点企业
图:2006-2010年华芳股份营业收入及利润
图:2010年华芳股份营业收入分产品构成
图:2006-2010年华芳股份主要产品营业收入状况
图:2006-2010年鲁泰纺织总资产情况
图:2006-2010年鲁泰纺织收入及利润情况
图:2010年鲁泰纺织营业收入及利润构成
图:2008-2010年鲁泰纺织产品收入及利润
表:2008-2010年鲁泰纺织产品市场分布
图:2010年鲁泰纺织产品市场分布情况
表:2010年鲁泰纺织主要相关参股控股公司状况
图:2006-2010年华孚色纺收入及利润情况
图:2010年华孚色纺主营收入构成
表:2010年华孚色纺主要纺织面料子公司及经营状况
图:2006-2010年凤竹纺织收入及利润情况
图:2007-2010年凤竹纺织主要产品收入构成
图:2009-2010年凤竹纺织主要产品收入占比
表:2010年凤竹纺织主要子公司经营状况
图:2006-2010年魏桥纺织收入及利润情况
图:2008-2010年魏桥纺织产品收入及利润
图:2008-2010年魏桥纺织产品产量
图:2006-2010年维科精华收入及利润情况
图:2009-2010年维科精华主营收入分产品构成
表:维科精华主要纺织面料子公司
图:2006-2010年江苏阳光收入及利润情况
图:2010年江苏阳光主营收入构成
图:2007-2010年江苏阳光主要产品收入情况
图:2006-2010年中银绒业收入及利润情况
图:2010年中银绒业主营收入构成
表:2010年中银绒业主要子公司经营状况
图:2006-2010年山东如意收入及利润情况
图:2007-2010年山东如意精纺呢绒收入情况
图:2006-2010年嘉欣丝绸收入及利润情况
图:2010年嘉欣丝绸营业收入构成
图:2006-2010年嘉欣丝绸营业收入地区分布
表:2010年嘉欣丝绸纺织业参股控股公司状况
图:2006-2010年新民科技总资产情况
图:2006-2010年新民科技收入及利润情况
图:2010年新民科技营业收入及利润构成
图:2008-2010年新民科技营业收入地区分布
图:2010年新民科技营业收入国内市场分布
表:2010年新民科技主要面料子公司经营状况
图:2006-2010年华升股份收入及利润情况
图:2006-2010年华升股份营业收入构成
图:2010年华升股份营业收入分产品构成
图:2006-2010年华升股份产品营业利润率
图:2006-2010年金达控股收入及利润情况
图:2006-2010年金鹰股份收入及利润情况
图:2010年金鹰股份营业收入分产品构成
图:2006-2010年吉林化纤营业收入及利润情况
图:2010年吉林化纤营业收入分产品构成
图:2006-2010年霞客环保营业收入及利润情况
图:2006-2010年霞客环保营业收入构成
表:2010年霞客环保主要子公司经营状况
图:2007-2010年嘉麟杰营业收入及利润情况
图:2007-2010年嘉麟杰面料产品收入
Classification of Textile Fabric by Raw Material and Technology
Enterprise Quantity of Chinese Textile Industry, 2002-2011
KQ Price Index of Textile Fabric, 2008-Apr. 2011
Fabric Output in China, 2002-2010Q1
Output of Non-woven Fabric in China, 2002-2011Q1
Output of Woven Woolen Fabrics (Wool) in China, 2002-2011Q1
Output of Dyed Fabric, Silk Fabric, and Hemp Fabric in China, 2009-2011Q1
Output and Sales Volume of Cotton Fabric in China, 2004-2011Q1
Output and Sales Volume of Blended Fabric in China, 2004-2011Q1
Output and Sales Volume of Pure Chemical Fiber Fabric in China, 2004-2011Q1
Output and Sales Volume of Wool in China, 2004-2011Q1
Export Rebate Rate Adjustment of Textile Products
Import & Export Volume and Unit Price of Cotton Yarn in China, 2002-2011Q1
Export Volume and Unit Price of Raw Silk and Cashmere in China, 2002-2011Q1
Average Import Price of Woolen Fabric Raw Materials in China, 2002-2011Q1
Average Import Price of Textile Fiber in China, 2002-2011Q1
Import & Export Volume of Woven Fabric in China, 2002-2011Q1
Import Structure of Fabrics in China, 2007-Nov. 2010
Export Structure of Fabrics in China, 2007-Nov. 2010
Export Markets of Fabrics in China, 2010
Cotton Output in China, 2002-2010
Output of Knitting Wool (Caddice) in China, 2002-2011Q1
Raw Silk Output in China, 2002-2010
Yarn Output in China, 2002-2011Q1
Chemical Fiber Output in China, 2002-2011Q1
Costume Output in China, 2002-Apr. 2011
Yarn Output in China by Region, 2002-2011Q1
Fabric Output in China by Region, 2002-2011Q1
Key Enterprises of Cotton Fabric
Output of Knitting Wool (Caddice) in China by Region, 2002-2011Q1
Output of Woven Woolen Fabrics (Wool) in China by Region, 2002-2011Q1
Key Enterprises of Woolen Fabric
Output of Raw Silk in China by Region, 2002-2010
Key Enterprises of Silk Fabric
Output of Linen (flax content ≥55%) in China by Region, 2009-2011Q1
Output of Ramie Fabric (ramie content ≥55%) in China by Region, 2009-2011Q1
Key Enterprises of Hemp Fabric
Output of Non-woven Fabric in China by Region, 2002-2011Q1
Key Enterprises of Chemical Fiber Fabric
Operating Income and Profit of Huafang Co., Ltd., 2006-2010
Operating Income of Huafang Co., Ltd. by Product, 2010
Operating Income of Huafang Co., Ltd. by Product, 2006-2010
Total Assets of Luthai Textile Co., Ltd., 2006-2010
Revenue and Profit of Luthai Textile Co., Ltd., 2006-2010
Operating Income and Profit of Luthai Textile Co., Ltd., 2010
Revenue and Profit of Luthai Textile Co., Ltd. by Product, 2008-2010
Product Market Distribution of Luthai Textile Co., Ltd., 2008-2010
Product Market Distribution of Luthai Textile Co., Ltd., 2010
Equity Participation and Holding Companies of Luthai Textile Co., Ltd., 2010
Revenue and Profit of Huafu Top Dyed Melange Yarn Co., Ltd., 2006-2010
Operating Income Structure of Huafu Top Dyed Melange Yarn Co., Ltd., 2010
Major Textile Fabric Subsidiaries and Their Operation of Huafu Top Dyed Melange Yarn Co., Ltd., 2010
Revenue and Profit of Fujian Fynex Textile Science & Technology Co., Ltd., 2006-2010
Revenue of Fujian Fynex Textile Science & Technology Co., Ltd. by Product, 2007-2010
Revenue Proportion of Fujian Fynex Textile Science & Technology Co., Ltd. by Product, 2009-2010
Operation of Subsidiaries of Fujian Fynex Textile Science & Technology Co., Ltd., 2010
Revenue and Profit of Weiqiao Textile Co., Ltd., 2006-2010
Revenue and Profit of Weiqiao Textile Co., Ltd. by Product, 2008-2010
Output of Weiqiao Textile Co., Ltd., 2008-2010
Revenue and Profit of Ningbo Veken Elite Group Co., Ltd., 2006-2010
Operating Income of Ningbo Veken Elite Group Co., Ltd. by Product, 2009-2010
Major Textile Fabric Subsidiaries of Ningbo Veken Elite Group Co., Ltd.
Revenue and Profit of Jiangsu Sunshine Co., Ltd., 2006-2010
Operating Income Structure of Jiangsu Sunshine Co., Ltd., 2010
Revenue of Jiangsu Sunshine Co., Ltd. by Product, 2007-2010
Revenue and Profit of Ningxia Zhongyin Cashmere Co., Ltd., 2006-2010
Operating Income Structure of Ningxia Zhongyin Cashmere Co., Ltd., 2010
Operation of Major Subsidiaries of Ningxia Zhongyin Cashmere Co., Ltd., 2010
Revenue and Profit of Shandong Jining Ruyi Woolen Textile Co., Ltd., 2006-2010
Revenue from Worsted Wool of Shandong Jining Ruyi Woolen Textile Co., Ltd., 2007-2010
Revenue and Profit of Zhejiang Jiaxin Silk Co., Ltd, 2006-2010
Operating Income Structure of Zhejiang Jiaxin Silk Co., Ltd, 2010
Operating Income of Zhejiang Jiaxin Silk Co., Ltd by Region, 2006-2010
Equity Participation and Holding Companies of Zhejiang Jiaxin Silk Co., Ltd in Textiel Industry, 2010
Total Assets of Jiangsu Xinmin Textile Science & Technology Co., Ltd., 2006-2010
Revenue and Profit of Jiangsu Xinmin Textile Science & Technology Co., Ltd., 2006-2010
Operating Income and Profit of Jiangsu Xinmin Textile Science & Technology Co., Ltd., 2010
Operating Income of Jiangsu Xinmin Textile Science & Technology Co., Ltd. by Region, 2008-2010
Operating Income of Jiangsu Xinmin Textile Science & Technology Co., Ltd. in Domestic Market, 2010
Operation of Major Fabric Subsidiaries of Jiangsu Xinmin Textile Science & Technology Co., Ltd., 2010
Revenue and Profit of Hunan Huasheng Co., Ltd., 2006-2010
Operating Income Structure of Hunan Huasheng Co., Ltd., 2006-2010
Operating Income of Hunan Huasheng Co., Ltd. by Product, 2010
Operating Margin of Hunan Huasheng Co., Ltd. by Product, 2006-2010
Revenue and Profit of Kingdom Holdings Ltd., 2006-2010
Revenue and Profit of Zhejiang Golden Eagle Co., Ltd., 2006-2010
Operating Income of Zhejiang Golden Eagle Co., Ltd. by Product, 2010
Operating Income and Profit of Jilin Chemical Fiber Co., Ltd., 2006-2010
Operating Income of Jilin Chemical Fiber Co., Ltd. by Product, 2010
Operating Income and Profit of Jiangsu Xiake Color Spinning Co., Ltd., 2006-2010
Operating Income Structure of Jiangsu Xiake Color Spinning Co., Ltd., 2006-2010
Operation of Major Subsidiaries of Jiangsu Xiake Color Spinning Co., Ltd., 2010
Operating Income and Profit of Shanghai Challenge Textile Co., Ltd., 2007-2010
Revenue from Fabrics of Shanghai Challenge Textile Co., Ltd., 2007-2010
如果这份报告不能满足您的要求,我们还可以为您定制报告,请 留言说明您的详细需求。
|