|
|
|
报告导航:研究报告—
制造业—能源矿产
|
|
2010-2011年中国碳化硅行业研究报告 |
 |
字数:1.5万 |
页数:51 |
图表数:46 |
|
中文电子版:5000元 |
中文纸版:2500元 |
中文(电子+纸)版:5500元 |
|
英文电子版:1200美元 |
英文纸版:1300美元 |
英文(电子+纸)版:1500美元 |
|
编号:DYY019
|
发布日期:2011-05 |
附件:下载 |
 |
|
|
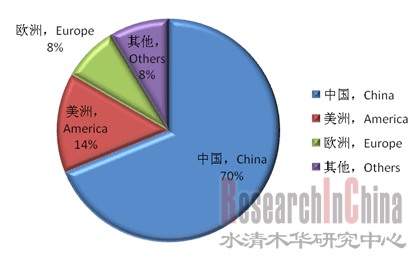
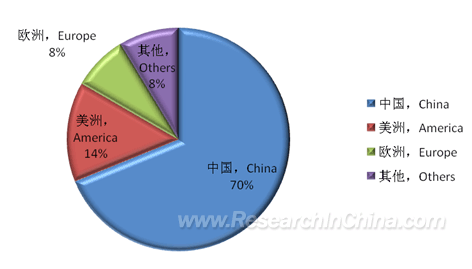
中国是碳化硅的生产和出口大国。受光伏、LED、陶瓷等下游行业需求影响,中国碳化硅产量2010年大幅增加,达105万吨左右,同比增长 96.3%,约占全球总量的70%。2011年,商务部公布的碳化硅第一次出口配额为12.96万吨,与2010年持平。2011年1-3月,中国碳化硅实际出口量为5.36万吨,占2011年第一次出口配额的41.6%。 图:2010年世界碳化硅产量区域分布  整理:水清木华研究中心 由于应用不同,2010年各种碳化硅产品产销情况表现各异。绿碳化硅受光伏产业、精细陶瓷、高级抛光等行业快速发展带动,其产销情况明显好于黑碳化硅。2010年上半年,中国绿碳化硅销售收入同比增长88.8%,而黑碳化硅销售收入同比增长44.7%。 同时,以经营光伏刃料用绿碳化硅为主的新大新材和易成新材料,产销明显好于其他碳化硅厂商。新大新材是太阳能光伏行业重要的功能性材料供应商,在晶硅片切割刃料市场占有率达26%左右。2010年该公司实现营业收入12.1亿元,同比增长121.0%。近年来新大新材产能不断增加,2011年底的切割刃料产能将达到10万吨左右。 易成新材料是中国最大的光伏硅刃料生产企业,2010年该公司实现销售收入41亿元,同比增长46%。2011年5月,易成新材料一期10万吨晶体硅线切割精细微粉项目已建成开工。项目全部建成后,可年产晶体硅线切割精细微粉20万吨。 兰州河桥虽然位居2010年中国碳化硅产能第一,但由于该公司以初加工产品销售为主,近三年公司主营收入欠佳,且呈现一定下降趋势。因此在未来几年,兰州河桥公司将发展重点转移到开发碳化硅深加工产品。 本报告除了着重分析中国碳化硅运行环境、发展现状、市场供需、竞争格局、进出口、价格走势以及发展趋势外,还重点分析了无烟煤、石油焦等碳化硅上游市场供需和价格走势、碳化硅下游行业的发展现状,以及国内碳化硅重点企业的经营状况和发展前景。
China is the large producer and exporter of silicon carbide. Fueled by
the demand from such downstream sectors as PV, LED, and ceramics,
China’s silicon carbide output substantially increased in 2010 to 1.05
million tons or so, up 96.3% YoY, approximating 70% of the global total.
In 2011, the first export quota of silicon carbide released by the
Ministry of Commerce People’s Republic of China turned out to be 129.6
kilotons, equivalent to that in 2010. In Q1 2011, the real export volume
of silicon carbide in China reached 53.6 kilotons, occupying 41.6% of
the first export quota in 2011. Silicon Carbide Output by Region Worldwide, 2010  Source: ResearchInChina The
output and sales of silicon carbides in 2010 varied with different
applications. Pulled by the rapidly developed industries like PV, fine
ceramics, and high-grade polishing, the output and sales of green
silicon carbide was evidently superior to that of black silicon carbide.
In H1 2010, the revenue of green silicon carbide in China presented an
88.8% YoY rise, while that of black silicon carbide grew 44.7% YoY. Meanwhile,
Henan Xindaxin Materials and Yicheng New Material that give priority to
green silicon carbide for PV-based powder boasted obviously larger
output and sales than other silicon carbide manufacturers. Henan
Xindaxin Materials, the vital supplier of functional materials in solar
PV industry, enjoyed approximately 26% shares in wafer cutting material
market. It acquired the operating income of RMB1.21 billion in 2010, up
121.0% from a year earlier. The capacity of Henan Xindaxin Materials has
been on the rise in recent years, and the cutting material capacity
will hit 100 kilotons or so at the end of 2011. As the largest
manufacturer of PV-based silicon powder in China, Yicheng New Material
obtained the revenue of RMB4.1 billion in 2010, up 46% YoY. In May 2011,
the Phase I project of 100-kiloton crystalline silicon linear cutting
fine powder was accomplished; after the completion of the project, the
annual output of crystalline silicon linear cutting fine powder can be
200 kilotons. Lanzhou Heqiao Resource attaches importance to the
sales of primary processing products, and it has made poor and
declining performance in operating income during the recent three years,
in spite of the No.1 capacity of silicon carbide in China in 2010. In
consequence, Lanzhou Heqiao Resource will emphasize the development of
silicon carbide deep-processing products in the following several years.
Apart from the focus on the operation environment, current
development, supply & demand, competition pattern, import &
export, price trend, and development trend of China silicon carbide
industry, this report also highlights the analysis on the supply &
demand and price trend of silicon carbide upstream markets such as
anthracite, petroleum coke, etc., current development of silicon carbide
downstream sector, as well as the operation and development outlook of
key Chinese enterprises.
第一章 碳化硅行业概述
1.1 碳化硅定义及分类
1.2 碳化硅性质及应用
1.3 市场基本特点
第二章 碳化硅行业运行环境分析
2.1 国际环境
2.2 国内环境
2.2.1 宏观环境
2.2.2 政策及市场环境
第三章 碳化硅行业发展概况
3.1 发展现状
3.2 市场供需
3.2.1 供需总量
3.2.2 市场供给
3.2.3 市场需求
3.3 竞争格局
3.4 进出口分析
3.4.1 出口配额情况
3.4.2 进出口情况
3.5 价格走势
3.6 发展前景
第四章 碳化硅上下游行业发展概况
4.1 碳化硅上游行业
4.1.1 石英砂
4.1.2 无烟煤
4.1.3 石油焦
4.2 碳化硅下游行业
4.2.1磨料行业
4.2.2 耐火材料行业
4.2.3 钢铁行业
4.2.4 陶瓷行业
4.2.5 电子行业
第五章 重点企业介绍
5.1 河南新大新材
5.1.1 公司简介
5.1.2 经营状况
5.1.3 发展前景及优势
5.2 易成新材料
5.2.1 公司简介
5.2.2 经营状况
5.2.3 发展前景及优势
5.3 丹江口弘源
5.3.1 公司简介
5.3.2 经营状况
5.3.3 发展优势
5.4宁夏金旌
5.4.1 公司简介
5.4.2 经营状况
5.5白山能源
5.5.1 公司简介
5.5.2 经营状况
5.6伊能高科
5.6.1 公司简介
5.6.2 经营状况
5.7 兰州河桥
5.7.1 公司简介
5.7.2 经营状况
5.7.3 发展前景
5.8 青海贵强
5.9 通化宏信
5.9.1 公司简介
5.9.2 经营状况
5.10 临沭正宇
5.10.1 公司简介
5.10.2 经营状况
5.10.3 发展优势
5.11 天科合达
5.11.1 公司简介
5.11.2 公司经营状况及前景
1. Overview of Silicon Carbide Industry
1.1 Definition and Classification
1.2 Properties and Applications
1.3 Market Characteristics
2. Operation Environment of Silicon Carbide Industry
2.1 International Environment
2.2 Domestic Environment
2.2.1 Macro-Environment
2.2.2 Policy and Market Environment
3. Development of Silicon Carbide Industry
3.1 Status Quo
3.2 Supply & Demand
3.2.1 Total Supply & Demand
3.2.2 Supply
3.2.3 Demand
3.3 Competition Pattern
3.4 Export & Import
3.4.1 Export Quota
3.4.2 Export & Import
3.5 Price Trend
3.6 Development Outlook
4. Development of Silicon Carbide Upstream & Downstream Sectors
4.1 Upstream Sectors
4.1.1 Silica Sand
4.1.2 Anthracite
4.1.3 Petroleum Coke
4.2 Downstream Sectors
4.2.1 Abrasive Materials
4.2.2 Refractory Materials
4.2.3 Iron & Steel
4.2.4 Ceramics
4.2.5 Electronics
5. Key Companies
5.1 Henan Xindaxin Materials
5.1.1 Profile
5.1.2 Operation
5.1.3 Development Outlook & Advantage
5.2 Yicheng New Material
5.2.1 Profile
5.2.2 Operation
5.2.3 Development Outlook & Advantage
5.3 Danjiangkou Hongyuan Silicon Carbide
5.3.1 Profile
5.3.2 Operation
5.3.3 Development Advantage
5.4 Ningxia Jinjing Metallurgicals and Minerals Industrial
5.4.1 Profile
5.4.2 Operation
5.5 Baishan City Power Carborundum
5.5.1 Profile
5.5.2 Operation
5.6 Yili Yineng Quality Silicone Carbon
5.6.1 Profile
5.6.2 Operation
5.7 Lanzhou Heqiao Resource
5.7.1 Profile
5.7.2 Operation
5.7.3 Development Outlook
5.8 Qinghai Guiqiang Abrasive
5.9 Tonghua Hongxin Abrasive
5.9.1 Profile
5.9.2 Operation
5.10 Linshu Zhengyu Silicon Carbide Factory
5.10.1 Profile
5.10.2 Operation
5.10.3 Development Advantage
5.11 Tankeblue Semiconductor
5.11.1 Profile
5.11.2 Operation & Outlook
图:2010年世界碳化硅产量区域分布
表:2010年世界碳化硅主要生产商及产能
图:2007-2011E年世界碳化硅下游需求比例变化
图:2006-2010年GDP及其增长率
图:黑碳化硅和绿碳化硅耗电情况
图:2007-2010年上半年中国碳化硅产需量及变化
图:2010年中国碳化硅产能区域分布
图:2010年中国碳化硅主要生产商市场份额占比(按产能计)
表:2011年5月中国主要地区碳化硅价格行情
图:2007-2011各年度碳化硅出口第一次配额情况
表:2011年碳化硅第一次出口中标前10名单
表:2007-2011年3月中国碳化硅进出口数量情况
表:2007-2011年3月中国碳化硅进出口金额情况
图:2007-2011年3月中国碳化硅进出口平均价格情况
表:2010年中国碳化硅主要出口国家和地区情况
表:2011年1-3月中国碳化硅主要出口国家和地区情况
图:2010年中国碳化硅进口来源及份额
图:2010.10-2011.05中国碳化硅市场价格
图:2009-2011年3月中国碳化硅出口月平均价格
图:中国石英砂储量分布
图:2008-2010年中国无烟煤产量区域分布
图:2008-2011年第一季度中国无烟煤产量统计
图:2010.5-2011.4中国无烟煤市场价格
图:2009-2011年1-4月中国石油焦产量统计
图:2010年中国石油焦供给区域分布
图:2010年石油焦下游需求结构
图:2010-2011.3中国石油焦与国际原油价格走势对比
图:2005-2010年中国太阳能电池产量
图:2005-2010年中国太阳能光伏产品出口金额情况
图:2003-2011年2月中国耐火材料产量及增长情况
表:2006-2010年中国主要耐材产品产量及镁质砖产品占比
图:2007-2011年4月中国粗钢、钢材产量统计
图:2007-2010年中国陶瓷砖产量
图:2010年中国LED产业区域分布
图:2008-2011年中国LED行业销售产值及预测
图:2007-2010年河南新大新材主营收入及净利润变化
表:2008-2009年新大新材分业务毛利率及综合毛利率
图:2007-2010年河南新大新材晶硅片切割刃料对主营收入的贡献情况
图:2008-2010 易成新材料销售收入情况
表:2008-2009年丹江口弘源主要财务指标
图:2007-2009年宁夏金旌主营收入及利润
表:2007-2009年白山能源主要财务指标
表:2008-2009年伊能高科主要财务数据
图:2007-2009年兰州河桥主营收入及利润
图:2007-2009年通化宏信主营收入及利润
图:2007-2008年临沭正宇主营收入及利润
Silicon Carbide Output by Region Worldwide, 2010
Silicon Carbide Manufacturers Worldwide and Their Capacities, 2010
Proportions of Downstream Demand for Silicon Carbide Worldwide, 2007-2011E
Chinese GDP and Growth Rate, 2006-2010
Power Consumption of Black Silicon Carbide and Green Silicon Carbide
Silicon Carbide Output and Demand of China, 2007-2010H1
Silicon Carbide Capacity in China by Region, 2010
Market Shares of Chinese Silicon Carbide Manufacturers (by Capacity), 2010
Price of Silicon Carbide in China by Region, May 2011
First-Time Quotas for Silicon Carbide Export, 2007-2011
Top 10 Bidding Winners of First-time Export Quota for Silicon Carbide, 2011
Import & Export Volume of Silicon Carbide in China, 2007-2011Q1
Import & Export Value of Silicon Carbide in China, 2007-2011Q1
Average Import & Export Price of Silicon Carbide in China, 2007-2011Q1
Major Export Destinations of Silicon Carbide in China, 2010
Major Export Destinations of Silicon Carbide in China, Jan.-Mar.2011
China Silicon Carbide Import Origins and Shares, 2010
Market Price of Silicon Carbide in China, Oct. 2010-May 2011
Monthly Average Export Price of Chinese Silicon Carbide, 2009-Mar. 2011
Distribution of Silica Sand Reserves in China
Anthracite Output in China by Region, 2008-2010
Anthracite Output in China, 2008-2011Q1
Market Price of Anthracite in China, May 2010-Apr. 2011
Petroleum Coke Output in China, 2009-Apr. 2011
Petroleum Coke Supply in China by Region, 2010
Structure of Downstream Demand for Petroleum Coke, 2010
Price Trend of Petroleum Coke in China and International Crude Oil, 2010-Mar. 2011
Solar Cell Output in China, 2005-2010
Export Value of Solar PV Products in China, 2005-2010
Output and Growth of Refractory Material in China, 2003-Feb. 2011
Output of Refractory Products in China and Proportion of Magnesite Brick, 2006-2010
Crude Steel and Steel Output of China, 2007-Apr.2011
Ceramic Tile Output of China, 2007-2010
China LED Industry Layout by Region, 2010
Total Industrial Sales of LED Industry in China, 2008-2011
Operating Income and Net Income of Henan Xindaxin Materials, 2007-2010
Gross Margin and Integrated Gross Margin of Henan Xindaxin Materials by Sector, 2008-2009
Contribution of Henan Xindaxin Materials’ Wafer Cutting Materials to Its Operating Income, 2007-2010
Revenue of Yicheng New Material, 2008-2010
Financial Indices of Danjiangkou Hongyuan Silicon Carbide, 2008-2009
Operating Income and Profit of Ningxia Jinjing Metallurgicals and Minerals Industrial, 2007-2009
Financial Indices of Baishan City Power Carborundum, 2007-2009
Financial Data of Yili Yineng Quality Silicone Carbon, 2008-2009
Operating Income and Profit of Lanzhou Heqiao Resource, 2007-2009
Operating Income and Profit of Tonghua Hongxin Abrasive, 2007-2009
如果这份报告不能满足您的要求,我们还可以为您定制报告,请 留言说明您的详细需求。
|