|
|
|
报告导航:研究报告—
金融与服务业—交通物流
|
|
2011年中国港口行业研究报告 |
 |
字数:2.9万 |
页数:92 |
图表数:113 |
|
中文电子版:7500元 |
中文纸版:3750元 |
中文(电子+纸)版:8000元 |
|
英文电子版:1900美元 |
英文纸版:2000美元 |
英文(电子+纸)版:2200美元 |
|
编号:ZJF025
|
发布日期:2011-07 |
附件:下载 |
 |
|
|
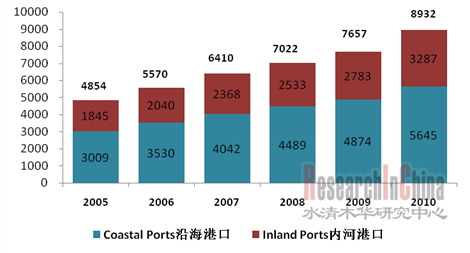
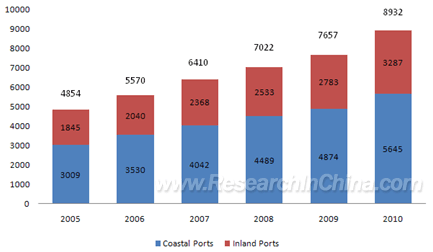
受益于全球经济的复苏,中国港口行业经历2009年的低迷后迎来2010年的增长。2010年全国港口完成货物吞吐量89.32亿吨,同比增长16.7%;完成集装箱吞吐量 1.46亿TEU,同比增长19.4%。
图:2005-2010年全国港口货物吞吐量(单位:百万吨)  数据来源:交通运输部; 整理:水清木华研究中心
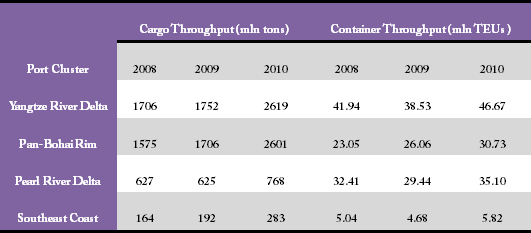
中国沿海港口可以划分为环渤海、长江三角洲、东南沿海、珠江三角洲和西南沿海5 个港口群。
表:2008-2010年中国主要沿海港口群吞吐量
来源:交通运输部;整理:水清木华研究中心
注:货物吞吐量统计的港口为2008年货物吞吐量达到6000万吨的沿海港口和5000万吨的内河港口;集装箱吞吐量统计的为2008年集装箱吞吐量达到200万TEU的港口。
长三角港口群——依托上海国际航运中心,以上海、宁波-舟山、连云港港为主,服务于长江三角洲以及长江沿线地区的经济社会发展。上海港2010年上海港的集装箱吞吐量为2907万TEU,居世界第一;货物吞吐量为5.63亿吨,全国排名第二。宁波-舟山港目前已建成各类泊位723个,吞吐能力超过2亿吨。 珠三角港口群——以广州、深圳、珠海、汕头港为主,服务于华南、西南部分地区。深圳港业务以集装箱为主,2010年全年其完成集装箱吞吐量2251万 TEU,排名全国第二,世界第四。广州港2010年全年其完成货物吞吐量为4.11亿吨,集装箱吞吐量为1255万TEU,均排名全国第四。 环渤海地区港口群——由辽宁、津冀和山东沿海港口群组成,以大连、营口、秦皇岛、天津、烟台、青岛、日照为主要港口。青岛港主要从事集装箱、原油、铁矿石、煤炭等各类进出口货物的装卸等服务。2010年全年货物吞吐量和集装箱吞吐量均排全国第五。天津港共拥有各类泊位140余个,生产用泊位78个。 2010年其实现货物吞吐量为4.13亿吨,集装箱吞吐量1009万TEU。大连港是中国东北最重要的集装箱港口。2010年全年其实现货物吞吐量为 3.14亿吨,排名全国第六。
Benefiting from the global economic recovery, the port industry of China witnessed robust growth in 2010 after experiencing the downturn in 2009. In 2010, cargo throughput of the ports in China accomplished 8.93 billion tons, up 16.7% YoY; the container throughput reached 146 million TEUs, a 19.4% YoY rise.
Cargo Throughput of All Ports in China, 2005-2010 (Unit: mln tons)  Source: Ministry of Transport of PRC; ResearchInChina Coastal ports in China can be divided into 5 port clusters, including pan-Bohai Rim, Yangtze River Delta, Southeast coast, Pearl River Delta and Southwest coast.
Throughput of Key Coastal Port Clusters in China, 2008-2010 Source: Ministry of Transport of PRC, ResearchInChina Note: For cargo throughput statistics, ports included coastal ports whose cargo throughput reached 60 million tons and inland ports whose throughput arrived at 50 million tons in 2008; for container throughput statistics, ports included the ports whose container throughput registered 2 million TEUs in 2008. Port Cluster in Yangtze River Delta-Relying on the Shanghai International Shipping Center and focusing on Shanghai port, Ningbo-Zhoushan port and Lianyungang port, the ports in this region are primarily serviced for the economic and social development of Yangtze River Delta and areas along the Yangtze River. In 2010, container throughput of Shanghai port registered at 29.07 million TEUs and ranked top 1 worldwide; its cargo throughput reached 563 million tons and ranked 2nd nationwide. As for Ningbo-Zhoushan port, it has built 723 berths of all kinds, with the throughput capacity over 200 million tons. Port Cluster in Pearl River Delta- Mainly consisting of Guangzhou port, Shenzhen port, Zhuhai port and Shantou port, the ports in this region are served for South China and part of Southwestern areas. As for Shenzhen port, which is basically a container port, accomplished a container throughput of 22.51 million TEUs in 2010 and ranked 2nd nationwide and 4th worldwide. Guangzhou port achieved cargo throughput of 411 million tons and container throughput of 12.55 million TEUs, both ranking fourth nationwide. Port Cluster in Pan-Bohai Rim- Including Liaoning, Tianjin-Hebei, and Shandong coastal port groups, the ports in pan-Bohai Rim mainly cover Dalian port, Yingkou port, Qihuangdao port, Tianjin port, Yantai port, Qingdao port and Rizhao port. Qingdao port mainly engages in loading and unloading import & export goods including containers, crude oil, iron ore and coal etc. In 2010, cargo throughput and container throughput of Qingdao port both ranked 5th in China. Tianjin port owns 140 berths of all sorts, among which 78 are production berths. In 2010, cargo throughput and container throughput of Tianjin port reached 413 million tons and 10.09 million TEUs respectively. Dalian port, the most important port in Northeast China, realized the cargo throughput of 314 million tons in 2010 and ranked 6th nationwide.
第一章 中国港口行业现状
1.1 中国港口基础设施建设
1.1.1 港口码头建设
1.1.2 运力结构
1.1.3 水运建设投资
1.2 2010-2011年中国港口行业整体运行
1.2.1 货物吞吐量
1.2.2 集装箱吞吐量
第二章 中国港口群建设
2.1 长三角地区港口群
2.1.1 上海港
2.1.2 宁波-舟山港
2.1.3 苏州港
2.1.4南京港
2.1.5南通港
2.1.6 长三角港口群竞争格局
2.2 珠三角区域港口群
2.2.1 深圳港
2.2.2 广州港
2.2.3 香港港
2.2.4珠三角区域港口群竞争格局
2.3 环渤海湾港口群
2.3.1青岛港
2.3.2 天津港
2.3.3 大连港
2.3.4环渤海港口群竞争格局
2.4 东南沿海港口群体
2.4.1 厦门港
2.4.2 福州港
2.4.3东南沿海港口群竞争格局
2.5 西南沿海港口群
2.5.1 湛江港
2.5.2 北部湾港
2.5.3西南沿海港口群竞争格局
第三章 中国沿海港口重点企业
3.1 上港集团
3.1.1 公司简介
3.1.2 公司财务运营
3.1.3 公司生产运营
3.2 盐田港股份
3.2.1 公司简介
3.2.2 公司财务运营
3.2.3 公司生产运营
3.3 天津港股份
3.3.1 公司简介
3.3.2 公司财务运营
3.3.3 公司生产运营
3.4 天津港发展控股公司
3.4.1 公司简介
3.4.2 公司财务运营
3.4.3 公司生产运营
3.5 大连港股份
3.5.1 公司简介
3.5.2 公司财务运营
3.5.3 公司生产运营
3.6 厦门港务
3.6.1 公司简介
3.6.2 公司运营
3.7 营口股份有限公司
3.7.1 公司简介
3.7.2 公司运营
3.8 锦州港股份Jinzhou Port Co., Ltd.
3.8.1 公司简介
3.8.2 公司账务运营
3.9 日照港Rizhao Port Co., Ltd.
3.9.1 公司简介
3.9.2 公司运营
3.10 深赤湾Shenzhen Chiwan Wharf Holdings Ltd.(CWH)
3.10.1 公司简介
3.10.2 公司生产运营
3.10.3 公司财务运营
3.11 北海港Beihai Port Co., Ltd.
3.11.1 公司简介
3.11.2 公司运营
3.12 连云港Jiangsu Lianyungang Port Co., Ltd.
3.12.1 公司简介
3.12.2 公司运营
3.13 中远太平洋COSCO Pacific Ltd.
3.13.1 公司简介
3.13.2 公司运营
3.14 招商局国际China Merchants Holdings (International) Co., Ltd. (CMHI)
3.14.1 公司简介
3.14.2 公司生产运营
3.14.3 公司财务运营
3.15和记黄埔港口Hutchison Port Holdings (HPH)
3.15.1 公司简介
3.15.2 公司运营
第四章 中国内河港口重点企业
4.1 重庆港九Chongqing Gangjiu Co., Ltd. (GSCL)
4.1.1 公司简介
4.1.2 公司运营
4.2 南京港Nanjing Port Co., Ltd.
4.2.1 公司简介
4.2.2 公司运营
4.3 芜湖港Wuhu Port Storage& Transportation Co., Ltd
4.3.1 公司简介
4.3.2 公司运营
第五章 2011-2015年中国港口行业发展展望
5.1 港口行业影响因素分析
5.2 2011-2015年港口货物吞吐量预测
5.3 2011-2015年港口集装箱吞吐量预测
版权声明
免责声明
1. Status Quo of China's Port Industry
1.1 Infrastructure
1.1.1 Wharf Construction
1.1.2 Structure of Transport Capacity
1.1.3 Investment of Water Transport Construction
1.2 Performance in 2010-2011
1.2.1 Cargo Throughput
1.2.2 Container Throughput
2. Port Group Construction in China
2.1 Yangtze River Delta
2.1.1 Shanghai Port
2.1.2 Ningbo-Zhoushan Port
2.1.3 Suzhou Port
2.1.4 Nanjing Port
2.1.5 Nantong Port
2.1.6 Competition Pattern
2.2 Pearl River Delta
2.2.1 Shenzhen Port
2.2.2 Guangzhou Port
2.2.3 Hong Kong Port
2.2.4 Competition Pattern
2.3 Circum-Bohai-Sea Region
2.3.1 Qingdao Port
2.3.2 Tianjin Port
2.3.3 Dalian Port
2.3.4 Competition Pattern
2.4 Southeast Coast Region
2.4.1 Xiamen Port
2.4.2 Fuzhou Port
2.4.3 Competition Pattern
2.5 Southwest Coast Region
2.5.1 Zhanjiang Port
2.5.2 North Bay Port
2.5.3 Competition Pattern
3. Key Coastal Port Enterprises in China
3.1 Shanghai International Port (Group) Co., Ltd. (SIPG)
3.1.1 Profile
3.1.2 Financial Operation
3.1.3 Production
3.2 Shenzhen Yantian Port Holdings Co., Ltd.
3.2.1 Profile
3.2.2 Financial Operation
3.2.3 Production
3.3 Tianjin Port Holdings Co., Ltd.
3.3.1 Profile
3.3.2 Financial Operation
3.3.3 Production
3.4 Tianjin Port Development Holdings Ltd.
3.4.1 Profile
3.4.2 Financial Operation
3.4.3 Production
3.5 Dalian Port (PDA) Co., Ltd.
3.5.1 Profile
3.5.2 Financial Operation
3.5.3 Production
3.6 Xiamen Port Development Co., Ltd.
3.6.1 Profile
3.6.2 Operation
3.7 Yingkou Port Liability Co., Ltd.
3.7.1 Profile
3.7.2 Operation
3.8 Jinzhou Port Co., Ltd.
3.8.1 Profile
3.8.2 Financial Operation
3.9 Rizhao Port Co., Ltd.
3.9.1 Profile
3.9.2 Operation
3.10 Shenzhen Chiwan Wharf Holdings Ltd. (CWH)
3.10.1 Profile
3.10.2 Production
3.10.3 Financial Operation
3.11 Beihai Port Co., Ltd.
3.11.1 Profile
3.11.2 Operation
3.12 Jiangsu Lianyungang Port Co., Ltd.
3.12.1 Profile
3.12.2 Operation
3.13 COSCO Pacific Ltd.
3.13.1 Profile
3.13.2 Operation
3.14 China Merchants Holdings (International) Co., Ltd. (CMHI)
3.14.1 Profile
3.14.2 Production
3.14.3 Financial Operation
3.15 Hutchison Port Holdings (HPH)
3.15.1 Profile
3.15.2 Operation
4. Key Inland Port Enterprises in China
4.1 Chongqing Gangjiu Co., Ltd. (GSCL)
4.1.1 Profile
4.1.2 Operation
4.2 Nanjing Port Co., Ltd.
4.2.1 Profile
4.2.2 Operation
4.3 Wuhu Port Storage & Transportation Co., Ltd
4.3.1 Profile
4.3.2 Operation
5. Development Outlook, 2011-2015
5.1 Influential Factors
5.2 Forecast of Cargo Throughput
5.3 Forecast of Container Throughput
表: 2010中国港口生产用码头泊位(单位:个)
表:2010年全国港口万吨级及以上泊位(单位:个)
表:2010年水上运输船舶构成情况(按航行区域分)
图:2006-2010年中国水运建设投资额(单位:百万元)
图:2005-2010年全国港口货物吞吐量情况(单位:百万吨)
图:2011.01-2011.05规模以上港口货物吞吐量(单位:百万吨)
图:2005-2010全国港口外贸货物吞吐量情况(单位:百万吨)
表:2010年中国主要港口货物吞吐量(单位:百万吨)
图:2010年中国港口(分货种)吞吐量情况(单位:百万吨)
图:2005-2010年全国港口集装箱吞吐量情况(单位:百万TEU)
图:2011.01-2011.05中国主要港口集装箱吞吐量(单位:百万TEU)
表:2010年中国主要港口集装箱吞吐量(单位:1000 TEU)
表:《全国沿海港口布局规划》港口群划分
表:2008-2010年我国主要港口群吞吐量情况
图:2005-2011年上海港港口货物吞吐量及增速(单位:百万吨)
图:2005-2011年上海港港口集装箱吞吐量及增速(单位:百万TEU)
图:2006-2011年宁波-舟山港港口货物吞吐量及增速(单位:百万吨)
图:2006-2011年宁波-舟山港港口集装箱吞吐量及增速(单位:百万TEU)
图:2005-2011年苏州港港口货物吞吐量及增速(单位:百万吨)
图:2005-2011年苏州港港口集装箱吞吐量及增速(单位:百万TEU)
图:2006-2011年南京港港口货物吞吐量及增速(单位:百万吨)
图:2006-2011年南通港港口货物吞吐量及增速(单位:百万吨)
图:2010年长三角地区主要港口货物吞吐量占比情况
图:2010年长三角地区主要港口集装箱吞吐量占比情况
图:2005-2011年深圳港港口货物吞吐量及增速(单位:百万吨)
图:2005-2011年深圳港港口集装箱吞吐量及增速(单位:百万TEU)
图:2005-2011年广州港港口货物吞吐量及增速(单位:百万吨)
图:2005-2011广州港港口集装箱吞吐量及增速(单位:百万 TEU)
图:2006-2011香港港港口集装箱吞吐量及增速(单位:百万TEU)
表:香港、深圳、广州三港竞争力比较
图:2006-2010年深港穗集装箱吞吐量市场占有率情况
图:2005-2011年青岛港港口货物吞吐量及增速(单位:百万吨)
图:2005-2011年青岛港港口集装箱吞吐量及增速(单位:1000 TEU)
图:2005-2011年天津港港口货物吞吐量及增速(单位:百万吨)
图:2005-2011年天津港港口集装箱吞吐量及增速(单位:百万TEU)
图:2005-2011年大连港港口货物吞吐量及增速(单位:百万吨)
图:2005-2011年大连港港口集装箱吞吐量及增速(单位:1000 TEU)
图:2010年环渤海主要港口货物吞吐量占比情况
图:2005-2011年厦门港货物吞吐量及增速(单位:百万吨)
图:2005-2011年厦门港集装箱吞吐量及增速(单位:百万TEU)
图:2006-2011年福州港货物吞吐量及增速(单位:百万吨)
图:2008-2010年东南沿海三大港货物吞吐量对比情况(单位:百万吨)
图:2006-2011年湛江港货物吞吐量及增速(单位:百万吨)
图:2006-2010年湛江港集装箱吞吐量及增速(单位:1000 TEU)
图:2006-2011年北部湾港货物吞吐量及增速(单位:百万吨)
图:2007-2011年上港集团营业收入情况(单位:十亿元)
图:2009年和2010年上港集团(分业务)营业收入构成(单位:十亿元)
图:2005-2011上港集团母港(上海港)集装箱吞吐量及同比增速(单位:百万TEU)
图:2005-2011年上港国际母港(上海港)货物吞吐量及同比增速(单位:百万吨)
图:2007-2011Q1盐田港营业收入及同比增速(单位:百万元)
图:2009年和2010年盐田港(分业务)营业收入构成(单位:百万元)
图:2005H1-2010H2盐田国际港集装箱吞吐量及增速(单位:1,000TEU)
图:2005H1-2010H2盐田港西港区码头集装箱吞吐量及增速(单位:1,000TEU)
图:2006-2011年天津港股份营业收入(单位:百万元)
图:2009Q1-2011Q1天津港股份净利润及其同比增速(单位:百万元)
图:2006H1-2010H2天津港股份集装箱吞吐量及增速(单位:百万TEU)
图:2006H1-2010H2天津港股份散杂货吞吐量及同比增速(单位:百万吨)
图:2009年和2010年天津港股份(分业务)主营业务收入构成(单位:百万元)
图:2006-2010年天津港发展营业额净利润(单位:百万港元)
图:2009年和2010年天津港发展(分业务)营业收入构成(单位:十亿港元)
图:2006-2010年天津港发展集装箱及散杂货吞吐量统计
图:2006-2010大连港股份营业额、净利润(单位:十亿元)
图:2010年大连港(分业务)营业收入构成(单位:百万元)
图:2006-2010年大连港股份原油吞吐量及增速(单位:百万吨)
图:2006-2010大连港内、外贸集装箱吞吐量(单位:1,000TEU)
图:2006-2010年大连港汽车吞吐量及增速(单位:1,000辆)
图:2006-2010厦门港务营业收入及同比增速(单位:百万元)
图:2006-2010厦门港务净利润及同比增速(单位:百万元)
图: 2010年厦门港务(分业务)营业收入构成(单位:百万元)
图:2007-2011Q1营口港股份营业收入及同比增速(单位:十亿元)
图:2008-2011Q1营口港股份净利润及净利润率(单位:百万元)
图:2006-2010年营口港股份集装箱吞吐量及其增速年度变化(单位:1000 TEU)
表:2008-2010年营口港股份散杂货吞吐量及同比增速(单位:百万吨)
图:2007-2011Q1锦州港营业收入及增速(单位:百万元)
图:2007-2011Q1锦州港股份净利润及净利润率(单位:百万元)
图:2009年和2010年锦州港(分业务)主营业务构成(单位:百万元)
表:2007 2010年锦州港股份吞吐货种构成
图:2007-2011Q1日照港营业收入及增速(单位:百万元)
图:2007-2011Q1日照港净利润及净利润率(单位:百万元)
图:2009年和2010年日照港(分业务)主营业务收入构成(单位:百万元)
图:2007-2011Q1年深赤湾集装箱吞吐量(单位:1000 TEU)
图:2007-2011Q1年各月深赤港散杂货吞吐量(单位:百万吨)
图:2007-2011Q1深赤湾营业收入及增速(单位:百万元)
图:2007-2011Q1深赤湾净利润及其增速、净利润率(单位:百万元)
图:2009年和2010年深赤湾(分业务)主营业务收入构成(单位:百万元)
图:2007-2011Q1北海港营业收入及增速(单位:百万元)
图:2007-2011Q1北海港净利润及净利润率(单位:百万元)
图:2009-2010北海港(分业务)主营业务构成(单位:百万元)
图:2007-2011Q1连云港营业收入及增速(单位:百万元)
图:2007-2011Q1连云港净利润、净利润率(单位:百万元)
图:2009年和2010年连云港(分业务)主营业务收入构成(单位:百万元)
图:2007-2010年公司货物吞吐量情况(单位:百万吨)
图:2010年连云港港口股份公司货物吞吐量分类(单位:百万吨)
表:2009年和2010年中远太平洋码头业务
表:2009年和2010年中远太平洋集装箱租赁、管理及销售业务
图:2007-2011Q1年中远太平洋营业额及其增速、净利润情况(单位:百万美元)
图:2009年和2010年中远太平洋(分业务)主营业务构成(单位:百万美元)
图:2006-2010年中远太平洋年度集装箱吞吐量及集装箱年处理能力(单位:百万TEU)
表:2004-2010招商局国际(分地区)集装箱吞吐量统计(1,000 TEU)
图:2006-2010招商局国际营业额及其增速、净利润情况(单位:百万港元)
表:2002-2010年和记黄埔集装箱吞吐量及增速统计
图:2006-2011Q1重庆港九营业收入及增速(单位:百万元)
图:2006-2011Q1重庆港九净利润及净利润率(单位:百万元)
图:2009年和2010年重庆港九(分业务)营业收入构成(单位:百万元)
图:2006-2011Q1南京港营业收入及增速(单位:百万元)
图:2006-2011Q1南京港净利润及净利润率(单位:百万元)
图:2009年和2010年南京港(分业务)营业收入构成(单位:百万元)
图:2006-2011Q1芜湖港营业收入及增速(单位:百万元)
图:2006-2011Q1芜湖港净利润及净利润率(单位:百万元)
图:2009年和2010年芜湖港(分业务)营业收入构成(单位:百万元)
图:2011-2015年全国港口货物吞吐量预测(百万吨)
图:2011-2015年全国港口外贸货物吞吐量预测(百万吨)
图:2011-2015年全国港口集装箱吞吐量预测(百万TEU)
Quantity of Production Dedicated Berths in Chinese Ports, 2010
Quantity of Berths of 10K DWT and above in Chinese Ports, 2010
Structure of Water Transport Shipping (by Shipping Region), 2010
Investment of Water Transport Construction in China, 2006-2010
Cargo Throughput of Ports Nationwide, 2005-2010
Cargo Throughput of Large-scale Ports in China, Jan.-May 2011
Foreign-trade Cargo Throughput of Ports Nationwide, 2005-2010
Cargo Throughput of Major Ports in China, 2010
Cargo Throughput of Chinese Ports (by Cargo Type), 2010
Container Throughput of Ports Nationwide, 2005-2010
Container Throughput of Major Ports in China, Jan.-May 2011
Container Throughput of Major Ports in China, 2010
Port Group Division in Planning of National Coastal Port Distribution
Throughput of Major Port Groups in China, 2008-2010
Cargo Throughput and Growth Rate of Shanghai Port, 2005-2011
Container Throughput and Growth Rate of Shanghai Port, 2005-2011
Cargo Throughput and Growth Rate of Ningbo-Zhoushan Port, 2006-2011
Container Throughput and Growth Rate of Ningbo-Zhoushan Port,2006-2011
Cargo Throughput and Growth Rate of Suzhou Port, 2005-2011
Container Throughput and Growth Rate of Suzhou Port, 2005-2011
Cargo Throughput and Growth Rate of Nanjing Port, 2006-2011
Cargo Throughput and Growth Rate of Nantong Port, 2006-2011
Cargo Throughput Proportion of Major Ports in Yangtze River Delta, 2010
Container Throughput Proportion of Major Ports in Yangtze River Delta, 2010
Cargo Throughput and Growth Rate of Shenzhen Port, 2005-2011
Container Throughput and Growth Rate of Shenzhen Port, 2005-2011
Cargo Throughput and Growth Rate of Guangzhou Port, 2005-2011
Container Throughput and Growth Rate of Guangzhou Port, 2005-2011
Container Throughput and Growth Rate of Hong Kong Port, 2006-2011
Competitiveness Comparison of Hong Kong, Shenzhen, and Guangzhou Ports
Market Share of Container Throughput of Hong Kong ,Shenzhen, and Guangzhou Ports, 2006-2010
Cargo Throughput and Growth Rate of Qingdao Port, 2005-2011
Container Throughput and Growth Rate of Qingdao Port, 2005-2011
Cargo Throughput and Growth Rate of Tianjin Port, 2005-2011
Container Throughput and Growth Rate of Tianjin Port, 2005-2011
Cargo Throughput and Growth Rate of Dalian Port, 2005-2011
Container Throughput and Growth Rate of Dalian Port, 2005-2011
Cargo Throughput Proportion of Major Ports in Circum-Bohai-Sea Region, 2010
Cargo Throughput and Growth Rate of Xiamen Port, 2005-2011
Container Throughput and Growth Rate of Xiamen Port, 2005-2011
Cargo Throughput and Growth Rate of Fuzhou Port, 2006-2011
Cargo Throughput Comparison of Three Major Ports in Southeast Coast Region, 2008-2010
Cargo Throughput and Growth Rate of Zhanjiang Port, 2006-2011
Container Throughput and Growth Rate of Zhanjiang Port, 2006-2010
Cargo Throughput and Growth Rate of North Bay Port, 2006-2011
Operating Income of SIPG, 2007-2011
Operating Income Structure of SIPG by Sector, 2009 & 2010
Container Throughput and YoY Growth of SIPG’S Homeport (Shanghai Port), 2005-2011
Cargo Throughput and YoY Growth of SIPG’S Homeport (Shanghai Port), 2005-2011
Operating Income and YoY Growth of Shenzhen Yantian Port Holdings Co., Ltd., 2007-2011Q1
Operating Income Structure of Shenzhen Yantian Port Holdings Co., Ltd. by Sector, 2009 & 2010
Container Throughput and Growth Rate of Yantian International Port, 2005H1-2010H2
Container Throughput and Growth Rate of Yantian West Port, 2005H1-2010H2
Operating Income of Tianjin Port Holdings, 2006-2011
Net Income and YoY Growth of Tianjin Port Holdings, 2009Q1-2011Q1
Container Throughput and Growth Rate of Tianjin Port Holdings, 2006H1-2010H2
Bulk Cargo Throughput and YoY Growth of Tianjin Port Holdings, 2006H1-2010H2
Operating Income Structure of Tianjin Port Holdings by Sector, 2009 & 2010
Revenue and Net Income of Tianjin Port Development Holdings, 2006-2010
Operating Income Structure of Tianjin Port Development Holdings by Sector, 2009 & 2010
Container and Bulk Cargo Throughput of Tianjin Port Development Holdings, 2006-2010
Revenue and Net Income of Dalian Port (PDA) Co., Ltd., 2006-2010
Operating Income Structure of Dalian Port (PDA) Co., Ltd. by Sector, 2010
Crude Oil Throughput and Growth Rate of Dalian Port (PDA) Co., Ltd., 2006-2010
Domestic and Foreign-trade Container Throughput of Dalian Port, 2006-2010
Automobile Throughput and Growth Rate of Dalian Port, 2006-2010
Operating Income and YoY Growth of Xiamen Port Development Co., Ltd., 2006-2010
Net Income and YoY Growth of Xiamen Port Development Co., Ltd., 2006-2010
Operating Income Structure of Xiamen Port Development Co., Ltd. by Sector, 2010
Operating Income and YoY Growth of Yingkou Port Liability Co., Ltd., 2007-2011Q1
Net Income and Net Profit Margin of Yingkou Port Liability Co., Ltd., 2008-2011Q1
Container Throughput and Annual Growth Rate of Yingkou Port Liability Co., Ltd., 2006-2010
Bulk Cargo Throughput and YoY Growth of Yingkou Port Liability Co., Ltd., 2008-2010
Operating Income and Growth Rate of Jinzhou Port Co., Ltd., 2007-2011Q1
Net Income and Net Profit Margin of Jinzhou Port Co., Ltd., 2007-2011Q1
Operating Income Structure of Jinzhou Port Co., Ltd. by Sector, 2009 & 2010
Throughput of Jinzhou Port Co., Ltd. by Cargo Type, 2007-2010
Operating Income and Growth Rate of Rizhao Port Co., Ltd., 2007-2011Q1
Net Income and Net Profit Margin of Rizhao Port Co., Ltd., 2007-2011Q1
Operating Income Structure of Rizhao Port Co., Ltd. by Sector, 2009 & 2010
Container Throughput of CWH, 2007-2011Q1
Bulk Cargo Throughput of CWH, 2007-2011Q1
Operating Income and Growth Rate of CWH, 2007-2011Q1
Net Income and Growth Rate and Net Profit Margin of CWH, 2007-2011Q1
Operating Income Structure of CWH by Sector, 2009 & 2010
Operating Income and Growth Rate of Beihai Port Co., Ltd., 2007-2011Q1
Net Income and Net Profit Margin of Beihai Port Co., Ltd., 2007-2011Q1
Operating Income Structure of Beihai Port Co., Ltd. by Sector, 2009-2010
Operating Income and Growth Rate of Jiangsu Lianyungang Port Co., Ltd., 2007-2011Q1
Net Income and Net Profit Margin of Jiangsu Lianyungang Port Co., Ltd., 2007-2011Q1
Operating Income Structure of Jiangsu Lianyungang Port Co., Ltd. by Sector, 2009 & 2010
Cargo Throughput of Jiangsu Lianyungang Port Co., Ltd., 2007-2010
Classification of Cargo Throughput of Jiangsu Lianyungang Port Co., Ltd., 2010
Wharf Business of COSCO Pacific, 2009 & 2010
Container Leasing, Management, and Marketing of COSCO Pacific, 2009 & 2010
Revenue and Growth Rate and Net Income of COSCO Pacific, 2007-2011Q1
Operating Income Structure of COSCO Pacific by Sector, 2009 & 2010
Annual Container Throughput and Processing Capacity of COSCO Pacific, 2006-2010
Container Throughput of CMHI by Region, 2004-2010
Revenue and Growth Rate and Net Income of CMHI, 2006-2010
Container Throughput and Growth Rate of HPH, 2002-2010
Operating Income and Growth Rate of GSCL, 2006-2011Q1
Net Income and Net Profit Margin of GSCL, 2006-2011Q1
Operating Income Structure of GSCL by Sector, 2009 & 2010
Operating Income and Growth Rate of Nanjing Port Co., Ltd., 2006-2011Q1
Net Income and Net Profit Margin of Nanjing Port Co., Ltd., 2006-2011Q1
Operating Income Structure of Nanjing Port Co., Ltd. by Sector, 2009 & 2010
Operating Income and Growth Rate of Wuhu Port Storage & Transportation Co., Ltd, 2006-2011Q1
Net Income and Net Profit Margin of Wuhu Port Storage & Transportation Co., Ltd, 2006-2011Q1
Operating Income Structure of Wuhu Port Storage & Transportation Co., Ltd by Sector, 2009 & 2010
Cargo Throughput of Ports Nationwide, 2011-2015E
Foreign-trade Cargo Throughput of Ports Nationwide, 2011-2015E
Container Throughput of Ports Nationwide, 2011-2015E
如果这份报告不能满足您的要求,我们还可以为您定制报告,请 留言说明您的详细需求。
|