|
|
|
报告导航:研究报告—
生命科学—生物科技
|
|
2010-2011年中国血液制品行业研究报告 |
 |
字数:3.2万 |
页数:85 |
图表数:93 |
|
中文电子版:7500元 |
中文纸版:3750元 |
中文(电子+纸)版:8000元 |
|
英文电子版:2000美元 |
英文纸版:2100美元 |
英文(电子+纸)版:2300美元 |
|
编号:HM005
|
发布日期:2011-09 |
附件:下载 |
 |
|
|
近年中国血液制品行业发展迅猛,目前血液制品生产企业达33家,能生产人血白蛋白、静注人免疫球蛋白、人免疫球蛋白等十余种血液制品。2003-2010年中国血液制品年均复合增长率为20.3%,远高于全球市场同期增速。 受益于经济技术进步、人口增长与老龄化进程加快、血液制品认知度提高等多重因素,中国血液制品市场供需两旺的高景气状态将持续到2015年以后。
图:2003-2015E年中国血液制品市场规模(单位:十亿元) 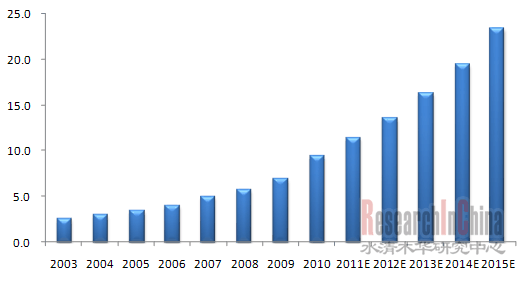 整理:水清木华研究中心 但是受血浆来源的供给所限,中国血液制品一直呈供应不足状态,特别是2011年8月贵州省关闭16家采浆站之后,中国血液制品企业的生产将进一步受制。 虽然在贵州关闭血浆站事件中,华兰生物关闭5家浆站,成为最大的受害者,但其血浆站数量在国内仍位居前列(浆站数量13家),处于血液制品龙头地位;其次是上海莱士和天坛生物。 由于血液制品供不应求,且各大企业的血浆来源紧张,因此进口产品成为缓解中国血液制品供需紧张的主要途径之一,但目前中国仅允许人血白蛋白和重组凝血因子VIII的进口。 受国外人血白蛋白价格较低影响,中国进口人血白蛋白的比重一直处于上升趋势。2010年进口人血白蛋白占比达到48.4%(按批签发量计),同比增长7.2%。其中奥克特珐玛和Behring在进口人血白蛋白中占比最大。 对于重组凝血因子VIII,由于价格昂贵且受国家政策限制(仅限无人血源凝血因子VIII情况下血友病人严重出血时使用),目前只有拜耳产品进口。但鉴于人源凝血因子VIII的匮乏,且凝血因子VIII的需求不断增加,重组凝血因子VIII在中国需求将会进一步提高。
NRecent years have seen fast-growing development of blood product industry in China, with the enterprises concerned numbering 33 which can produce 10-odd blood products including human albumin, human immunoglobulin (pH4) for intravenous injection and human immunoglobulin. In 2003-2010, the CAGR of blood products reached 20.3% in China, far above the global level in the same period. Thanks to many favorable factors such as the advance of economy and technology, the acceleration of population growth and aging process as well as the people’s further recognition of blood products, China’s blood product market has seen buoyant momentum which is expected to maintain until 2015 and beyond.
Blood Product Market Scale in China, 2003-2015E (RMB bn) 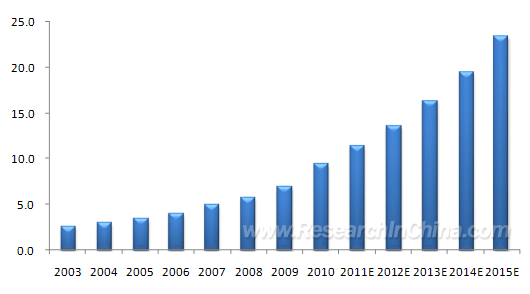 Source: ResearchInChina However, the blood products of China have always seen short supply due to limited blood plasma source. Especially, since August 2011 when 16 plasma collection stations were closed in Guizhou Province, the production of China-based blood product enterprises has been further constrained. Accounting for five of the 16 plasma collection stations closed in Guizhou, Hualan Biological Engineering is the biggest victim of the shutdown, but it still comes out top in terms of the number of blood plasma stations (numbering 13), followed by Shanghai RAAS Blood Products and Beijing Tiantan Biological Products Corporation. The supply shortage of blood products coupled with strained blood plasma source of leading enterprises has propelled China’s import of blood products, but, thus far, only human albumin and recombinant coagulation factor VIII are allowed to import from foreign countries. Affected by the lower price of human albumin in foreign countries, China has long been increasing its import volume, with the proportion in 2010 reaching 48.4% (by lot release volume), up 7.2% year-on-year. In particular, Octapharma and Behring occupied the biggest chunk. As for recombinant coagulation factor VIII, due to high price and policy restriction (it’s only allowed to use when hemophilia patients suffer serious bleeding and human coagulation factor VIII is unavailable), only products made by Bayer are allowed to be imported in China. However, considering the scarcity of human coagulation factor VIII and the increasing demand for coagulation factor VIII, the demand for recombinant coagulation factor VIII will grow further in China.
第一章 血液制品行业概述
1.1血液制品定义
1.2血液制品分类
1.3重组血液制品
1.4血液制品产业链
1.5血液制品特点
第二章 中国血液制品行业总体概述
2.1市场规模
2.2发展现状
2.3 市场供需
2.4 市场竞争
2.5运行环境
2.5.1国际市场
2.5.2政策环境
2.5.3国内生物制药市场
2.6进出口分析
第三章 中国血液制品细分市场分析
3.1人血白蛋白
3.1.1 市场供需
3.1.2 竞争格局
3.1.3 发展前景
3.2静注人免疫球蛋白(静丙)
3.2.1竞争格局
3.3凝血因子
3.3.1 市场供需
3.3.2 竞争格局
3.3.3 发展前景
3.4乙肝免疫球蛋白
3.4.1 市场供需
3.4.2竞争格局
3.5人免疫球蛋白
3.5.1 竞争格局
3.6人凝血酶原复合物
3.6.1竞争格局
3.7破伤风免疫球蛋白
3.7.1竞争格局
3.8狂犬病人免疫球蛋白
3.8.1 竞争格局
第四章 国内主要厂商
4.1华兰生物
4.1.1公司介绍
4.1.2经营状况
4.1.3公司血液制品经营状况
4.2上海莱士
4.2.1公司介绍
4.2.2经营状况
4.2.3公司前景与动态
4.3天坛生物
4.3.1公司介绍
4.3.2经营状况
4.3.3成都蓉生药业有限责任公司
4.4中国生物制药公司China Biologic Products Inc
4.4.1公司介绍
4.4.2经营状况
4.4.3山东泰邦生物
4.4.4西安回天血液制品有限责任公司
4.4.5贵阳黔峰生物制品有限责任公司
4.5江西博雅生物制药有限公司
4.5.1公司介绍
4.5.2经营状况
4.6四川远大蜀阳药业
4.6.1公司介绍
4.6.2经营状况
4.7上海生物制品研究所
4.7.1公司介绍
4.7.2经营状况
4.7.3 发展前景
4.8山西康宝生物制品股份有限公司
4.8.1公司介绍
4.8.2经营状况
4.9绿十字
4.9.1公司介绍
4.9.2经营状况
1. Overview of Blood Product Industry
1.1 Definition of Blood Product
1.2 Classification of Blood Products
1.3 Recombinant Blood Products
1.4 Blood Product Industry Chain
1.5 Features of Blood Products
2. Overview of China Blood Product Industry
2.1 Market Size
2.2 Development Status
2.3 Supply & Demand
2.4 Market Competition
2.5 Operating Environment
2.5.1 International Market
2.5.2 Policies
2.5.3 Domestic Biopharmaceutical Market
2.6 Import & Export
3. Blood Product Market Segments in China
3.1 Human Albumin
3.1.1 Supply & Demand
3.1.2 Competition Pattern
3.1.3 Prospects
3.2 Human Immunoglobulin (pH4) for Intravenous Injection
3.2.1 Competition Pattern
3.3 Coagulation Factor
3.3.1 Supply & Demand
3.3.2 Competition Pattern
3.3.3 Prospects
3.4 Hepatitis B Immunoglobulin
3.4.1 Supply & Demand
3.4.2 Competition Pattern
3.5 Human Immunoglobulin
3.5.1 Competition Pattern
3.6 Human Prothrombin Complex
3.6.1 Competition Pattern
3.7 Tetanus Immunoglobulin
3.7.1 Competition Pattern
3.8 Rabies Immunoglobulin
3.8.1 Competition Pattern
4. Key Manufacturers in China
4.1 Hualan Biological Engineering Ltd
4.1.1 Profile
4.1.2 Operation
4.1.3 Blood Products
4.2 Shanghai RAAS Blood Products Co., Ltd
4.2.1 Profile
4.2.2 Operation
4.2.3 Prospects and Trends
4.3 Beijing Tiantan Biological Products Co., Ltd
4.3.1 Profile
4.3.2 Operation
4.3.3 Chengdu Rongsheng Pharmaceuticals Co., Ltd
4.4 China Biologic Products, Inc
4.4.1 Profile
4.4.2 Operation
4.4.3 Shandong Taibang Biological Products Co. Ltd
4.4.4 Xi’an Huitian Blood Products Co. Ltd
4.4.5 Guiyang Qianfeng Biological Product Liability Co., Ltd.
4.5 Jiangxi Boya Biopharmaceutical Co., Ltd
4.5.1 Profile
4.5.2 Operation
4.6 Sichuan Yuanda Shuyang Pharmaceutical Co., Ltd
4.6.1 Profile
4.6.2 Operation
4.7 CNBG Shanghai Institute of Biological Products
4.7.1 Profile
4.7.2 Operation
4.7.3 Prospects
4.8 Shanxi Kangbao Biological Product Co., Ltd
4.8.1 Profile
4.8.2 Operation
4.9 Green Cross
4.9.1 Profile
4.9.2 Operation
图:血液的基本组成
表:血液制品的分类及作用
表:基因重组类血制品与传统血制品对比
表:国内外重组血液制品产品种类及对比
图:血液制品产业链
图:2003-2015E年中国血液制品市场规模
表:2007-2011.1-7中国血液制品(分产品)批签发量
图:2009-2010年中国血液制品产品结构(按批签发量计)
图:2002-2010年中国年投浆量
图:截止2011年8月中国血浆站资源地域分布
表:中国与发达国家血液制品人均使用量的对比
图:2010年中国血液制品主要厂商市场份额
表:国内血液制品生产企业产品线对比
表:截止2011年8月中国血液制品主要厂商生产情况
图:2003-2010年国际血液制品市场规模
表:国外上市的血液制品
表:目前国外正在进行的新适应症临床试验
表:全球血液制品生产商
图:2010年国际血液制品巨头经营情况
表:中国血液制品主要政策
图:2005-2011H1中国生物生化制药销售收入及同比增长率
表:2010年全球人血白蛋白供需状况
图:2007-2010年中国人血白蛋白国产与进口比例
图:2007-2010年中国国产人血白蛋白主要厂商市场份额
图:2007-2010年中国进口人血白蛋白厂商市场份额
表:2010年中国与美国静丙消耗量比较
图:2007-2010年中国静丙的批签发数量及增长率
图:2007-2010年中国静注人免疫球蛋白主要厂商市场份额
图:2008-2010年中国凝血因子VIII批签发数量及增长率
图:2008-2010年中国人凝血因子VIII厂商市场份额
表:人源性凝血因子VIII与重组凝血因子VIII的比较
图:2008-2010年中国乙肝免疫球蛋白的批签发数量及增长率
图:2008-2010年中国乙肝免疫球蛋白市场主要厂商市场份额
图:2008-2010年中国人免疫球蛋白批签发数量及增长率
图:2008-2010年中国人免疫球蛋白批签发量主要厂商市场份额
图:2008-2010年中国人凝血酶原复合物批签发数量及增长率
图:2008-2010年中国人凝血酶原复合物厂商市场份额
图:2008-2010年中国破伤风免疫球蛋白批签发数量及增长率
图:2008-2010年中国破伤风免疫球蛋白主要厂商市场份额
图:2008-2010年中国狂犬病人免疫球蛋白批签发数量及增长率
图:2008-2010年中国狂犬病人免疫球蛋白主要厂商市场份额
图:2006-2011H1华兰生物营业收入和净利润
图:2007-2010华兰生物(分行业)营业收入
图:2007-2010华兰生物(分产品)毛利率
图:2007-2010年华兰生物(分地区)营业收入
表:截至2011年8月华兰生物采浆站分布
表:2007-2011.7华兰生物血液制品批签发数量
表:2008-2011.7华兰生物血液制品批签发数量占比
图:2007-2010华兰生物血液制品(分产品)营业收入
图:2007-2011H1上海莱士营业收入和净利润
图:2005-2010上海莱士(分产品)营业收入
图:2005-2010年上海莱士(分产品)毛利率
图:2008-2010年上海莱士(分地区)营业收入
表:2007-2011.1-7上海莱士血液制品批签发量
表:2007-2011.1-7上海莱士血液制品批签发量占比
表:截至2011年8月上海莱士采浆站分布
图:2007-2011E年上海莱士投浆量
图:2007-2011Q1天坛生物营业收入和净利润
图:2007-2010年天坛生物(分产品)营业收入
图:2007-2010年天坛生物(分产品)毛利率
图:2007-2010年天坛生物(分地区)营业收入
图:2008-2009年成都蓉生经营情况
表:2007-2011.1-7成都蓉生血液制品批签发量
图:2008-2011.7成都蓉生血液制品批签发数量占比
表:截至2011年8月成都蓉生采浆站分布
图:2007-2011H1中国生物制药公司营业收入和毛利润
图:2007-2010年中国生物制药公司血液制品(分产品)营业收入
图:2008-2009年山东泰邦经营情况
表:2007-2011.1-7山东泰邦血液制品批签发量
图:2008-2009年西安回天经营情况
表:2007-2011.1-7西安回天血液制品批签发量
图:2008-2009年黔峰生物经营情况
表:2007-2011.1-7黔峰生物血液制品批签发量
图:2008-2010年博雅生物营业收入和净利润
图:2008-2010年博雅生物血液制品(分产品)营业收入
图:2008-2010年博雅生物(分产品)毛利率
图:2008-2010年博雅生物血液制品(分产品)价格走势
图:2008-2010年博雅生物各浆站采浆量
表:2007-2011.1-7博雅生物血液制品批签发量
图:2008-2010年博雅生物研发投入及占销售收入比重
表:截止2011年7月博雅生物血液制品研发项目及进展
图:2007-2008年蜀阳药业经营情况
表:2007-2011.1-7蜀阳药业血液制品批签发量
图:2008-2009年上海所经营情况
表:截止2011年7月上海所血液制品产品目录
表:2007-2011.1-7上海所血液制品批签发量
表:截止2011年8月上海所血浆站分布
图:2008-2009年康宝生物经营情况
表:2007-2011.1-7康宝生物血液制品批签发量
图:2008-2011.7康宝生物血液制品批签发数量占比
图:2008-2009年绿十字(中国)经营情况
表:截止2011年7月绿十字(中国)血液制品产品名录
表:2007-2011.1-7绿十字(中国)血液制品批签发量
Basic Components of Blood
Classification and Effects of Blood Products
Comparison between Gene Recombinant Blood Products and Traditional Blood Products
Categories and Comparison of Recombinant Blood Products in China and Worldwide
Blood Product Industry Chain
Blood Product Market Scale in China, 2003-2015E
Lot Release Volume of Blood Products (by Product) in China, 2007-Jul.2011
Product Structure of Blood Products in China (by Lot Release Volume), 2009-2010
Annual Plasma Volume in China, 2002-2010
Geographical Distribution of Plasma Collection Station Resources in China, Aug.2011
Comparison of Per Capita Usage of Blood Products between China and Developed Countries
Market Share of Major Manufacturers of Blood Products in China, 2010
Comparison among Blood Product Manufacturing Enterprises in China by Product Line
Production of Blood Product Manufacturing Enterprises in China, Aug.2011
Global Blood Product Market Scale, 2003-2010
Blood Products in Overseas Countries
On-going Clinical Trial of New Indications Overseas
Global Blood Product Manufacturing Enterprises
Operation of International Blood Product Giants, 2010
Major Policies for Blood Products in China
Sales and YoY Growth Rate of Biological and Biochemical Pharmaceuticals in China, 2005-H1 2011
Supply and Demand of Human Albumin Worldwide, 2010
Ratio of Domestic and Imported Human Albumin in China (by Lot Release Volume), 2007-2010
Market Share of Major Manufacturers of Domestic Human Albumin (by Lot Release Volume), 2007-2010
Market Share of Major Manufacturers of Imported Human Albumin (by Lot Release Volume), 2007-2010
Comparison between China and USA by Consumption of Human Immunoglobulin (pH4) for Intravenous Injection, 2010
Lot Release Volume and Its Growth Rate of Human Immunoglobulin (pH4) for Intravenous Injection in China, 2007-2010
Market Share of Major Manufacturers of Human Immunoglobulin (pH4) for Intravenous Injection (by Lot Release Volume), 2007-2010
Lot Release Volume and Its Growth Rate of Coagulation Factor VIII in China, 2008-2010
Market Share of Major Manufacturers of Coagulation Factor VIII in China (by Lot Release Volume), 2008-2010
Comparison between Human-derived Coagulation Factor VIII and Recombinant Coagulation Factor VIII
Lot Release Volume and Its Growth Rate of Hepatitis B Immunoglobulin in China, 2008-2010
Market Share of Major Manufacturers of Hepatitis B Immunoglobulin (by Lot Release Volume), 2008-2010
Release Volume and Its Growth Rate of Human Immunoglobulin in China, 2008-2010
Major Manufacturers and Their Shares in Chinese Human Immunoglobulin Market (by Lot Release Volume), 2008-2010
Release Volume and Its Growth Rate of Human Prothrombin Complex in China, 2008-2010
Manufacturers and Their Shares in Chinese Human Prothrombin Complex Market (by Lot Release Volume), 2008-2010
Lot Release Volume and Its Growth Rate of Tetanus Immunoglobulin in China, 2008-2010
Market Share of Major Manufacturers in Chinese Tetanus Immunoglobulin Market (by Lot Release Volume), 2008-2010
Lot Release Volume and Its Growth Rate of Rabies Immunoglobulin in China, 2008-2010
Market Share of Major Manufacturers in Chinese Rabies Immunoglobulin Market (by Lot Release Volume), 2008-2010
Operating Revenue and Net Income of Hualan Biological Engineering Ltd, 2007-H1 2011
Operating Revenue of Hualan Biological Engineering Ltd (by Sector), 2007-2010
Gross Margin of Hualan Biological Engineering Ltd (by Product), 2007-2010
Operating Revenue of Hualan Biological Engineering Ltd (by Region), 2007-2010
Distribution of Plasma Collection Stations of Hualan Biological Engineering Ltd, Aug.2011
Lot Release Volume of Blood Products of Hualan Biological Engineering Ltd, 2007-Jul.2011
Proportion of Blood Products Release Volume of Hualan Biological Engineering Ltd, 2008-Jul.2011
Operating Revenue of Blood Products of Hualan Biological Engineering Ltd (by Product), 2007-2010
Operating Revenue and Net Income of Shanghai RAAS Blood Products Co., Ltd, 2007-H1 2011
Operating Revenue of Shanghai RAAS Blood Products Co., Ltd (by Product), 2005-2010
Gross Margin of Shanghai RAAS Blood Products Co., Ltd (by Product), 2005-2010
Operating Revenue of Shanghai RAAS Blood Products Co., Ltd (by Region), 2008-2010
Lot Release Volume of Blood Products of Shanghai RAAS Blood Products Co., Ltd, 2007-Jul.2011
Proportion of Blood Products Release Volume of Shanghai RAAS Blood Products Co., Ltd, 2007-Jul.2011
Distribution of Plasma Collection Stations of Shanghai RAAS Blood Products Co., Ltd, Aug.2011
Plasma Volume of Shanghai RAAS Blood Products Co., Ltd, 2007-2011E
Operating Revenue and Net Income of Beijing Tiantan Biological Products Co., Ltd, 2007-Q1 2011
Operating Revenue of Beijing Tiantan Biological Products Co., Ltd (by Product), 2007-2010
Gross Margin of Beijing Tiantan Biological Products Co., Ltd (by Product), 2007-2010
Operating Revenue of Beijing Tiantan Biological Products Co., Ltd (by Region), 2007-2010
Operation of Chengdu Rongsheng Pharmaceuticals Co., Ltd, 2008-2009
Lot Release Volume of Blood Products of Chengdu Rongsheng Pharmaceuticals, 2007-Jul.2011
Proportion of Blood Products Release Volume of Chengdu Rongsheng Pharmaceuticals Co., Ltd, 2008-Jul.2011
Distribution of Blood Plasma Collection Stations of Chengdu Rongsheng Pharmaceuticals Co., Ltd, Aug.2011
Operating Revenue and Gross Profit of China Biologic Products, Inc, 2007-H1 2011
Operating Revenue of Blood Products of China Biologic Products, Inc (by Product), 2007-2010
Operating Revenue and Total Profit of Shandong Taibang Biological Products Co. Ltd, 2008-2009
Lot Release Volume of Blood Products of Shandong Taibang Biological Products Co. Ltd, 2007-Jul.2011
Operating Revenue and Total Profit of Xi’an Huitian Blood Products Co. Ltd, 2008-2009
Lot Release Volume of Blood Products of Xi’an Huitian Blood Products Co. Ltd, 2007-Jul.2011
Operating Revenue and Total Profit of Guiyang Qianfeng Biological Product Liability Co., Ltd., 2008-2009
Lot Release Volume of Blood Products of Guiyang Qianfeng Biological Product Liability Co., Ltd., 2007-Jul.2011
Operating Revenue and Net Income of Jiangxi Boya Biopharmaceutical Co., Ltd., 2008-2010
Operating Revenue of Jiangxi Boya Biopharmaceutical Co., Ltd. (by Product), 2008-2010
Gross Margin of Jiangxi Boya Biopharmaceutical Co., Ltd. (by Product), 2008-2010
Prices Trend of Blood Products of Jiangxi Boya Biopharmaceutical by Product, 2008-2010
Plasma Volume of Plasma Collection Stations of Jiangxi Boya Biopharmaceutical, 2008-2010
Lot Release Volume of Blood Products of Jiangxi Boya Biopharmaceutical Co., Ltd., 2007-Jul.2011
R & D Investment and the Proportion in Sales of Jiangxi Boya Biopharmaceutical, 2008-2010
Blood Product R & D Projects and Progress of Jiangxi Boya Biopharmaceutical, July 2011
Operating Revenue and Total Profit of Sichuan Yuanda Shuyang Pharmaceutical Co., Ltd, 2008-2009
Lot Release Volume of Blood Products of Sichuan Yuanda Shuyang Pharmaceutical Co., Ltd, 2007-Jul.2011
Operation of CNBG Shanghai Institute of Biological Products, 2008-2009
Blood Product List of CNBG Shanghai Institute of Biological Products, Jul.2011
Lot Release Volume of Blood Products of CNBG Shanghai Institute of Biological Products, 2007-Jul.2011
Distribution of Plasma Collection Stations of CNBG Shanghai Institute of Biological Products, Aug.2011
Operation of Shanxi Kangbao Biological Products Co., Ltd, 2008-2009
Lot Release Volume of Blood Products of Shanxi Kangbao Biological Products Co., Ltd, 2007-Jul.2011
Proportion of Blood Products Release Volume of Shanxi Kangbao Biological Products Co., Ltd, 2008-Jul.2011
Operation of Green Cross (China), 2008-2009
Blood Product List of Green Cross (China), Jul.2011
Lot Release Volume of Blood Products of Green Cross (China), 2007-Jul.2011
如果这份报告不能满足您的要求,我们还可以为您定制报告,请 留言说明您的详细需求。
|