|
|
|
报告导航:研究报告—
生命科学—生物科技
|
|
2010-2011年中国肝素行业研究报告 |
 |
字数:3.0万 |
页数:70 |
图表数:70 |
|
中文电子版:7000元 |
中文纸版:3500元 |
中文(电子+纸)版:7500元 |
|
英文电子版:1800美元 |
英文纸版:1900美元 |
英文(电子+纸)版:2100美元 |
|
编号:HM006
|
发布日期:2011-09 |
附件:下载 |
 |
|
|
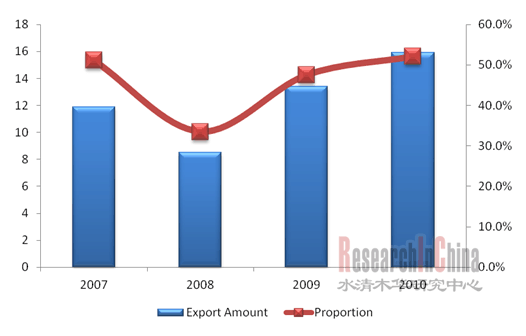
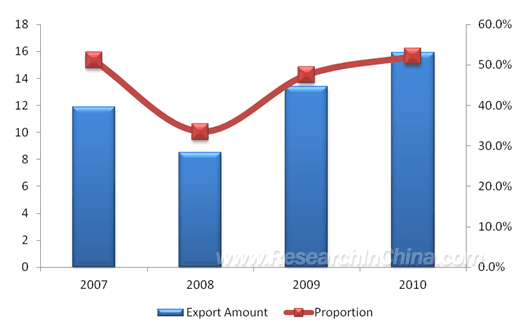
由于中国肝素原料来源丰富,加之肝素原料药品质逐渐得到国际认可,目前中国已成为全球最大的肝素原料药生产和出口国之一。2010年中国持有SFDA颁发的肝素钠原料药生产批准文号的企业有24家;肝素原料药出口量达到15.9万亿单位,占据全球52.1%的市场份额。
图:2007-2010年中国肝素原料药出口量及全球占比(单位:万亿单位)  整理:水清木华研究中心 欧美是中国肝素原料药主要出口地。2011年1-7月,中国生产的肝素及其盐已出口到44个国家,按出口数量计,前五大市场为法、德、美、奥及意,出口数量合计占比高达83.7%。 要进入欧美市场,必须获得欧盟CEP认证或美国FDA认证,由于此类认证非常严格,致使很多技术不过关的企业退出出口市场。截至2011年8月,中国获得CEP、FDA认证的肝素原料药生产企业分别仅有6家和2家。其中海普瑞和千红制药由于同时取得了这两项认证,在市场竞争中居于领先地位。 中国虽然为肝素原料药大国,但在下游普通肝素钠制剂和低分子肝素制剂生产还处于初级阶段。 普通肝素制剂市场中,中国现有26家制药企业取得了SFDA 颁发的肝素钠注射液药品批准文号。由于肝素钠原料药价格攀升带来的成本压力过大,在市场上比较活跃的不到10家。天津生化、江苏万邦及上海第一生化是中国主要普通肝素制剂生产企业,不过它们都需要采购上游原材料。 由于技术原因,中国低分子肝素制剂市场主要由国外品牌占据。2009年,法国赛诺菲的克赛和葛兰素史克的速碧林分别以54.5%和59.0%的市场份额,位居中国低分子肝素钠和低分子肝素钙市场第一。但随着中国厂家的研发与技术实力的增强,本土产品在低分子肝素制剂市场的竞争力正逐渐加强。如常山药业生产的低分子肝素钙注射液2010年销售收入为5161.2万元,同比增长72.6%。
With richness in heparin materials and the quality of heparin API getting accredited by the international community, China has become one of the largest heparin API producers and exporters in the world. In 2010, there were 24 heparin API manufacturers with the heparin sodium API production license granted by SFDA in China, with the export volume of heparin API reaching 15.9 trillion units, a 52.1% market share globally.
Export Volume and Proportion in the World of Heparin API in China, 2007-2010 (trillion units) Source: ResearchInChina Europe and America are the major export destinations of heparin API made in China. From January to July of 2011, heparin and heparinate made in China were exported to 44 countries. In terms of export volume, the top 5 export destinations were France, Germany, America, Austria and Italy, with the combined export volume standing at 83.7%. It is required to obtain CEP certification of EU or FDA authentication of the US for companies to access into the European and American markets. Due to the stringent authentication criterion, many unqualified enterprises are forced to withdraw from the market. As of August, 2011, China had 6 CEP certified heparin API producers and 2 FDA certified ones. In particular, both Shenzhen Hepalink Pharmaceutical and Changzhou Qianhong Bio-Pharma obtained the two certifications, an edge over the oppositions. Although it is a large producer of heparin API, the production of downstream unfractionated heparin (UFH) sodium preparations and low-molecular-weight (LMW) heparin preparations in China is still in its infancy. In the UFH preparation market, 26 Chinese companies have obtained the heparin sodium injection drug production licenses granted by SFDA. Due to the mounting pressure arising from the soaring price of heparin API, there are less than 10 companies that seem competitive in Chinese market, such as Tianjin Biochemical Pharmaceutical, Wanbang Biopharmaceuticals and Shanghai No.1 Chemical & Pharmaceutical, but all of them need to procure upstream raw material for production. Restricted by the technology, the LMW heparin preparation market of China is dominated by foreign brands. In 2009, Chinese markets of LMW heparin sodium and LMW heparin calcium were dominated by France-based Sanofi’s Clexane and GSK’s Fraxiparine, topping the market with the respective share of 54.5% and 59.0%. However, the LMW heparin preparation products made by domestic companies become increasingly competitive with the enhanced strength in R&D and technology. For instance, the sales of Hebei Changshan Biochemical Pharmaceutical, a company producing LMW heparin calcium injection, rose 72.6% YoY to RMB51.612 million in 2010.
第一章 肝素行业概述
1.1 定义和分类
1.2 产业链
第二章 中国肝素行业国际运行环境
2.1肝素类药物需求情况
2.2肝素类药物需求分布
2.3 肝素原料药需求分析
2.4竞争概况
2.5 相关政策
2.6 市场预测
第三章 中国肝素原料药行业发展现状
3.1 市场概况
3.2 市场供需
3.3 竞争格局
3.4 发展动态
3.5 相关政策
3.6 市场预测
第四章 中国肝素制剂行业发展现状
4.1 抗血栓药物概况
4.2市场概况
4.3普通肝素制剂
4.3.1 国际环境
4.3.2 市场规模
4.3.2 竞争格局
4.4 低分子肝素制剂
4.4.1国际环境
4.4.2 市场规模
4.5 市场供需
4.6 竞争格局
4.7 发展动态及专利情况
4.8 市场预测
第五章 中国肝素进出口贸易分析
5.1 出口贸易分析
5.1.1 出口数量分析
5.1.2 出口目的地国家分布
5.2 进口贸易分析
5.2.1 进口目的地分析
5.2.2 进口来源国家分析
第六章 中国肝素制造企业分析
6.1 深圳市海普瑞药业有限公司
6.1.1 公司简介
6.1.2 经营状况
6.1.3 发展动态
6.2 常州千红生化制药有限公司
6.2.1 公司简介
6.2.2 经营状况
6.2.3 发展动态
6.3 天津红日药业股份有限公司
6.3.1 公司简介
6.3.2 经营状况
6.3.3 发展动态
6.4 河北常山生化药业有限公司
6.4.1 公司简介
6.4.2 经营状况
6.4.3 发展动态
6.5 南京健友生物化学制药有限公司
6.5.1 公司简介
6.5.2 经营状况
6.6 烟台东诚生化有限公司
6.6.1 公司简介
6.6.2 经营状况
6.7 江苏万邦
6.7.1 公司简介
6.7.2 经营状况
6.7.3 发展动态
1. Profile of Heparin Industry
1.1 Definition & Classification
1.2 Industry Chain
2. International Operating Environment of Heparin Industry
2.1 Demand of Heparin Medicine
2.2 Distribution of Heparin Medicine Demand
2.3 Heparin API Demand
2.4 Overseas Competitors
2.5 Related Policies
2.6 Market Forecast
3. Current Development of China Heparin API Industry
3.1 Market Overview
3.2 Demand & Supply
3.3 Competition
3.4 Dynamics
3.5 Related Policies
3.6 Market Forecast
4. Current Development of China Heparin Preparation Industry
4.1 Overview of Antithrombotic Drugs
4.2 Market Overview
4.3 UFH Preparations
4.3.1 International Environment
4.3.2 Market Size
4.3.3 Competition
4.4 LMW Heparin Preparations
4.4.1 International Environment
4.4.2 Market Size
4.5 Demand & Supply
4.6 Competition
4.7 Dynamics & Patents
4.8 Market Forecast
5. Import & Export
5.1 Export
5.1.1 Export Volume
5.1.2 Export Destinations
5.2 Import
5.2.1 Import Destinations
5.2.2 Import Origins
6. Heparin Manufacturers in China
6.1 Shenzhen Hepalink Pharmaceutical
6.1.1 Profile
6.1.2 Operation
6.1.3 Dynamics
6.2 Changzhou Qianhong Bio-Pharma Co., Ltd
6.2.1 Profile
6.2.2 Operation
6.2.3 Dynamics
6.3 Tianjin Chase Sun Pharmaceutical
6.3.1 Profile
6.3.2 Operation
6.3.3 Dynamics
6.4 Hebei Changshan Biochemical Pharmaceutical
6.4.1 Profile
6.4.2 Operation
6.4.3 Dynamics
6.5 Nanjing King-Friend Biochemical Pharmaceutical Co., Ltd
6.5.1 Profile
6.5.2 Operation
6.6 Yantai Dongcheng Biochemicals Co., Ltd
6.6.1 Profile
6.6.2 Operation
6.7 Wanbang Biopharmaceuticals
6.7.1 Profile
6.7.2 Operation
6.7.3 Dynamics
图:2003-2012年全球肝素类药物销售与预测
图:2010年肝素类药物全球消费分布
图:2007-2013年全球肝素原料药市场规模及增长率
图:2008-2014年全球肝素类药物市场发展预测
图:2007-2010年中国肝素原料药出口量及全球占比
图:2003-2010年中国肉猪出栏头数及猪年底头数
图:2008-2010年中国肝素粗品价格走势
表:2010年1-9月中国肝素原料药出口金额排名前十企业
表:2008-2010年中国肝素原料药主要厂商毛利率
图:2011-2013年全球和中国肝素钠原料药供应量及中国占比
图:2003-2012年中国抗血栓药物市场规模
表:2005 -2009 年中国抗血栓药主要品种医院市场份额
图:2007-2013年中国肝素类药品市场规模
图:2009年中国肝素制剂类产品市场份额
图:2006-2012年全球普通肝素制剂市场规模
图:2005-2011年中国普通肝素制剂销售额
图:2007-2012年中国肝素钠注射液市场需求
表:中国肝素钠和肝素钙注射液主要生产商
表:2008-2009年中国主要普通肝素制剂生产商经营情况
表:低分子量肝素制剂和普通肝素制剂性能比较
图:2006-2012年全球低分子肝素制剂市场规模
图:2006-2010年中国低分子肝素制剂市场规模
图:2005-2011年中国低分子肝素钙和低分子肝素钠占抗血栓药物份额变化趋势
表:中国低分子肝素钠制剂和低分子肝素钙制剂生产商
图:2009年中国低分子肝素钠市场竞争格局
图:2009年中国低分子肝素钠主要企业销售额及同比增长
图:2009年中国低分子肝素钙市场竞争格局
图:2009年中国低分子肝素钙主要企业销售额同比增长
表:主要低分子肝素专利情况
图:2010-2014年中国低分子肝素类药市场规模
表:2011年1-7月中国西药重点商品出口统计情况
图:2008-2011年中国肝素及其盐出口额及增长率
图:2008-2011年中国肝素类产品出口数量及价格走势
表:2011年1-7月中国肝素海外市场分布情况
图:2009-2010年年中国肝素原料药主要出口企业及其占比(按出口金额)
图:2008-2011年中国肝素类产品进口数量和单价走势
表:2008-2011年中国肝素类产品进口目的地情况
表:2008-2011年中国肝素类产品进口来源国家情况
图:2007-2011年海普瑞肝素钠原料药营业收入与增长率
表:2008-2011年海普瑞肝素钠原料药不同产品等级收入情况
图:2007-2011海普瑞肝素钠原料药(分产品)毛利率
图:2007-2011年海普瑞主营收入区域构成
图:2007-2011年海普瑞营业利润及增长率
图:2007-2011千红制药营业收入与净利润
图:2008-2011千红制药(分产品)营业收入
图:2009-2011H1千红制药(分产品)毛利率
图:2007-2011H1年千红制药主营收入地域构成
表:2009-2010年千红制药肝素钠原料药前五大客户
图:2008-2010年千红制药研发投入及占营业收入比重
图:2007-2011年红日药业营业收入及净利润
图:2009-2011年红日药业(分产品)营业收入构成
图:2008-2011红日药业(分产品)毛利率
图:2007-2011年红日药业低分子肝素钙营业收入及同比增长
图:2008-2011红日药业主营收入地域构成
表:红日药业主要业务竞争和销售方式
图:2008-2010年常山药业营业收入及净利润
图:2008-2010年常山药业(分产品)营业收入
图:2008-2010年常山药业(分产品)毛利率
图:2008-2010年常山药业主营收入区域构成
图:2008-2010年常山药业前五名客户销售情况及占营业收入比例
图:2008-2010年常山药业研发投入及占营业收入比重
表:常山药业正在研发项目及拟达到目标
表:常山药业募集项目
图:2008-2009年南京健友经营情况
表:2009年1-9月及2010年1-9月南京健友肝素原料药出口情况
图:2008-2009年烟台东诚经营情况
表:2009-2010年烟台东诚肝素原料药出口情况
图:2008-2009年江苏万邦经营情况
Application of Heparin Preparations
Heparin Industry Chain
Sales of Heparin Drugs Worldwide, 2003-2012E
Distribution of Heparin Drug Consumption Worldwide, 2010
Market Size and Growth Rate of Heparin API Worldwide,2007-2013
Forecast of Global Heparin Drug Market Development
Export Volume and The Global Proportion of Heparin API in China, 2007-2010
Number of Slaughtered Fattened Hogs (Head) and Year-end Number of Hogs (Head) of China, 2003-2010
Price Trend of Crude Sodium Heparin API in China, 2008-2010
Top ten Pharmaceutical Companies by Export Value of Heparin in China, Jan.-Sep.2010
Gross Margin of Major Heparin API Manufacturers in China, 2008-2010
Heparin Sodium API Supply in China and the World and China’s Share, 2011-2013
China Antithrombotic Drug Market Size, 2003-2012
Market Share of China's Major Varieties of Anti-thrombosis Drug in Hospital,2005-2009
Market Size of Heparin Drug in China,2007-2013
Chinese Market Share of Heparin Preparation Products, 2009
Market Size of Global UFH Preparations,2006-2012
Sales of UFH Preparations in China,2006-2012
Market Demand for Heparin Sodium Injection Solution in China, 2007-2012
Manufacturers of Heparin Sodium Injection Solution and Heparin Calcium Injection Solution in China
Operation of Major UFH Preparations,Manufacturers in China,2008-2009
Performance Comparison between Low Molecular Weight Heparin Preparations and UFH Preparations
Market Size of Global Low Molecular Weight Heparin Preparations,2006-2012
Market Size of Low Molecular Weight Heparin Preparations in China,2006-2010
Proportion of Low-molecular Heparin Calcium and Low-molecular Heparin Sodium in Anticoagulant Medicines of China, 2005-2011
Manufacturers of Low-molecular Heparin Sodium Preparations and Low-molecular Heparin Calcium Preparations
Competition Pattern of China Low-Molecular-Weight Heparin Sodium Market, 2009
YoY Growth Rate for Sales of Main Competitive Enterprises of Low-molecular Weight Heparin Sodium in China, 2009
Competition Pattern of China Low-Molecular-Weight Heparin Calcium Market, 2009
YoY Growth Rate for Sales of Main Competitive Enterprises of Low-molecular Weight Heparin Calcium in China, 2009
Main Patents for LMW Heparin
China LMW Heparin Drug Market Size, 2010-2014
Export of Key Western Medicines of China, Jan.-Jul. 2011
Export Value and Its Growth Rate of Heparin and Its Salts in China,2008-2011
China’s Export Volume and Price Trend of Heparin Products, 2008-2011
Overseas Market Distribution of Heparin Products in China, Jan.-Jul.2011
Main Chinese Exporting Enterprises of Heparin API and Their Percentages by Export Value, Jan.-Sep., 2009 and Jan.-Sep., 2010
Import Volume and Unit Price Trend of Heparin Products in China, 2008-Jan-Jul.2011
Destinations of China’s Heparin Product Imports, 2008- Jan-Jul.2011
Import Origins of China Heparin Products, 2008- Jan-Jul.2011
Heparin Sodium API Operating Revenue and YOY of Shenzhen Hepalink Pharmaceutical Co., Ltd., 2007- H1 2011
Heparin Sodium API Revenue of Shenzhen Hepalink Pharmaceutical Co., Ltd by Product Grade, 2007- H1 2011
Gross Margin of Heparin API (by Product) of Shenzhen Hepalink Pharmaceutical Co., Ltd., H12007-2011
Operating Revenue of Shenzhen Hepalink Pharmaceutical Co., Ltd. by Region, 2007- H1 2011
Total Profit and YPY of Shenzhen Hepalink Pharmaceutical Co., Ltd., 2007- H1 2011
Operating Revenue and Net Income of Changzhou Qianhong Bio-Pharma Co., Ltd., 2007- H1 2011
Operating Revenue (by Product ) of Changzhou Qianhong Bio-Pharma Co., Ltd., 2008- H1 2011
Gross Margin (by Product ) of Changzhou Qianhong Bio-Pharma Co., Ltd., 2009- H1 2011
Operating Revenue of Changzhou Qianhong Bio-Pharma Co., Ltd. by Region,2007- H1 2011
Top Five Clients of Heparin Sodium API of Changzhou Qianhong Bio-Pharma Co., Ltd, 2009-2010
R&D Input and Its Ratio to Operating Revenue of Changzhou Qianhong Bio-Pharma Co., Ltd, 2008-2010
Operating Revenue and Net Income of Tianjin Chase Sun Pharmaceutical Co., Ltd., 2007- H1 2011
Operating Revenue (by Product) of Tianjin Chase Sun Pharmaceutical Co., Ltd, 2009 - H1 2011
Gross Margin (by Product ) of Tianjin Chase Sun Pharmaceutical Co., Ltd, 2008- H1 2011
Heparin Calcium Operating Revenue and YoY Growth of Tianjin Chase Sun Pharmaceutical Co., Ltd, 2007- H1 2011
Operating Revenue of Tianjin Chase Sun Pharmaceutical Co., Ltd. by Region, 2008-2011H1 Competition and Distribution of Major Businesses of Tianjin Chase Sun Pharmaceutical Co., Ltd.
Operating Revenue and Net Income of Hebei Changshan Biochemical Pharmaceutical Co., Ltd, 2008-2010
Operating Revenue (by Product) of Hebei Changshan Biochemical Pharmaceutical Co.,Ltd., 2008-2010
Gross Margin (by Product ) of Hebei Changshan Biochemical Pharmaceutical Co.,Ltd., 2008-2010
Operating Revenue of Hebei Changshan Biochemical Pharmaceutical Co., Ltd. by Region, 2008-2010
Sales of Top Five Customers of Hebei Changshan Biochemical Pharmaceutical Co., Ltd. and Their Proportion to total Operating Revenue,2008-2010
R&D Input and Its Ratio to Operating Revenue of Hebei Changshan Biochemical Pharmaceutical Co.,Ltd.,2008-2010
Projects under R&D and Expected Target of Changshan Biochemical Pharmaceutical Co., Ltd.
Raising Project of Changshan Biochemical Pharmaceutical Co.,Ltd.
Heparin API Export of Nanjing King-Friend Biochemical Pharmaceutical Co., Ltd., Jan.-Sep., 2009 and Jan.-Sep., 2010
Operation of Nanjing King-Friend Biochemical Pharmaceutical Co., Ltd, 2008-2009
Operation of Yantai Dongcheng Biochemicals Co., Ltd, 2008-2009
Heparin API Export of Yantai Dongcheng Biochemicals Co., Ltd, Jan.-Sep., 2009 and Jan.-Sep., 2010
Operation of Wanbang Biopharmaceuticals, 2008-2009
如果这份报告不能满足您的要求,我们还可以为您定制报告,请 留言说明您的详细需求。
|