|
|
|
报告导航:研究报告—
制造业—材料
|
|
2010-2012年全球及中国玻璃纤维行业研究报告 |
 |
字数:3.3万 |
页数:83 |
图表数:73 |
|
中文电子版:8000元 |
中文纸版:4000元 |
中文(电子+纸)版:8500元 |
|
英文电子版:2100美元 |
英文纸版:2200美元 |
英文(电子+纸)版:2400美元 |
|
编号:SSX009
|
发布日期:2011-11 |
附件:下载 |
 |
|
|
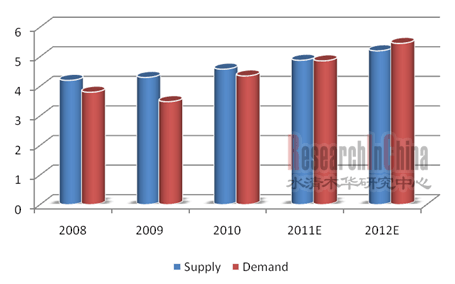
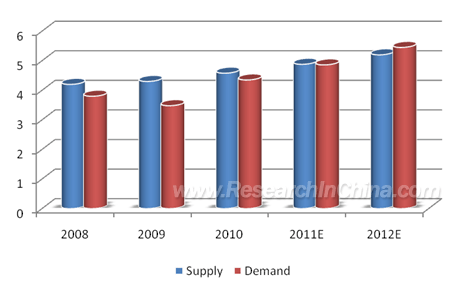
玻璃纤维作为良好的复合功能材料和非常重要的金属替代材料,被越来越多的应用在建筑、交通、电子电气、风电等行业。从2000年到2010年的10年时间,全球玻璃纤维产量稳定增长,年复合增长率为7.2%,预计2011年全球玻璃纤维产量将达到488万吨,需求为486万吨,供求基本平衡。 未来,在新增产能较少和下游需求持续增长的影响下,玻璃纤维价格将继续维持小幅走高,预计2012年全球玻璃纤维行业将出现供不应求的局面。
图:2008-2012年全球玻璃纤维需求及供给(单位:百万吨)  来源:玻璃纤维工业协会;整理:水清木华研究中心 2007 年之前,全球玻璃纤维生产主要集中在欧美地区。随着全球产业转移,中国玻纤产能不断提高,目前中国已经成为最大的玻璃纤维生产和消费国。2005年中国玻璃纤维表观消费量为80万吨,2010年则达到了335.5万吨,2005-2010年年均复合增长率达到33.6%。 中国玻璃纤维行业的一大特点是出口依赖度较高,国内玻璃纤维产量中35%以上产品都出口国外。2010年中国出口玻璃纤维120.8万吨,同比增长23.5%。2011年1-9月,中国玻璃纤维出口量为94.6万吨,同比增长0.32%,同比增长率出现了明显的下滑。未来随着中国国内需求的持续增长,将有望减少对出口的依赖。 从2009年底开始,以欧盟为首的西方国家开始对中国玻璃纤维产品发起反倾销,愈演愈烈的贸易保护迫使中国玻璃纤维生产企业开始了全球布局。2011年7月,中国玻璃纤维旗下巨石集团有限公司在埃及建厂,建设年产8万吨无碱玻璃纤维池窑拉丝生产线,预计2012 年底投产。重庆国际复合材料公司则在2011 年5 月完成了对欧文斯科宁荷兰子公司卡皮瓦里公司的收购。 本报告主要分析了全球和中国玻璃纤维行业的供需状况、竞争格局以及中国玻纤行业的进出口和上下游,另外还着重研究了欧文斯科宁、PPG和Johns Manville 3家全球重点企业和中国玻纤、重庆国际复合和泰山玻纤等11家中国重点企业。 玻纤产业行业集中度较高,全球前六大玻璃纤维生产企业的产能占总产能的77.8%,2010年产能最大的是OCV,产能达到124万吨。 中国玻璃纤维生产企业中,中国玻纤产能达到93.5万吨,产能排名中国第一,全球第二。预计未来几年全球玻璃纤维产能格局将不会发生明显变化。
As an excellent composite material and important metal substitute, glass
fiber has been applied to construction, transportation, electric and
electronics, wind power and other industries widely. From 2000 to 2010,
the global glass fiber output saw steady growth, with the annual
compound growth rate of 7.2%. In 2011, the global glass fiber output
will reach 4.88 million tons, and the demand will be 4.86 million tons,
roughly achieving balance. In the future, affected by sluggish
capacity expansion and increasing demand, glass fiber prices will
continue to rise slightly. In 2012, glass fiber will be in short supply
in the world. Global Glass Fiber Demand and Supply, 2008-2012 (Unit: million tons)  Source: ResearchInChina; China Fiberglass Industry Association Before
2007, the global glass fiber production was mainly concentrated in
Europe and America. With the transfer of the global industry, China's
glass fiber capacity has grown, and China has become the largest glass
fiber producer and consumer. China’s apparent consumption of glass fiber
was 800,000 tons in 2005 and 3.355 million tons in 2010; from 2005 to
2010, the average annual compound growth rate was 33.6%. China
glass fiber industry is featured with high dependence on export. 35% or
more of the domestic glass fiber products are exported. In 2010, China
exported 1.208 million tons of glass fiber, up 23.5% year on year. From
January to September of 2011, China's glass fiber export volume reached
946,000 tons, up 0.32% year on year, the growth rate declined
significantly. In the future, as the domestic demand continues to grow,
China is expected to reduce the dependence on export. Since the
end of 2009, western countries led by the European Union have
implemented anti-dumping measures against Chinese glass fiber products.
The strengthened trade protection has forced Chinese glass fiber
producers to make production globalization. In July 2011, Jushi Group of
China Fiberglass Co., Ltd. set up a factory in Egypt; it is building an
80,000 tons / year alkali-free glass fiber pool kiln wiredrawing
production line, which will put into operation at the end of 2012. In
May 2011, Chongqing Polycomp International Corporation acquired OCV
Capivari Fibras de Vidro Ltdal, a subsidiary of Owens Corning in the
Netherlands. This report analyzes supply & demand and
competition patterns of the global and China glass fiber industry. It
also analyzes import, export, upstream and downstream of China glass
fiber industry. In addition, it studies 3 key global companies
(including Owens Corning, PPG, and Johns Manville) and 11 key Chinese
enterprises (such as China Fiberglass, Chongqing Polycomp and Taishan
Fiberglass). Glass fiber industry features a high concentration
degree. The top six glass fiber companies account for 77.8% of the total
capacity in the world. In 2010, OCV ranked first in capacity with 1.24
million tons. Among the glass fiber manufacturers in China, the
capacity of China Fiberglass reached 935,000 tons, ranking first in
China and second in the world. In the next few years, the global glass
fiber capacity pattern will see little change.
第一章 玻璃纤维行业概述
1.1定义及分类
1.1.1定义
1.1.2分类
1.2用途
1.3生产工艺
1.4行业特征
第二章 全球玻璃纤维行业发展情况
2.1 发展现状
2.2 供需情况
2.3竞争格局
2.4 价格走势
第三章 中国玻璃纤维行业发展情况
3.1 政策环境
3.2经营情况
3.3 供需情况
3.3.1市场供给
3.3.2市场需求
3.4 竞争格局
3.5 行业壁垒
3.6发展趋势
第四章 中国玻璃纤维行业进出口情况
4.1进口情况
4.2出口情况
4.2.1出口量分析
4.2.2反倾销影响
第五章 中国玻璃纤维行业上下游分析
5.1玻璃纤维行业上游
5.2玻璃纤维行业下游
5.2.1建筑及基础设施领域
5.2.2交通运输领域
5.2.3电子电器领域
5.2.4风电领域
5.2.5船艇领域
5.2.6玻璃钢管道领域
第六章 玻璃纤维行业重点企业分析
6.1欧文斯科宁公司
6.1.1公司介绍
6.1.2经营情况
6.1.3玻璃纤维业务
6.1.4在华发展
6.2 PPG INDUSTRIES
6.2.1公司介绍
6.2.2经营情况
6.2.3玻璃纤维业务
6.2.4在华发展
6.3 JOHNS MANVILLE
6.3.1公司介绍
6.3.2玻璃纤维业务
6.4台湾必成股份有限公司
6.4.1公司介绍
6.4.2玻璃纤维业务
6.5中国玻璃纤维股份有限公司
6.5.1公司介绍
6.5.2经营情况
6.5.3玻璃纤维业务发展情况
6.5.4展望与预测
6.5.5发展战略
6.6重庆国际复合材料有限公司
6.6.1公司介绍
6.6.2经营情况
6.6.3玻璃纤维业务发展情况
6.6.4国外布局
6.7泰山玻璃纤维有限公司
6.7.1公司介绍
6.7.2玻璃纤维业务
6.8江苏九鼎新材料股份有限公司
6.8.1公司介绍
6.8.2经营情况
6.8.3玻璃纤维业务发展情况
6.8.4展望与预测
6.8.5发展战略
6.9珠海富华复合材料有限公司
6.9.1公司介绍
6.9.2经营情况
6.10常州新长海玻璃纤维有限公司
6.11其他公司
6.11.1江西大华玻璃纤维集团有限公司
6.11.2秦皇岛方圆玻璃有限公司
6.11.3上海宏和电子材料有限公司
6.11.4建滔(连州)玻璃纤维有限公司
1 Overview of Glass Fiber Industry
1.1 Definition & Classification
1.1.1 Definition
1.1.2 Classification
1.2 Application
1.3 Production Process
1.4 Industrial Characteristics
2 Development of Global Glass Fiber Industry
2.1 Status Quo
2.2 Supply and Demand
2.3 Competition Pattern
2.4 Price Trend
3 Development of China Glass Fiber Industry
3.1 Policy
3.2 Operation
3.3 Supply and Demand
3.3.1 Supply
3.3.2 Demand
3.4 Competition Pattern
3.5 Industry Barriers
3.6 Prospect and Trend
4 Import & Export of China Glass Fiber Industry
4.1 Import
4.2 Export
4.2.1 Analysis on Export Volume
4.2.2 Impact of Anti-dumping
5 Upstream and Downstream of China Glass Fiber Industry
5.1 Upstream
5.2 Downstream
5.2.1 Construction and Infrastructure
5.2.2 Traffic & Transportation
5.2.3 Electronic & Electrical
5.2.4 Wind Power
5.2.5 Ships and Yachts
5.2.6 FRP Pipes
6 Main Companies in Glass Fiber Industry
6.1 Owens Corning
6.1.1 Profile
6.1.2 Operation
6.1.3 Glass Fiber Business
6.1.4 Development in China
6.2 PPG Industries
6.2.1 Profile
6.2.2 Operation
6.2.3 Glass Fiber Business
6.2.4 Development in China
6.3 Johns Manville
6.3.1 Profile
6.3.2 Glass Fiber Business
6.4 PFG Fiber Glass Corporation
6.4.1 Profile
6.4.2 Glass Fiber Business
6.5 China Fiberglass Co., Ltd
6.5.1 Profile
6.5.2 Operation
6.5.3 Glass Fiber Business
6.5.4 Prospects & Forecast
6.5.5 Strategy
6.6 Chongqing Polycomp International Corporation
6.6.1 Profile
6.6.2 Operation
6.6.3 Glass Fiber Business
6.6.4 Overseas Layout
6.7 Taishan Fiberglass Co., Ltd, Inc.
6.7.1 Profile
6.7.2 Glass Fiber Business
6.8 Jiangsu Jiuding New Material Co., Ltd
6.8.1 Profile
6.8.2 Operation
6.8.3 Glass Fiber Business
6.8.4 Prospects & Forecast
6.8.5 Strategy
6.9 Zhuhai Fuhua Composite Materials Co., Ltd.
6.9.1 Profile
6.9.2 Operation
6.10 Changzhou New Chang Hai Glass Fiber Co., Ltd.
6.11 Others
6.11.1 Jiangxi Dahua Fiberglass Group Co., Ltd.
6.11.2 Qinhuangdao Fangyuan Glass Co., Ltd.
6.11.3 Shanghai Grace Fabric Co., Ltd.
6.11.4 Kingboard Fiber Glass Co., Ltd (Lianzhou)
图:玻璃纤维示意图
表:玻璃纤维产品(按含碱量)分类
图:玻璃纤维产品(按直径)分类及其用途
表:玻璃纤维行业应用领域
表:全球玻璃纤维行业周期
表:2010年全球玻璃纤维下游应用领域及其占比
图:2008-2012年全球玻纤需求及供给
图:1981-2012年全球玻纤需求增速
图:2011年全球玻纤前六大厂商市场份额
表:2008-2010年PPG公司提价情况
图:2007-2011年某经销商玻璃纤维报价
表:玻璃纤维行业相关政策
图:2005-2011年中国玻璃纤维行业总资产
图:2005-2011年中国玻璃纤维行业主营业务收入及同比增长
图:2005-2011年中国玻璃纤维行业利润总额及同比增长
图:2005-2011年中国玻璃纤维行业毛利率
图:2005-2012年中国玻璃纤维产量
图:2008-2012年中国玻璃纤维池窑法和坩埚法产量
图:2005-2012年中国玻璃纤维表观消费量
表:2011年中国玻璃纤维企业产能占比
表:2011年中国主要玻璃纤维企业竞争力情况
图:2005-2012年中国玻璃纤维进口量
图:2005-2012年中国玻璃纤维进口金额
图:2005-2012年中国玻璃纤维出口量
图:2010年中国玻璃纤维出口产品结构
表:2009-2011年其他国家对中国玻璃纤维提出反倾销调查情况
图:玻璃纤维生产成本构成
图:2010年中国玻璃纤维行业下游需求结构
图:2006-2011年中国房屋新开工面积
图:2008-2011年中国轿车产量
表:1996-2020中国铁路发展规划
表:2008-2050中国城市轨道交通规划
表:玻璃纤维布基覆铜板的主要用途
图:玻璃纤维在印制电路板中的应用
图:2008-2012年中国PCB产值及预测
图:2005-2012年全球风电装机容量及同比增长
图:2005-2012年中国风电装机容量及同比增长
表:国外玻璃纤维复合材料造船案例
表:2005-2009年中国复合材料船艇企业产值
表:2005-2010年中国娱乐船和运动船进出口额
表:玻璃钢管、碳钢管和铸铁管的性能
图:2008-2011年欧文斯科宁公司营业收入和息税前利润(EBIT)
图:2008-2010年欧文斯科宁公司分业务营业收入
图:2007-2011年欧文斯科宁建筑材料业务销售额及息税前利润(EBIT)占比
图:2011年欧文斯科宁建筑材料业务分市场收入
图:2007-2009年欧文斯科宁 (杭州)主营业务收入和利润总额
图:PPG公司玻璃纤维产品类型和应用领域
图:2007-2011年上半年PPG收入与净利润
图:2008年与2010年PPG(分地区)收入构成
图:2007-2011年上半年PPG(分产品)收入构成
图:2007-2009年必成玻璃纤维(昆山)有限公司主营业务收入和利润总额
表:2010年台湾必成股份有限公司玻璃纤维产能
图:2008-2011年中国玻纤营业收入和净利润
图:2004-2011年中国玻纤毛利率与净利率变化
图:2008-2011年中国玻纤产品内销和外销比例
表:2011年中国玻纤公司玻璃纤维生产基地及产能
图:新型玻璃纤维E6用途
图:2005-2012年中国玻纤玻璃纤维产能
图:2010-2013年中国玻纤主营业务收入和净利润及同比增长
图:2008-2010年CPIC营业收入和利润总额
图:2005-2012年CPIC玻璃纤维产能
表:2011年CPIC玻璃纤维产品种类和产能
图:2008-2012年CPIC玻璃纤维销量及毛利率
图:2005-2012年泰山玻璃纤维公司玻璃纤维产能
图:2007-2009泰山玻璃纤维营业收入和利润总额
图:2008-2011年九鼎新材营业收入和净利润
图:2008-2012年九鼎新材玻璃纤维产能
图:2010-2013年九鼎新材主营业务收入和净利润及同比增长
图:2007-2008年珠海复材公司经营情况
表:江西大华玻璃纤维集团子公司
表:江西大华集团玻璃纤维产品类型及产能
图:江西大华集团玻璃纤维及其制品
图:2007-2009年秦皇岛方圆公司主营业务收入和利润总额
图:2005-2008年宏和电子材料公司主营业务收入和利润总额
图:2005-2009年建滔(连州)玻璃纤维主营业务收入和利润总额
Classification of Glass Fiber Products
Applications of Glass Fiber
Cycle of Global Glass Fiber Industry
Downstream Applications and Proportions of Global Glass Fiber, 2010
Glass Fiber Demand and Supply Worldwide, 2008-2012E
Growth rate of Global Glass Fiber Demand, 1981-2012E
Market Shares of Top 6 Glass Fiber Manufacturers Worldwide, 2011
Price Raisings of PPG, 2008-2010
A Dealer’s Quoted Price of Glass Fiber , 2007-2011
Policies Concerning China Glass Fiber Industry
Total Assets of China Glass Fiber Industry, 2005-2011
Operating Revenue and YOY Growth of China Glass Fiber Industry, 2005-2011
Total Profit and YOY Growth of China Glass Fiber Industry, 2005-2011
Gross Margin of China Glass Fiber Industry, 2005-2011
Output of Glass Fiber in China, 2005-2012
Glass Fiber Output of China by Furnace Process and Crucible Process, 2008-2012
Apparent Consumption of Glass Fiber in China, 2005-2012
Capacity Proportion of Glass Fiber Enterprises in China, 2011
Capacity & Product of Major Glass Fiber Enterprises in China, 2011
Glass Fiber Import Volume of China, 2005-2012
Glass Fiber Import Value of China, 2005-2012
Glass Fiber Export Volume of China, 2005-2012
Breakdown of China’s Glass Fiber Export by Product Type, 2010
Anti-dumping Investigations of Foreign Countries on Chinese Glass Fiber Industry, 2009-2011
Production Cost of Glass Fiber
Downstream Demand Breakdown of China Glass Fiber Industry, 2010
Area of Floor Space Newly Constructed in China, 2006-2011
Output of Sedans in China, 2008-2011
China's Railway Development Planning
China's Urban Rail Transit Planning
Main Usage of Glass Fibre Cloth CCL
Application of Glass Fibre in Printed Circuit Board
Output Value and Forecast of PCB in China, 2008-2012
Installed Capacity and YoY Growth of Wind Power Worldwide, 2005-2012Installed Capacity and YoY Growth of Wind Power in China, 2005-2012Shipbuilding Cases with Glass Fibre Composite Materials in Foreign Countries
Output Value of Enterprises of Ship & Yacht Made of Composite Materials in China, 2005-2009
Import and Export Value of Recreational Boats and Motor Boats in China, 2005-2010
Performance of FRP Pipe, Carbon Steel Pipe and Cast Iron Pipe
Net Sales and EBIT of Owens Corning, 2008-2011
Net Sales of Owens Corning by Business, 2008-2011
Sales of Owens Corning Building Materials Business, 2007-2011
Sales of Owens Corning Building Materials Business by Region,2011
Operating Revenue and Total Profit of Owens Corning (Hangzhou), 2007-2009
Types and Applications of PPG's Glass Fiber Products
Revenue and Net Income of PPG, 2007- 2011
Revenue Breakdown of PPG (by Region), 2008 vs. 2010
Revenue Breakdown of PPG (by Product), 2007- 2011
Operating Revenue and Total Profit of PFG Fiber Glass (Kunshan), 2007-2009
Glass Fibre Capacity of PFG Fiber Glass Corporation, 2010
Operating Revenue and Net Income of China Fiberglass Co., Ltd, 2008-2011
Gross Margin and Net Profit Margin of China Fiberglass Co., Ltd, 2004-2011
Home Sales and Overseas Distribution Percentages of China Fiberglass Co., Ltd, 2008-2011
Glass Fibre Production Bases and Capacities of China Fiberglass Co., Ltd, 2011
Usage of New Fibre E6
Glass Fiber Capacity of China Fiberglass Co., Ltd, 2005-2012
Operating Revenue & Net Income and YoY Growth of China Fiberglass Co., Ltd, 2010-2013
Operating Revenue and Total Profit of CPIC, 2008-2010
Glass Fiber Capacity of CPIC glass, 2005-2012
Types and Capacities of CPIC’s Glass Fiber Products, Nov. 2011
Sales Volume and Gross Margin of CPIC's Glass Fibre, 2008-2012
Glass Fiber Capacity of Taishan Fiberglass Inc., 2005-2012
Operating Revenue and Total Profit of Taishan Fiberglass Inc., 2007-2009
Operating Revenue & Net Income of Jiangsu Jiu Ding New Material Co., Ltd, 2008-2011
Glass Fiber Capacity of Jiangsu Jiu Ding New Material Co., Ltd, 2008-2012
Operating Revenue & Net Income and YoY Growth of Jiangsu Jiu Ding New Material Co., Ltd, 2010-2013
Operation of Zhuhai Fuhua Composite Materials Co., Ltd, 2007-2008
Subsidiaries of Jiangxi Dahua Fiberglass Group Co., Ltd
Types and Capacities of Glass Fiber Products of Jiangxi Dahua Fiberglass Group Co., Ltd
Glass Fiber and Its Products of Jiangxi Dahua Fiberglass Group Co., Ltd
Operating Revenue and Total Profit of Qinhuangdao Fangyuan Glass Co., Ltd., 2007-2009
Operating Revenue and Total Profit of Shanghai Grace Fabric Co., Ltd., 2005-2008
Operating Revenue and Total Profit of Kingboard Fiber Glass Co., Ltd (Lianzhou), 2005-2009
如果这份报告不能满足您的要求,我们还可以为您定制报告,请 留言说明您的详细需求。
|