|
|
|
报告导航:研究报告—
TMT产业—TMT其他
|
|
2011-2012年中国智能交通系统研究报告 |
 |
字数:2.5万 |
页数:89 |
图表数:116 |
|
中文电子版:7500元 |
中文纸版:3750元 |
中文(电子+纸)版:8000元 |
|
英文电子版:1900美元 |
英文纸版:2000美元 |
英文(电子+纸)版:2200美元 |
|
编号:ZXU012
|
发布日期:2011-11 |
附件:下载 |
 |
|
|
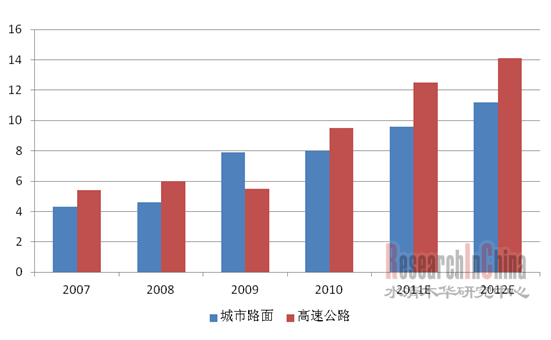
当前中国城镇化和汽车普及进程的加快,各大城市的交通供需矛盾不断加剧。中国城市人均道路面积远低于国外城市,仅为10.6平方米。与此同时,中国城市的机动车保有量正以15%的高速率增长,而城市道路的增长率仅为3%。智能交通成为提高道路使用效率、缓解交通供需矛盾的重要手段。 截至2011年,中国的一级城市全部制定了智慧城市的详细规划;80%以上的二级城市也明确提出了建设智慧城市的目标。中国各地对智能交通和智慧城市的建设投资力度逐步加大。当前智能交通投资更多集中在城市路面和高速公路领域。 中国的市级建制城市已达668个。预计2012年,中国城市道路ITS的总投资额将达到110亿元。新建高速公路中,智能交通系统投资占总投资的1%1.5%,预计2012年高速公路ITS投资将超过140亿元。 图:2007-2012中国城市路面和高速公路智能交通系统投资额及预测(单位:十亿元)
智能交通产业链包括设备提供商、内容提供商、系统集成商和平台服务商等。 随着城市智能交通大项目的比重逐年增加,智能交通系统平台集成商将较容易形成规模较大的全国性公司,从而成为整个智能交通产业的最大受益者。银江股份(300020.SZ)2011年上半年营收3.66亿元,同比增长39%;易华录(300212.SZ)2011年前三季度营收2.03亿元,同比增长39.02%;启明信息(002232.SZ)2011年上半年营收5.46亿元,同比增长28.60%。其它企业如川大智胜(002253.SZ)、宝信软件(600845.SH)、赛为智能(300044.SZ)、中海科技(002401.SZ)、皖通科技(002331.SZ)等均相比去年同期获得了15%-25%的营收增长。 水清木华研究中心《2011-2012年中国智能交通系统研究报告》主要内容包括:- 中国智能交通产业特点及相关政策
- 中国智能交通系统产业链及投资
- 中国智能交通系统整体市场研究及预测,包括建设规模、投资规模等
- 中国智能交通系统相关企业研究,包括运营情况、财务数据、市场布局、细分业务和2012年业绩预测等
As China accelerates the progress of urbanization and the popularization
of automobile, cities are suffering an increasingly serious traffic
crunch. The urban road surface area per capita of China is only 10.6 m2,
far less than foreign countries’. Meanwhile, the urban motor vehicle
ownership of China is growing at a rate of 15%, while the growth rate of
urban road is only 3%. Intelligent transportation has become an
important means to improve the efficiency of road use and ease the
traffic tension. As of 2011, all the first-tier Chinese cities
made detailed Smart City plans; over 80% of the second-tier cities
clearly stated goals of building Smart City. China is increasing the
investment in intelligent transportation and Smart City. At present, the
investment in intelligent transportation is more concentrated in urban
road and highway. There are 668 administrative cities in China.
It’s expected that the total investment in urban road intelligent
transportation system (ITS) will reach RMB 11 billion in 2012. ITS will
account for 1%-1.5% of the total investment in new highway construction,
and it’s expected that the investment in highway ITS will exceed RMB 14
billion in 2012. Investment in Urban Road and Highway ITS in China, 2007-2012E (Unit: RMB bn)
Intelligent
transportation industry chain includes equipment providers, content
providers, system integrators and platform service providers. As the
proportion of large projects in urban intelligent transportation
construction has increased year by year, it’s easier for ITS platform
integrators to form large-scale nationwide companies, becoming the
biggest beneficiaries of the entire intelligent transportation industry.
Enjoyor (300020.SZ) achieved operating revenue of RMB 366
million in H1 2011, up 39% year on year; E-Hualu (300212.SZ) achieved
operating revenue of RMB 203 million in Q1-Q3 2011, up 39.02% year on
year; Qiming Information (002232.SZ) achieved operating revenue of RMB
546 million in H1 2011, up 28.60% year on year. Other companies such as
Wisesoft (002253.SZ), Baosight Software (600845.SH), Sunwin Intelligent
(300044.SZ), China Shipping Network Technology (002401.SZ) and Wantong
Technology (002331.SZ) achieved 15%-25% year-on-year growth in the
operating revenue. China Intelligent Transportation System Industry Report 2011-2012 highlights: - China intelligent transportation industry characteristics and related policies
- China ITS industry chain and investment
- China ITS market research and forecast, including the scale of construction and investment
-
ITS related enterprises in China, including their operation, financial
data, market distribution, business and expected performance in 2012
第一章 中国智能交通系统概述
1.1 智能交通系统定义
1.2 智能交通伴随城市建设获得高速增长
1.3 中国智能交通相关政策
第二章 中国智能交通系统产业链及投资领域分析
2.1 智能交通系统产业链概述
2.2 智能交通系统投资领域分析
2.2.1 城市道路智能交通系统
2.2.2 城市轨道交通智能化系统
2.2.3 高速公路智能交通系统
2.3 智能交通系统领先企业优势明显
第三章 中国智能交通系统相关企业分析
3.1川大智胜
3.1.1 简介
3.1.2 财务分析
3.1.3 细分业务分析
3.1.4 2012年展望及业绩预测
3.2紫光股份
3.2.1 简介
3.2.2 财务分析
3.3银江股份
3.3.1 简介
3.3.2 财务分析
3.3.3 市场布局
3.3.4 细分业务分析
3.3.5 2012年展望及业绩预测
3.4易华录
3.4.1 简介
3.4.2 财务分析
3.4.3 市场布局
3.4.4 细分业务分析
3.4.5 2012年展望及业绩预测
3.5宝信软件
3.5.1 简介
3.5.2 财务分析
3.5.3 市场布局
3.5.4 细分业务分析
3.5.5 2012年展望及业绩预测
3.6赛为智能
3.6.1 简介
3.6.2 财务分析
3.6.3 市场布局
3.6.4 细分业务分析
3.6.5 2012年展望及业绩预测
3.7中海科技
3.7.1 简介
3.7.2 财务分析
3.7.3 市场布局
3.7.4 细分业务分析
3.7.5 2012年展望及业绩预测
3.8皖通科技
3.8.1 简介
3.8.2 财务分析
3.8.3 市场布局
3.8.4 细分业务分析
3.8.5 2012年展望及业绩预测
3.9 亿阳信通
3.9.1 简介
3.9.2 财务分析
3.9.3 细分业务分析
3.9.4 2012年展望及业绩预测
3.10 启明信息
3.10.1 简介
3.10.2 财务分析
3.10.3 市场布局
3.10.4 细分业务分析
3.10.5 未来展望及业绩预测
3.11天泽信息
3.11.1 简介
3.11.2 财务分析
3.11.3 市场布局
3.11.4 细分业务分析
3.11.5 2012年展望及业绩预测
3.12 中国智能交通
3.12.1 简介
3.12.2 财务分析
3.12.3 细分业务分析
3.12.4 2012年展望及业绩预测
第四章 中国智能交通系统发展趋势
1. Overview of ITS in China
1.1 Definition
1.2 Rapid Growth with Urban Development
1.3 Policy
2. ITS Industry Chain and Investment in China
2.1 Industry Chain
2.2 Investment Fields
2.2.1 Urban Road ITS
2.2.2 Urban Rail Transit ITS
2.2.3 Highway ITS
2.3 Leading ITS Enterprises Have Significant Advantages
3. Key ITS Enterprises in China
3.1 Wisesoft Co., Ltd.
3.1.1 Profile
3.1.2 Financial Analysis
3.1.3 Product and Business Analysis
3.1.4 Prospects and Performance Prediction in 2012
3.2 Unisplendour Co., Ltd.
3.2.1 Profile
3.2.2 Financial Analysis
3.3 Enjoyor Co., Ltd.
3.3.1 Profile
3.3.2 Financial Analysis
3.3.3 Revenue by Region
3.3.4 Product and Business Analysis
3.3.5 Prospects and Performance Prediction in 2012
3.4 E-Hualu Information Technology Co., Ltd.
3.4.1 Profile
3.4.2 Financial Analysis
3.4.3 Revenue by Region
3.4.4 Product and Business Analysis
3.4.5 Prospects and Performance Prediction in 2012
3.5 Shanghai Baosight Software Co., Ltd.
3.5.1 Profile
3.5.2 Financial Analysis
3.5.3 Revenue by Region
3.5.4 Product and Business Analysis
3.5.5 Prospects and Prediction in 2012
3.6 Shenzhen Sunwin Intelligent Co., Ltd.
3.6.1 Profile
3.6.2 Financial Analysis
3.6.3 Revenue by Region
3.6.4 Product and Business Analysis
3.6.5 Prospects and Prediction in 2012
3.7 China Shipping Network Technology Co., Ltd.
3.7.1 Profile
3.7.2 Financial Analysis
3.7.3 Revenue by Region
3.7.4 Product and Business Analysis
3.7.5 Prospects and Prediction in 2012
3.8 Anhui Wantong Technology Co., Ltd.
3.8.1 Profile
3.8.2 Financial Analysis
3.8.3 Revenue by Region
3.8.4 Product and Business Analysis
3.8.5 Prospects and Performance Prediction in 2012
3.9 Bright Oceans Inter-Telecom Co., Ltd.
3.9.1 Profile
3.9.2 Financial Analysis
3.9.3 Product and Business Analysis
3.9.4 Prospects and Performance Prediction in 2012
3.10 QiMing Information Technology Co., Ltd.
3.10.1 Profile
3.10.2 Financial Analysis
3.10.3 Revenue by Region
3.10.4 Product and Business Analysis
3.10.5 Prospects and Performance Prediction
3.11 Jiangsu Tianze Infoindustry Co., Ltd.
3.11.1 Profile
3.11.2 Financial Analysis
3.11.3 Revenue by Region
3.11.4 Product and Business Analysis
3.11.5 Prospects and Performance Prediction in 2012
3.12 China ITS (Holdings) Co., Ltd.
3.12.1 Profile
3.12.2 Financial Analysis
3.12.3 Product and Business Analysis
3.12.4 Prospects and Performance Prediction in 2012
4. Development Trend of ITS in China
表:智能交通九大子系统
图:中国主要城市通勤拥堵经济成本
图:2001-2010中国汽车保有量
图:2010-2015中国微车市场销量预测
表:2004-2010中国智能交通系统投资规模
表:2003-2011中国智能交通相关政策
表:2011-2020中国低空空域管理改革目标
表:中国智能交通系统产业链上市公司
图:中国智能交通投资总体构成
图:2007-2013中国城市路面智能交通系统投资额及预测
图:中国及全球部分城市轨道交通线网密度
图:2001-2012中国城市轨道交通运营里程数及预测
图:2001-2012中国城市轨道交通投资额及预测
图:轨道交通投资构成
图:机电工程投资构成
图:2001-2012中国高速公路智能交通系统投资额及预测
表:2006-2011川大智胜财务数据
图:2006-2011川大智胜主营收入和净利润
图:2006-2011川大智胜毛利率
表:2008-2011川大智胜分产品收入
表:2008-2011川大智胜分产品收入比例
表:2010-2012川大智胜财务数据预测
表:2010-2012川大智胜分产品收入预测
表:2006-2010紫光股份财务数据
图:2006-2010紫光股份主营收入和净利润
图:2006-2010紫光股份毛利率
表:2006-2011银江股份财务数据
表:2010H1、2011H1银江股份子公司财务数据
图:2006-2011银江股份主营收入和净利润
图:2006-2010银江股份毛利率
表:2011H1银江股份分地区收入
图:2011H1银江股份分地区收入比例
表:2008-2010银江股份分产品收入
图:2008-2010银江股份分产品收入比例
表:2011H1银江股份分产品财务数据
图:2011H1银江股份分产品收入比例
表:2010-2012银江股份财务数据预测
表:2010-2012银江股份分产品收入预测
表:2008-2011易华录财务数据
图:2008-2011易华录主营收入和净利润
图:2008-2011易华录毛利率
表:2008-2011易华录分地区收入
图:2011H1易华录分地区收入比例
表:2008-2011易华录分产品收入
图:2008-2011易华录分产品收入比例
表:2010-2012易华录财务数据预测
表:2010-2012易华录分产品收入预测
表:2006-2011宝信软件财务数据
图:2006-2011宝信软件主营收入和净利润
图:2006-2011宝信软件毛利率
表:2007-2011宝信软件分地区收入
表:2007-2011宝信软件分产品收入
图:2007-2011宝信软件分产品收入比例
表:2010-2012宝信软件财务数据预测
表:2010-2012宝信软件分产品收入预测
表:2006-2011赛为智能财务数据
图:2006-2011赛为智能主营收入和净利润
图:2006-2010赛为智能毛利率
表:2008-2011赛为智能分地区收入
图:2011H1赛为智能分地区收入比例
表:2007-2011赛为智能分产品收入
图:2007-2011赛为智能分产品收入比例
表:2010-2012赛为智能财务数据预测
表:2010-2012赛为智能分产品收入预测
表:2006-2011中海科技财务数据
图:2006-2011中海科技主营收入和净利润
图:2006-2010中海科技毛利率
表:2007-2011中海科技分地区收入
图:2011H1中海科技分地区收入比例
表:2010-2011中海科技分产品收入
图:2010-2011中海科技分产品收入比例
表:2010-2012中海科技财务数据预测
表:2010-2012中海科技分产品收入预测
表:2006-2011皖通科技财务数据
图:2006-2011皖通科技主营收入和净利润
图:2006-2011皖通科技毛利率
表:2007-2011皖通科技分地区收入
图:2011H1皖通科技分地区收入比例
表:2007-2011皖通科技分行业收入
图:2007-2011皖通科技分行业收入比例
表:2007-2011皖通科技分产品收入
图:2007-2011皖通科技分产品收入比例
表:2010-2012皖通科技财务数据预测
表:2010-2012皖通科技分行业收入预测
表:2006-2011亿阳信通财务数据
图:2006-2011亿阳信通主营收入和净利润
图:2006-2011亿阳信通毛利率
表:2007-2011亿阳信通分行业收入
图:2007-2011亿阳信通分行业收入比例
表:2010-2012亿阳信通财务数据预测
表:2010-2012亿阳信通分行业收入预测
表:2006-2011启明信息财务数据
图:2006-2011启明信息主营收入和净利润
图:2006-2011启明信息毛利率
表:2009-2010年启明信息子公司财务数据
表:2007-2011启明信息分地区收入
图:2011H1启明信息分地区收入比例
表:2008-2011启明信息分产品收入
图:2008-2011启明信息分产品收入比例
表:2015启明信息车载导航产品市场容量预测
表:2010-2012启明信息财务数据预测
表:2010-2012启明信息分产品收入预测
表:2008-2011天泽信息财务数据
图:2008-2011天泽信息主营收入和净利润
图:2008-2011天泽信息毛利率
表:2011H1天泽信息分地区收入
图:2011H1天泽信息分地区收入比例
表:2011H1天泽信息分产品财务数据
图:2011H1天泽信息分产品收入比例
表:2010-2012天泽信息财务数据预测
表:2009-2011中国智能交通财务数据
图:2009-2011中国智能交通主营收入和净利润
图:2009-2011中国智能交通毛利率
图:2009-2011中国智能交通分产品收入比例
表:2010-2012中国智能交通财务数据预测
表:2010-2015中国智能交通系统规模预测
Nine Subsystems of ITS
Economic Costs of Traffic Jam in Major Chinese Cities
Automobile Ownership in China, 2001-2010
Sales Volume of Minicar in China, 2010-2015
ITS Investment in China, 2004-2010
ITS-related Policies in China, 2003-2011
Target of Low-attitude Airspace Management Reform in China, 2011-2020E
Listed Companies in Chinese ITS Industry Chain
ITS Investment Composition in China
Urban Road ITS Investment in China, 2007-2013E
Density of Urban Rail Transit Network in China and Worldwide
Mileage of Urban Rail Transit in China, 2001-2012E
Urban Rail Transit Investment in China, 2001-2012E
Rail Transit Investment Composition
Electrical & Mechanical Investment Composition
Highway ITS Investment in China, 2001-2012E
Financial Data of Wisesoft, 2006-2011
Operating Revenue and Net Income of Wisesoft, 2006-2011
Gross Margin of Wisesoft, 2006-2011
Revenue of Wisesoft by Product, 2008-2011
Revenue Structure of Wisesoft by Product, 2008-2011
Financial Data of Wisesoft, 2010-2012E
Revenue of Wisesoft by Product, 2010-2012E
Financial Data of Unisplendour, 2006-2010
Operating Revenue and Net Income of Unisplendour, 2006-2010
Gross Margin of Unisplendour, 2006-2010
Financial Data of Enjoyor, 2006-2011
Financial Data of Enjoyor by Subsidiary, H1 2010- H1 2011
Operating Revenue and Net Income of Enjoyor, 2006-2011
Gross Margin of Enjoyor, 2006-2010
Revenue of Enjoyor by Region, H1 2011
Revenue Structure of Enjoyor by Region, H1 2011
Revenue of Enjoyor by Product, 2008-2010
Revenue Structure of Enjoyor by Product, 2008-2010
Financial Data of Enjoyor by Product, H1 2011
Revenue Structure of Enjoyor by Product, H1 2011
Financial Data of Enjoyor, 2010-2012E
Revenue of Enjoyor by Product, 2010-2012E
Financial Data of E-Hualu, 2008-2011
Operating Revenue and Net Income of E-Hualu, 2008-2011
Gross Margin of E-Hualu, 2008-2011
Revenue of E-Hualu by Region, 2008-2011
Revenue Structure of E-Hualu by Region, H1 2011
Revenue of E-Hualu by Product, 2008-2011
Revenue Structure of E-Hualu by Product, 2008-2011
Financial Data of E-Hualu, 2010-2012E
Revenue of E-Hualu by Product, 2010-2012E
Financial Data of Baosight, 2006-2011
Operating Revenue and Net Income of Baosight, 2006-2011
Gross Margin of Baosight, 2006-2011
Revenue of Baosight by Region, 2007-2011
Revenue of Baosight by Product, 2007-2011
Revenue Structure of Baosight by Product, 2007-2011
Financial Data of Baosight, 2010-2012E
Revenue of Baosight by Product, 2010-2012E
Financial Data of Sunwin, 2006-2011
Operating Revenue and Net Income of Sunwin, 2006-2011
Gross Margin of Sunwin, 2006-2011
Revenue of Sunwin by Region, 2008-2011
Revenue Structure of Sunwin by Region, H1 2011
Revenue of Sunwin by Product, 2007-2011
Revenue Structure of Sunwin by Product, 2007-2011
Financial Data of Sunwin, 2010-2012E
Revenue of Sunwin by Product, 2010-2012E
Financial Data of CSNT, 2006-2011
Operating Revenue and Net Income of CSNT, 2006-2011
Gross Margin of CSNT, 2006-2010
Revenue of CSNT by Region, 2007-2011
Revenue Structure of CSNT by Region, H1 2011
Revenue of CSNT by Product, 2010-2011
Revenue Structure of CSNT by Product, 2010-2011
Financial Data of CSNT, 2010-2012E
Revenue of CSNT by Product, 2010-2012E
Financial Data of Wantong, 2006-2011
Operating Revenue and Net Income of Wantong, 2006-2011
Gross Margin of Wantong, 2006-2010
Revenue of Wantong by Region, 2007-2011
Revenue Structure of Wantong by Region, H1 2011
Revenue of Wantong by Industry, 2007-2011
Revenue Structure of Wantong by Industry, 2007-2011
Revenue of Wantong by Product, 2007-2011
Revenue Structure of Wantong by Product, 2007-2011
Financial Data of Wantong, 2010-2012E
Revenue of Wantong by Industry, 2010-2012E
Financial Data of Bright Oceans Inter-Telecom, 2006-2011
Operating Revenue and Net Income of Bright Oceans Inter-Telecom, 2006-2011
Gross Margin of Bright Oceans Inter-Telecom, 2006-2011
Revenue of Bright Oceans Inter-Telecom by Industry, 2007-2011
Revenue Structure of Bright Oceans Inter-Telecom by Industry, 2007-2011
Financial Data of Bright Oceans Inter-Telecom, 2010-2012E
Revenue of Bright Oceans Inter-Telecom by Industry, 2010-2012E
Financial Data of QiMing Information, 2006-2011
Operating Revenue and Net Income of QiMing Information, 2006-2011
Gross Margin of QiMing Information, 2006-2011
Financial Data of QiMing Information by Subsidiary, 2009-2010
Revenue of QiMing Information by Region, 2007-2011
Revenue Structure of QiMing Information by Region, H1 2011
Revenue of QiMing Information by Product, 2008-2011
Revenue Structure of QiMing Information by Product, 2008-2011
Market Capacity of Car Navigation Products of QiMing Information, 2015E
Financial Data of QiMing Information, 2010-2012E
Revenue of QiMing Information by Product, 2010-2012E
Financial Data of Tianze Infoindustry, 2008-2011
Operating Revenue and Net Income of Tianze Infoindustry, 2008-2011
Gross Margin of Tianze Infoindustry, 2008-2011
Revenue of Tianze Infoindustry by Region, H1 2011
Revenue Structure of Tianze Infoindustry by Region, H1 2011
Financial Data of Tianze Infoindustry by Product, H1 2011
Revenue Structure of Tianze Infoindustry by Product, H1 2011
Financial Data of Tianze Infoindustry, 2010-2012E
Financial Data of China ITS (Holdings), 2009-2011
Operating Revenue and Net Income of China ITS (Holdings), 2009-2011
Gross Margin of China ITS (Holdings), 2009-2011
Revenue Structure of China ITS (Holdings) by Product, 2009-2011
Financial Data of China ITS (Holdings), 2010-2012E
Market Scale of ITS in China, 2010-2015E
如果这份报告不能满足您的要求,我们还可以为您定制报告,请 留言说明您的详细需求。
|