|
|
|
报告导航:研究报告—
制造业—化工
|
|
2011-2013年中国表面活性剂行业研究报告 |
 |
字数:3.0万 |
页数:79 |
图表数:76 |
|
中文电子版:7500元 |
中文纸版:3750元 |
中文(电子+纸)版:8000元 |
|
英文电子版:1800美元 |
英文纸版:1900美元 |
英文(电子+纸)版:2100美元 |
|
编号:HK007
|
发布日期:2011-12 |
附件:下载 |
 |
|
|
表面活性剂(Surfactant)主要应用于洗涤用品、化妆品、食品加工、纺织印染等领域。 近年来,中国表面活性剂行业在产量稳定增长的同时产品结构也在逐渐优化,但是部分特殊功能的高端品种仍然依赖于进口。2005-2010年,中国表面活性剂产量复合增长率为10.6%,2010年产量达到140.2万吨,同比增长10.8%。同期中国表面活性剂的表观消费量约为148.9万吨,进口量为31.1万吨,进口依存度达20.9%。 图:2006-2010年中国表面活性剂产量及同比增长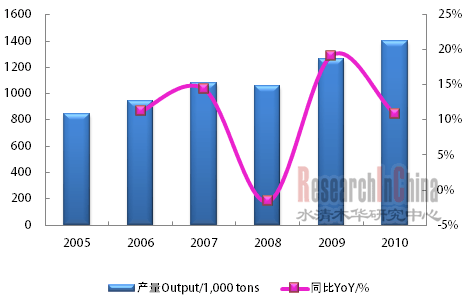 整理:水清木华研究中心 “十二五”期间(2011-2015),中国表面活性剂行业将致力于产业结构升级,高端表面活性剂产品依赖于进口的现状将得到缓解。预计2013年中国表面活性剂产量将达到186.1万吨,表观消费量将达到193.3万吨,供需缺口降低至7万吨左右。 根据原材料不同,表面活性剂可以分为天然油脂基表面活性剂和石油基表面活性剂。近年来,以LAS为代表的石油基表面活性剂因石油价格上涨、降解性差、安全性低等因素正逐步被AES、AEO、MES等天然油脂基表面活性剂替代。如中国LAS产量占表面活性剂总产量的比例由2005年的35.8%降低至2010年的29.8%,同期AES产量占比则由18.0%上升到22.5%。 MES是新一代绿色表面活性剂,具有廉价、高效、环保等优点,是最具发展潜力的表面活性剂品种。目前中国MES行业仍然处于发展初期,年产量不足万吨,随着产业化加速,未来几年中国MES产量将保持20%以上的增长速度。 2010年中国表面活性剂生产规模前5的企业分别为赞宇科技、中轻物产、湖南丽臣、南京佳和和沙索化学,五家企业表面活性剂销量之和达39.4万吨。其中赞宇科技是中国最大的AES表面活性剂生产商,目前MES产能为3万吨/年,二期3万吨/年产能也于2010年9月动工建设,预计2012年9月投产。
Surfactant is mainly applied in the fields of detergent products, cosmetics, food processing and textile printing and dyeing. In
recent years, along with the steady growth of surfactant output in
China, product mix of surfactant has been optimized. However, some of
high-end varieties with special functions still rely on import. With a
CAGR of 10.6% during 2005-2010, the output of surfactant registered
1.402 million tons in 2010, a 10.8% YoY rise. Meanwhile, its apparent
consumption and import volume hit about 1.489 million tons and 311,000
tons respectively, with import dependency of 20.9%. Output and Growth Rate of Surfactant in China, 2006-2010 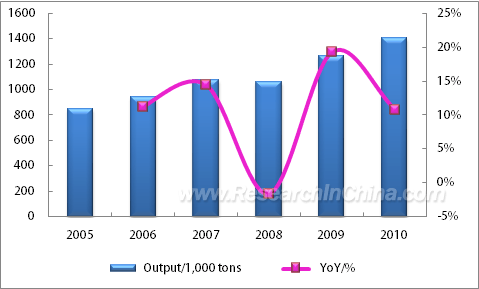 Source: ResearchInChina During
the 12th Five-Year Plan (2011-2015), Chinese surfactant industry will
focus on structural upgrading, which will reduce the high import
dependence of high-end surfactant products. It is expected that
surfactant output and apparent consumption will achieve 1.861 million
tons and 1.933 million tons respectively, with the supply and demand gap
down to around 70,000 tons. Surfactant can be classified into
natural oil-based surfactant and petroleum-based surfactant, according
to different raw materials. In recent years, petroleum-based surfactants
represented by LAS have been gradually replaced by natural oil-based
surfactants such as AES, AEO and MES, due to the price rise of
petroleum, poor degradability and low safety. In China, output
proportion of LAS in the total output dropped from 35.8% in 2005 to
29.8% in 2010, while that of AES increased from 18.0% to 22.5%. As
a new generation of green surfactant with the greatest development
potential, MES features low price, high efficiency and environmental
friendliness. Currently, MES industry is still in its infancy in China,
with annual output no more than 10,000 tons. Output of MES will maintain
the growth rate over 20% in China in the next few years, along with the
accelerated industrialization. In 2010, the top 5 surfactant
manufacturers by production scale in China included Zhejiang Zanyu
Technology Co., Ltd., Sinolight Chemicals Co., Ltd., Hunan Resun
Industrial Co., Ltd., Nanjing Jiahe Daily Chemical Co., Ltd. and Sasol
(China) Chemical Co., Ltd, of which the total sales volume amounted to
394,000 tons. Zhejiang Zanyu Technology Co., Ltd is the largest AES
surfactant producer in China. Currently, it owns the capacity of MES
30,000 t/a, and its 30,000 t/a MES capacity in the 2nd-stage project
started construction in September 2011 and is expected to put into
production in September 2012.
第一章 表面活性剂概述
1.1 定义
1.2 分类
1.3 工艺
1.4 产业链
第二章 全球表面活性剂行业分析
2.1 发展现状
2.2 竞争结构
2.3 主要企业
2.3.1 日本狮王
2.3.2 德国科宁
2.3.3 美国斯泰潘
第三章 中国表面活性剂行业分析
3.1 运行环境
3.2 发展现状
3.2.1 工业生产体系相对完整
3.2.2 产品结构逐步优化
3.2.3 行业集中度逐步提升
3.3 市场供给
3.4 市场需求
3.5 竞争格局
3.6 进出口
3.6.1 阴离子表面活性剂
3.6.2 阳离子表面活性剂
3.6.3 非离子表面活性剂
3.7 价格走势
3.8 发展趋势
3.8.1 绿色化趋势
3.8.2 行业分化加剧
3.8.3 新型绿色表面活性剂产业化加速
3.9 2011-2013年供需预测
第四章 中国表面活性剂细分产品分析
4.1 LAS
4.1.1 供需分析
4.1.2 竞争格局
4.2 AES
4.2.1 供需分析
4.2.2 竞争格局
4.3 AEO
4.3.1 供需分析
4.3.2 竞争格局
4.4 MES
4.4.1 产品优势
4.4.2 供需分析
4.4.3 发展前景
4.5 2011-2013年发展预测
第五章 中国表面活性剂上下游分析
5.1 上游供给分析
5.1.1 油脂化工业供给情况
5.1.2 石油化工业供给情况
5.1.3 发展趋势
5.2 下游需求分析
5.2.1 洗涤用品行业需求情况
5.2.2 化妆品行业需求情况
5.2.3 纺织行业需求情况
5.2.4 食品行业需求情况
5.2.5 其他行业需求情况
5.2.6 2011-2013年需求预测
第六章 中国表面活性剂主要生产企业
6.1 赞宇科技
6.1.1 公司介绍
6.1.2 经营分析
6.1.3 产销分析
6.1.4 子公司
6.1.5 2012-2013年发展预测
6.2 湖南丽臣
6.2.1 公司简介
6.2.2 经营分析
6.3 南京佳和
6.3.1 公司简介
6.3.2 经营分析
6.4 中轻化工
6.4.1 公司简介
6.4.2 经营分析
6.5 沙索(中国)
6.5.1 公司简介
6.5.2 经营分析
6.6 天津天智
6.6.1 公司简介
6.6.2 经营分析
6.7 三江化工
6.7.1 公司简介
6.7.2 经营分析
6.7.3 表面活性剂业务
6.8 辽宁华兴
6.8.1 公司简介
6.8.2 经营分析
6.9 广州浪奇
6.9.1 公司简介
6.9.2 经营分析
6.9.3 MES表面活性剂业务
6.9.4 2012年发展预测
1. Overview of Surfactant
1.1 Definition
1.2 Classification
1.3 Technology
1.4 Industry Chain
2. Global Surfactant Industry
2.1 Status Quo
2.2 Competition
2.3 Major Players
2.3.1 Lion
2.3.2 Cognis
2.3.3 Stepan
3. Chinese Surfactant Industry
3.1 Operating Environment
3.2 Current Development
3.2.1 Complete Industrial Production System
3.2.2 Optimized Product Mix
3.2.3 Enhanced Industry Concentration
3.3 Supply
3.4 Demand
3.5 Competition
3.6 Import & Export
3.6.1 Anionic Surfactant
3.6.2 Cationic Surfactant
3.6.3 Nonionic Surfactant
3.7 Price Trend
3.8 Development Trend
3.8.1 Greening Trend
3.8.2 Intensified Industry Differentiation
3.8.3 Accelerated Industrialization of New Green Surfactant
3.9 Supply & Demand in 2011-2013E
4. Market Segmentation
4.1 LAS
4.1.1 Supply & Demand
4.1.2 Competition Pattern
4.2 AES
4.2.1 Supply & Demand
4.2.2 Competition Pattern
4.3 AEO
4.3.1 Supply & Demand
4.3.2 Competition Pattern
4.4 MES
4.4.1 Advantages
4.4.2 Supply & Demand
4.4.3 Prospect
4.5 Development in 2011-2013E
5. Upstream and Downstream
5.1 Upstream
5.1.1 Supply of Oleochemical Industry
5.1.2 Supply of Petrochemical Industry
5.1.3 Development Trend
5.2 Downstream
5.2.1 Demand of Detergent Industry
5.2.2 Demand of Cosmetics Industry
5.2.3 Demand of Textile Industry
5.2.4 Demand of Food Industry
5.2.5 Demand of other Sectors
5.2.6 Demand in 2011-2013E
6. Key Manufacturers in Chinese Surfactant Industry
6.1 Zhejiang Zanyu Technology Co., Ltd.
6.1.1 Profile
6.1.2 Operation
6.1.3 Production and Sales
6.1.4 Subsidiaries
6.1.5 Development in 2012E-2013E
6.2 Hunan Resun Industrial Co., Ltd.
6.2.1 Profile
6.2.2 Operation
6.3 Nanjing Jiahe Daily Chemical Co., Ltd.
6.3.1 Profile
6.3.2 Operation
6.4 Sinolight Chemicals Co., Ltd.
6.4.1 Profile
6.4.2 Operation
6.5 Sasol (China) Chemical Co., Ltd.
6.5.1 Profile
6.5.2 Operation
6.6 Tianjin Tianzhi Fine Chemical Co., Ltd.
6.6.1 Profile
6.6.2 Operation
6.7 China Sanjiang Fine Chemicals Company Limited
6.7.1 Profile
6.7.2 Operation
6.7.3 Surfactant Business
6.8 Liaoning Huaxing Group Chemical Co., Ltd.
6.8.1 Profile
6.8.2 Operation
6.9 Lonkey Industrial Co. Ltd., Guangzhou
6.9.1 Profile
6.9.2 Operation
6.9.3 MES Business
6.9.4 Development in 2012E
表:表面活性剂按电离特性的分类及特点
表:表面活性剂按原材料的分类及主要产品
图:表面活性剂主要产品工业关系
图:表面活性剂产业链
图:2006-2011年美国斯泰潘净销售额和营业利润
图:2008-2011年美国斯泰潘主营产品净销售额占比
图:2005-2011年美国斯泰潘表面活性剂业务净销售额及同比增长
表:表面活性剂相关政策
图:2006-2010年中国表面活性剂产量及同比增长
表:2009年中国表面活性剂细分产品产量及占比
图:2006-2010年中国表面活性剂表观消费量及同比增长
表:2008-2010年中国主要表面活性剂生产企业销售量
图:2010年中国合成洗涤剂产量区域分布
图:2006-2011年前三季度中国表面活性剂进出口量
图:2006-2011年前三季度中国表面活性剂进出口单价
图:2006-2011年前三季度中国阴离子表面活性剂进出口量
图:2006-2011年前三季度中国阴离子表面活性剂进出口单价
图:2006-2011年前三季度中国阳离子表面活性剂进出口量
图:2006-2011年前三季度中国阳离子表面活性剂进出口单价
图:2006-2011年前三季度中国非离子表面活性剂进出口量
图:2006-2011年前三季度中国非离子表面活性剂进出口单价
图:2008-2011H1中国部分表面活性剂产品价格
表:2011-2013年中国表面活性剂供需预测
图:2010年中国表面活性剂主要产品产量占比
图:2005-2010年中国LAS产量及其占比
图:2010年中国主要LAS生产企业销量
图:2005-2010年中国AES产量及其占比
图:2009年中国醇系阴离子表面活性剂主要生产企业产量占比
图:2005-2010年中国AEO产量及其占比
图:2009年中国AEO主要生产商市场份额(按产量)
表:MES与LAS性能比较
图:LAS与MES的生物降解速度对比
表:2010年中国已建和在建MES项目
图:2005-2013E年中国主要表面活性剂产品发展趋势(按产量占比)
图:2008-2011年中国天然油脂和脂肪醇平均价格
图:2000-2010年中国石油产量及消费量
图:2005-2011年国际石油及石脑油价格走势
图:2010年中国表面活性剂下游需求结构
图:2001-2011年中国合成洗涤剂产量及同比增长率
图:2001-2011年中国化妆品零售额及同比增长
图:2001-2011年中国印染布产量及同比增长
图:2001-2011年中国食品行业零售额及同比增长
图:2010-2013E中国表面活性剂需求结构预测
表:赞宇科技表面活性剂产品种类
图:2008-2011H1赞宇科技营业收入及利润总额
表:2008-2011H1赞宇科技主营产品营业收入占比
表:2008-2011H1赞宇科技毛利贡献比例
表:2008-2011H1赞宇科技主要产品毛利率
表:2008-2011H1赞宇科技(分地区)营业收入
图:2008-2011H1赞宇科技表面活性剂产销情况
图:2008-2011H1赞宇科技AES(70%)产量、销量和产销率
图:2008-2011H1赞宇科技AOS(35%)产量、销量及产销率
图:2008-2011H1赞宇科技MES产量、销量和产销率
表:赞宇科技表面活性剂业务子公司
图:2010-2011H1赞宇科技子公司营业收入
图:2008-2010年赞宇科技研发投入及其占比
表:2011-2013年赞宇科技营业收入和毛利预测
图:2007-2009年湖南丽臣主营业务收入、利润总额及毛利率
图:2007-2009年佳和日化主营业务收入、利润总额及毛利率
表:中轻化工主要表面活性剂产品
图:2008-2009年中轻物产(绍兴)主营业务收入、利润总额及毛利率
图:2007-2009年沙索(中国)主营业务收入、利润总额及毛利率
图:2007-2009年天津天智主营业务收入、利润总额及毛利率
图:2009-2011H1三江化工收入和毛利
图:2009-2011H1三江化工(分产品)收入
表:三江化工表面活性剂发展历程
表:三江化工主要表面活性剂产品及应用
图:2009-2011H1三江化工表面活性剂销售量及同比增长
图:2009-2011H1三江化工表面活性剂平均售价
表:辽宁华兴主要表面活性剂产品
图:2008-2009年辽宁华兴主营业务收入、利润总额及毛利率
图:2008-2011年三季度广州浪奇营业收入及利润总额
图:2008-2011H1广州浪奇(分产品)营业收入
图:2008-2011H1广州浪奇主营业务毛利率
图:2008-2011H1广州浪奇(分地区)营业收入
图:2011-2012年广州浪奇盈利预测
Classification and Characteristic of Surfactants by Ionization
Classification and Main Products of Surfactants by Raw Materials
Industrial Relation among Main Products of Surfactant
Surfactant Industry Chain
Net Sales and Operating Income of Stepan, 2006-2011
Net Sales Breakdown of Stepan by Product, 2008-2011
Net Sales and Growth Rate of Stepan’s Surfactant Business, 2005-2011
Policies on Surfactant
Output and Growth Rate of Surfactant in China, 2006-2010
Output and Proportion of Surfactant Segmented Products in China, 2009
Apparent Consumption and YoY Growth of Surfactant in China, 2006-2010
Surfactant Sales Volume of Major Manufacturers in China, 2008-2010
Output of Synthetic Detergents (by Region) in China, 2010
Import and Export Volume of Surfactant in China, 2006- Jan.-Sept. 2011
Import and Export Price of Surfactant in China, 2006- Jan.-Sept. 2011
Import and Export Volume of Anionic Surfactant in China, 2006- Jan.-Sept. 2011
Import and Export Price of Anionic Surfactant in China, 2006- Jan.-Sept. 2011
Import and Export Volume of Cationic Surfactant in China, 2006- Jan.-Sept. 2011
Import and Export Price of Cationic Surfactant in China, 2006- Jan.-Sept. 2011
Import and Export Volume of Nonionic Surfactant in China, 2006- Jan.-Sept. 2011
Import and Export Price of Nonionic Surfactant in China, 2006- Jan.-Sept. 2011
Prices of Some Surfactant Products in China, 2008- 2011H1
Supply and Demand of Surfactant in China, 2011-2013E
Output Proportion of Main Surfactant Products in China, 2010
Output and Proportion of LAS in China, 2005-2010
LAS Sales Volume of Major Manufacturers in China, 2010
Output and Proportion of AES in China, 2005-2010
Major Manufacturers and Their Output Proportions of Alcoholic Anionic Surfactant in China, 2009
Output and Proportion of AEO in China, 2005-2010
Market Share of Main Manufacturers of AEO in China by Output, 2009
Performance of MES and LAS
Biodegradation Rate of MES and LAS
MES Projects Built and under Construction in China, 2010
Development Trend of Major Surfactant Products (by Output Proportion) in China, 2005-2013E
Average Price of Natural Oil and Aliphatic Alcohol in China, 2008-2011
Output and Consumption of Petroleum in China, 2000-2010
Price of Global Petroleum and Naphtha, 2005-2011
Demand Breakdown of Surfactant in China, 2010
Output and YoY Growth of Synthetic Detergent in China, 2001-2011
Retail Sales and YoY Growth of Cosmetics in China, 2001-2011
Output and YoY Growth of Printing and Dyeing Cloth in China, 2001-2011
Retail Sales and YoY Growth of Food Industry in China, 2001-2011
Demand Breakdown of Surfactant in China, 2010-2013E
Surfactant Categories of Zhejiang Zanyu Technology
Operating Revenue and Total Profit of Zhejiang Zanyu Technology, 2008-H1 2011
Operating Revenue Breakdown of Zhejiang Zanyu Technology by Product, 2008-H1 2011
Gross Profit Breakdown of Zhejiang Zanyu Technology by Product, 2008-H1 2011
Main Products’ Gross Margin of Zhejiang Zanyu Technology, 2008-H1 2011
Operating Revenue of Zhejiang Zanyu Technology by Region, 2008-H1 2011
Production and Sales of Zhejiang Zanyu Technology’s Surfactant Business, 2008-H1 2011
Output and Sales Volume of Zhejiang Zanyu Technology’s AES (70%), 2008-H1 2011
Output and Sales Volume of Zhejiang Zanyu Technology’s AOS (35%), 2008-H1 2011
Output and Sales Volume of Zhejiang Zanyu Technology’s MES, 2008-H1 2011
Subsidiaries Engaged in Surfactant of Zhejiang Zanyu Technology
Operating Revenue of Zhejiang Zanyu Technology’s Subsidiaries, 2010-H1 2011
Expenditure in R&D and Proportion of Zhejiang Zanyu Technology, 2018-2010
Operating Revenue and Gross Profit of Zhejiang Zanyu Technology, 2011-2013E
Operating Revenue, Total Profit and Gross Margin of Hunan Resun Industrial, 2007-2009
Operating Revenue, Total Profit and Gross Margin of Nanjing Jiahe Daily Chemical, 2007-2009
Major Surfactant Products of Sinolight Chemicals
Operating Revenue, Total Profit and Gross Margin of Sinolight Chemicals (Shaoxing), 2007-2009
Operating Revenue, Total Profit and Gross Margin of Sasol (China) Chemical, 2007-2009
Operating Revenue, Total Profit and Gross Margin of Tianjin Tianzhi Fine Chemical, 2007-2009
Revenue and Gross Profit of China Sanjiang Fine Chemicals, 2009-H1 2011
Revenue of China Sanjiang Fine Chemicals by Product, 2009-H1 2011
Surfactant Development History of China Sanjiang Fine Chemicals
Main Surfactant Products and Their Applications of China Sanjiang Fine Chemicals
Sales Volume and YoY Growth of China Sanjiang Fine Chemicals’ Surfactant, 2009-H1 2011
ASP of Surfactant Produced by China Sanjiang Fine Chemicals, 2009-H1 2011
Major Surfactant Products of Liaoning Huaxing Group
Operating Revenue, Total Profit and Gross Margin of Liaoning Huaxing Group, 2008-2009
Operating Revenue and Total Profit of Guangzhou Lonkey Industrial, 2008- Jan.-Sept. 2011
Operating Revenue of Guangzhou Lonkey Industrial by Product, 2008- Jan.-Sept. 2011
Gross Margin of Guangzhou Lonkey Industrial’s Main Businesses, 2008- Jan.-Sept. 2011
Operating Revenue of Guangzhou Lonkey Industrial by Region, 2008- Jan.-Sept. 2011
Profit of Guangzhou Lonkey Industrial, 2011-2012E
如果这份报告不能满足您的要求,我们还可以为您定制报告,请 留言说明您的详细需求。
|