留言
报告导航:研究报告制造业能源矿产
2011年全球及中国钽行业研究报告
字数:1.7万 页数:52 图表数:52
中文电子版:5000元 中文纸版:2500元 中文(电子+纸)版:5500元
英文电子版:1500美元 英文纸版:1600美元 英文(电子+纸)版:1800美元
编号:LMX010 发布日期:2012-04 附件:下载
  钽作为小金属的一种,应用领域非常广泛,电容器是钽主要的应用领域,全球约一半的钽用在电容器中。

《2011年全球及中国钽行业研究报告》主要从以下几个方面研究整个钽行业的发展状况:
● 全球钽矿储量、产量、价格及在建/扩建项目情况;
● 中国钽行业发展现状、进出口、价格及重点应用领域分析;
● 中国钽电容器市场及下游消费领域分析;
● 全球2家重点钽生产企业以及7家主要国内钽及钽矿生产企业分析。

  2010年全球钽矿产量805吨,巴西是最大的钽矿生产国,产量占比22.4%。中国的钽精矿产量较小,仅占全球总产量的8%左右,中国消耗的钽原料80%依赖进口,因此国内钽加工厂商多数受制于海外原料供给的不确定性。

  东方钽业,作为全球主要的钽生产商之一,电容器级钽粉的全球市场占有率25%以上,电容器用钽丝全球市场占有率60%以上。公司钽原料的对外依存度非常高,除了参股20%的福建南平钽铌矿,其余基本依靠外购。东方钽业在国内与最大矿山江西宜春钽铌长期合作,国外与南美大型钽铌矿山签订长期合同为主,非洲小规模钽铌矿山的现货供应为补充。

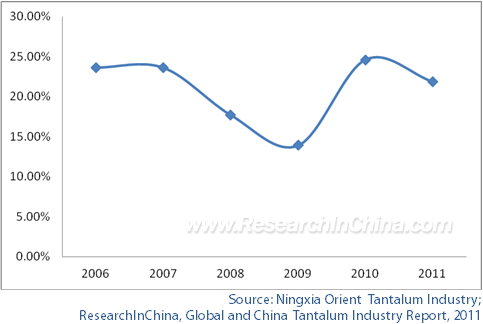
  总体来讲,东方钽业原料来源基本有保障,但是由于本身没有矿山,成本难以控制,原料下跌时需要承受较大跌价风险,譬如2009年公司钽制品的毛利率仅13.9%。

图:2006-2011年东方钽业钽制品毛利率
20120405.gif

  目前,产业链优势比较突出的是澳大利亚的GAM公司,公司主要从事钽矿的开采,2011年8月宣布收购全球钽冶炼领域的龙头企业美国Cabot公司的钽加工厂。

  本报告在重点分析全球及中国钽矿储量及重点企业的同时,也对中国钽电解电容器行业进行了分析。钽电解电容器是非常重要的电子元件,主要应用在手机(35%)、数码相机(34%)、笔记本电脑(16%)上。电子产品更新换代周期短的特点将会刺激钽电容器的消费。

As a kind of minor metal, tantalum finds very wide application. About half of the world’s tantalum resources are applied in capacitor.

The report highlights the following aspects:

20120114.gif reserves, output and price of tantalum ore worldwide; ongoing and expansion projects;

20120114.gif status quo of China tantalum industry, import & export, price and key applications;

20120114.gif Chinese tantalum capacitor market and downstream consumption filed;

20120114.gif two world’s leading tantalum manufacturers and seven major China-based tantalum and ore producers;

In 2010, the global output of tantalum ores reached 805 tons. In particular, the output of Brazil, as the world’s largest tantalum ore producer, accounted for 22.4% of the world’s total; while China had low output of tantalum concentrates, making up no more than 8% of the global total. As China imports 80% tantalum raw materials to meet its consumption, domestic tantalum processing businesses are mostly restricted by the uncertainty of raw material supply from overseas market.   

For Ningxia Orient Tantalum Industry, as one of the leading tantalum manufacturers in the world, the global market occupancy of capacitor-grade tantalum powder exceeds 25%, while that of capacitor tantalum wire surpasses 60%. Ningxia Orient Tantalum Industry is almost fully reliant on the external purchase to meet its demand for tantalum raw materials, if the 20% contributed by the joint-stock project Ta-Nb mine in Nanping, Fujian province is excluded. Ningxia Orient Tantalum Industry establishes long-term cooperative relationship with Yichun Tantalum & Niobium Mine, the largest mine in China; also, it inked long-term deal with the large Ta-Nb mine in South America, and with Africa-based small-sized Ta-Nb mine as supplement of spot supplies.

Generally speaking, the raw material source of Ningxia Orient Tantalum Industry can be primarily guaranteed. However, due to the fact that the company doesn’t possess its own mines, it is hard to keep the cost under control. As a result, it was forced to bear high risk in case of the short supply of raw materials. For example, the gross margin from the tantalum product business of the company in 2009 was just 13.9%.   

Gross Margin of Tantalum Products of Ningxia Orient Tantalum Industry, 2006-2011
 
20120407.gif

Presently, the Australia-based GAM features more competitive industry chain. GAM involving in the exploitation of tantalum ore announced in August 2011 to take over the tantalum processing plant under America-based Cabot, an international tycoon in the tantalum smelting field.   

The report sheds lights on the tantalum ore reserves and key companies in China and beyond. Also it analyzes the tantalum electrolytic capacitor industry of China. As a very important component, tantalum electrolytic capacitor is commonly used in mobile phone (35%), digital camera (34%) and notebook computer (16%). The short renewal cycle of electronic products is bound to spur the consumption of tantalum capacitor.
第一章 钽行业概述
1.1 定义及用途
1.2 产业链

第二章 全球钽行业发展状况
2.1 全球钽矿储量
2.2 全球钽矿产量
2.3 全球钽矿价格走势
2.4 全球钽矿在建/扩建项目

第三章 中国钽行业发展状况
3.1 发展现状
3.2 需求分析
3.2.1 电子行业
3.2.2移动互联网、物联网
3.2.3 机械化、自动化、智能化
3.2.4 航空航天业
3.3 进出口分析
3.4 价格分析
3.5 2011-2012年行业动态

第四章 中国钽电容器行业发展状况
4.1 钽电容器介绍
4.2 市场发展状况
4.3 下游消费领域分析
4.3.1 手机
4.3.2 数码相机
4.3.3 笔记本电脑
4.3.4 其他新兴领域

第五章 全球及中国钽行业重点企业
5.1 GAM
5.1.1 公司简介
5.1.2 主要产品
5.1.3 经营状况
5.1.4 收购Cabot钽加工厂
5.2 HCStarck
5.2.1 公司简介
5.2.2 经营状况
5.2.3 原料供应
5.2.4 2012年发展规划
5.2.5 在华发展
5.3 东方钽业
5.3.1 公司简介
5.3.2 经营状况
5.3.3 原料采购
5.3.4 产品产能
5.3.5 主要项目
5.3.6 发展战略
5.4株洲硬质合金集团有限公司
5.4.1 公司简介
5.4.2 经营状况
5.4.3 发展规划
5.5江西景泰钽业有限公司
5.6长沙南方钽铌有限责任公司
5.6.1 公司简介
5.6.2 经营状况
5.7九江益中有色金属有限公司
5.8 闵宁钽铌矿
5.9宜春钽铌矿

1 Tantalum Industry Overview
1.1 Definition & Classification
1.2 Industry Chain

2 Global Tantalum Industry Development
2.1 Reserves & Distribution
2.2 Output & Distribution
2.3 Price
2.4 Projects

3 Tantalum Industry Development in China
3.1 Status Quo
3.2 Application Field
3.2.1 Electronics Industry
3.2.2 Mobile Internet & the Internet of Things
3.2.3 Mechanization, Automation & Intelligence
3.2.4 Aerospace Industry
3.3 Import & Export
3.4 Price
3.5 Events in 2011-2012

4 Tantalum Capacitor Industry Development in China
4.1 Profile of Tantalum Capacitor
4.2 Market Development
4.3 Downstream Consumer
4.3.1 Mobile Phone
4.3.2 Digital Camera
4.3.3 Notebook Computer
4.3.4 Other New Fields

5 Key Companies in China and the World
5.1 GAM
5.1.1 Profile
5.1.2 Products
5.1.3 Operation
5.1.4 Acquisition on Cabot Corp.’s Supermetals business
5.2 HCStarck
5.2.1 Profile
5.2.2 Operation
5.2.3 Supply of Raw Materials
5.2.4 Development Plan in 2012
5.2.5 Development in China
5.3 Ningxia Orient Tantalum Industry Co., Ltd
5.3.1 Profile
5.3.2 Operation
5.3.3 Supply of Raw Materials
5.3.4 Product Capacity
5.3.5 Projects
5.3.6 Strategy
5.4 Zhuzhou Cemented Carbide Group Co., Ltd
5.4.1 Profile
5.4.2 Operation
5.4.3 Development Plan
5.5 KING-TAN Tantalum Industry Ltd
5.6 Changsha South Tantalum Niobium Co., Ltd
5.6.1 Profile
5.6.2 Operation
5.7 Jiujiang Yizhong Non-Ferrous Co., Ltd
5.8 Minning Tantalum & Niobium Mining Development Co.,Ltd
5.9 YiChun Tantalum & Niobium Mine
表:钽粉、钽丝实物图
表:钽的主要用途分类
图:钽加工行业产业链
图:钽上下游产业链
图:全球钽储量分布
图:全球钽原料供给结构
图:全球钽矿产量分布
图:2000-2010年全球钽矿产量
图:2008-2012年全球钽铁矿(30-35%)价格走势
表:全球主要在建/扩建的钽铌矿山
图:钽的主要应用领域
图:全球钽制品市场格局
图:全球主要企业钽粉生产能力
图:2008-2011年前11月中国半导体分立器件制造行业主营业务收入与利润总额
图:全球钽精矿价格走势与互联网的发展阶段
图:中国卫星发射颗数
图:2011-2012年中国钽铌矿进口量
图:2012年1月中国钽铌矿进口量(分国别)
图:2011-2012年中国锻轧钽月出口量
图:2011-2012年中国国内市场氧化钽价格
图:2011-2012年中国国内市场钽锭价格
表:各种电容器优缺点对比
表:钽电容器的主要应用领域
图:中国市场各种电容器的市场份额(按产值)
图:钽电容器和MLCC性能对比
图:2008-2010年中国钽电解电容器产量
图:钽电容器下游用途结构
图:2005-2011年中国手机产量
图:2005-2011年中国数码相机产量
图:2008-2011年中国笔记本电脑产量
图:GAM 公司Capacitor Powders产品
图:GAM公司Global Operations
图:2009-2011年HCStarck公司销售收入
图:2011年HCStarck公司员工人数结构
表:HCStarck公司在华主要企业情况
图:东方钽业业务组织结构
图:2008-2011年东方钽业营业收入和净利润)
图:2009-2011年东方钽业营业收入(分产品)构成
图:2009-2011年东方钽业营业收入(分区域)构成
表:东方钽业主要钽矿石供应矿山
图:东方钽业原料及市场分布
图:2006-2011年东方钽业钽制品毛利率
表:东方钽业主要产品产能
表:东方钽业配股募集资金主要投向
表:2010-2011年湖南有色金属股份有限公司钽铌及其化合物销售情况
表:江西景泰钽业有限公司主要产品及产能
表:南方钽铌主要钽制品
图:2010-2011年上半年南方钽铌销售收入
图:2010-2011年上半年南方钽铌出口创汇
图:九江益中有色金属有限公司国内市场营销网络
图:九江益中有色金属有限公司国际市场营销网络
表:2008-2011年闵宁钽铌矿主营业务收入与利润总额

Tantalum Powder & Tantalum Wire
Classification of Tantalum Applications
Tantalum Processing Industry Chain
Upstream & Downstream of Tantalum Industry Chain
Tantalum Reserves & Distribution Worldwide
Supply Structure of Tantalum Raw Materials
Global Tantalum Ore Output Distribution
Global Tantalum Ore Output, 2000-2010
Global Tantalite (30-35%) Price Trend, 2008-2012
Main Projects of Tantalum and Niobium Mines Worldwide
Applications of Tantalum
Global Tantalum Market Pattern
Tantalum Powder Capacity of Key Companies Worldwide
Operating Revenue & Total Profit of China's Semiconductor Discrete Device Manufacturing Industry, 008- Jan-Nov. 22011
Price Trend of Tantalum Concentrates Worldwide and Development Stages of the Internet
Number of Satellites Launched in China
China’s Import Volume of Tantalum and Niobium Ores, 2011-2012
China’s Import Volume of Tantalum & Niobium Ores, Jan. 2012 (by Country)
Monthly Export Volume of Wrought Tantalum in China, 2011-2012
Tantalum Oxide (≥99.95%) Price Trend in China, 2011-2012
Tantalum Ingot (≥99.95%)Price Trend in China, 2011-2012
Performance Comparison among Various Capacitors
Main Applications of Tantalum Capacitor
Capacitor Market Shares in China (by Output Value)
Performance Comparison between Tantalum Capacitor and MLCC
Tantalum Electrolytic Capacitor Output in China, 2008-2012
Consumption Structure of Tantalum Capacitor
Mobile Phone Output in China, 2005-2011
Digital Camera Output in China, 2005-2011
Notebook Computer Output in China, 2008-2011
Capacitor Powders of GAM
Global Operations of GAM
Sales of HCStarc, 2009-2011
Employees of HCStarck, 2011 (by Region)
HCStarck’s Subsidiaries in China
Business Structure of Orient Tantalum
Operating Revenue & Net Income of Orient Tantalum, 2008-2011
Operating Revenue of Orient Tantalum, 2009-2011 (by Product)
Operating Revenue of Orient Tantalum, 2009-2011 (by Region)
Tantalum Ore Suppliers of Orient Tantalum
Raw Materials & Product Sales Distribution of Orient Tantalum
Gross Margin of Orient Tantalum, 2006-2011
Product Capacity of Orient Tantalum
Main Investments with Raised Funds of Orient Tantalum
Sales of Tantalum and Niobium & its Compounds of Hunan Nonferrous Metals Corp., Lt, 2010-2011
Product Capacity of KING-TAN Tantalum Industry Ltd
Tantalum Products of South Tantalum Niobium
Sales of South Tantalum Niobium, 2010- H1 2011
Export Value of South Tantalum Niobium, 2010- H1 2011
Marketing Network of Jiujiang Yizhong Non-Ferrous in China
Marketing Network of Jiujiang Yizhong Non-Ferrous in the World
Operating Revenue & Total Profit of Minning Tantalum Niobium Mining, 2008-2011
    如果这份报告不能满足您的要求,我们还可以为您定制报告,请留言说明您的详细需求。

2005-2010 www.pday.com.cn 版权所有
在线客服系统