|
|
|
报告导航:研究报告—
TMT产业—电子半导体
|
|
2011-2012年全球及中国半导体设备行业研究报告 |
 |
字数:1.6万 |
页数:121 |
图表数:155 |
|
中文电子版:8500元 |
中文纸版:4250元 |
中文(电子+纸)版:9000元 |
|
英文电子版:2200美元 |
英文纸版:2300美元 |
英文(电子+纸)版:2500美元 |
|
编号:ZYW106
|
发布日期:2012-04 |
附件:下载 |
 |
|
|
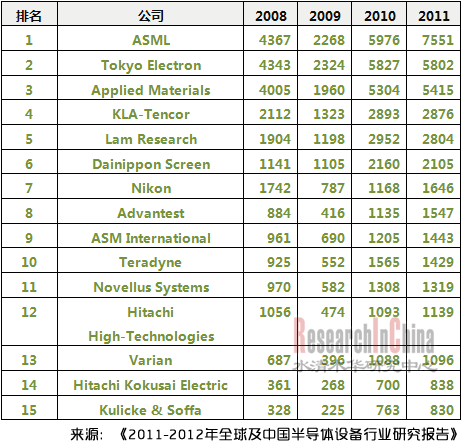
2011年半导体厂家资本支出(CAPEX)大约658亿美元,比2010年增加了14.3%,其中设备支出大约440亿美元,比2010年增加8.0%。预计2012年设备支出大约389亿美元,其中晶圆厂(Wafer Fab)设备313亿美元,比2011年均有所下滑。主要原因是2010年晶圆厂设备支出比2009年增长了127.1%,2011年又增长了13.3%,2012年出现下滑是正常的。 2012年资本支出超过50亿美元的仍然是英特尔、三星电子和台积电这三家。英特尔为建设全球第一座量产14nm 晶圆厂Fab 42 投资超过50亿美元,还有一座试验开发性质的14nm 晶圆厂D1X,英特尔继续引领半导体产业向20纳米以下发展,同时也再次确认英特尔在半导体制造领域无可撼动的霸主地位。 三星电子则计划支出134亿美元,是全球半导体领域资本支出最高的厂家,其中40%投入DRAM和NAND内存领域,其中包括引人瞩目的中国西安NAND工厂。三星大约50%投入System LSI领域,主要包括晶圆代工和AP业务。苹果的A5是其主要代工产品,预计A6 也会是三星代工。因为无论是A5 还是A6 ,与三星自己的AP都非常近似,苹果担心委托其他晶圆代工有技术泄露的危险,而给三星则不用担心这个问题。为了获得苹果的认同,A5和A6 将在美国本土的S1厂生产,三星将投资10亿美元大幅度扩展S1 厂的产能。 台积电的28纳米工艺是全球仅次于英特尔的最先进的半导体生产工艺,客户愿意提前现金下单,订单已经排到2012年年底。台积电原本预计2012年资本支出60亿美元,不过近期台积电已经表明,可能提高资本支出到70亿美元以缓解产能紧张。 半导体设备领域是一个高度集中的领域,细分领域第一名的市场占有率往往超过50%,甚至90%,如CMP (chemical vapor deposition)领域,Applied Material的市场占有率为93%。PVD(physical vapor deposition or sputtering)领域,Applied Material的市场占有率为83%。即便是行业第二名都可能无法长久存活,这也促使设备行业并购不断。2010年11月,应用材料(Applied Materials)以49亿美元,正式完成收购Varian Semiconductor Equipment Associates。应用材料此举主要是加强离子植入ion implantation领域的竞争力。 2011年底, Lam Research以大约33亿美元的股票交易方式收购诺发系统公司(Novellus Systems)。Lam Research在蚀刻Etch市场占据55%的市场份额,Novellus则在ECD占有80%的市场份额。两家联合主要是为客户提供更完整的产品线。2011年4月,日本Advantest收购了新加坡Verigy,大大拓展了SoC测试领域。Teradyne 则在2011年10月收购了LitePoint进入无线产品测试领域。 2008-2011年TOP 15半导体设备厂家收入排名(单位:百万美元)
In 2011, the CAPEX of semiconductor industry were about USD65.8 billion,
up 14.3% compared with that in 2010, among which, the CAPEX on
equipment stood at about USD44 billion, with a year-on-year increase of
8.0%. It’s estimated that, in 2012, the CAPEX on equipment will reach
USD38.9 billion, among which, the expenditure on wafer fab equipment
will be USD31.3 billion, a decrease compared with that in 2011. A main
reason is that the CAPEX on wafer fab equipment in 2010 increased by
127.1% compared with that in 2009 and continued to grow by 13.3% in
2011, therefore, its drop in 2012 is normal. In 2012, the
semiconductor companies CAPEX over USD5 billion will still be Intel,
Samsung Electronics and TSMC. Intel invested over USD5 billion to build
Fab 42, the world’s first fab engaged in the mass production of 14nm
node. In addition, it invested in D1X, a R&D fab for 14nm node
process. Intel will continue to lead the semiconductor industry. Samsung
Electronics plans to spend USD13.4 billion, which is the highest CAPEX
in the global semiconductor market. 40% of the CAPEX will be invested in
DRAM and NAND memory, including the well-known NAND factory in Xi’an,
China. About 50% of the CAPEX will be invested in System LSI, mainly
including foundry and AP business. Apple A5 is its major foundry
product, so will be A6. Both A5 and A6 are very similar to Samsung’s AP,
so there is no risk of technology leakage for Apple to choose Samsung
as its foundry. In order to get recognition from Apple, Samsung will
produce A5 and A6 in the U.S.-based S1 factory, and will invest USD1
billion to expand the capacity of S1 factory. The 28nm process of
TSMC is the world’s most advanced semiconductor production technology
except that of Intel, so its clients are willing to order in cash in
advance and its orders have been arranged till the end of 2012. TSMC
originally planned to invest USD6 billion in 2012, but recently, it
announced that it would probably raise CAPEX to USD7 billion to ease the
pressure on capacity. The semiconductor equipment market is
highly concentrated, and the share of the largest manufacturer in
corresponding sector usually exceeds 50% or even 90%. For example,
Applied Material’s market share reaches 93% in the CMP (chemical vapor
deposition) sector, and its market share in the PVD (physical vapor
deposition or sputtering) sector is 83%. Even the second largest
manufacturer may not be able to survive long, so there have been
frequent mergers and acquisitions in semiconductor equipment industry.
In November 2010, Applied Materials finished the acquisition of Varian
Semiconductor Equipment Associates with USD4.9 billion, aiming to
strengthen its competitiveness in the field of ion implantation. At
the end of 2011, Lam Research merges Novellus Systems with stock valued
about USD3.3 billion. Lam Research occupies 55% of the Etch market,
while Novellus holds 80% of the ECD market. The two companies merged to
provide customers with a more integrated product line. In April 2011,
Japan’s Advantest purchased Singapore’s Verigy, greatly expanding its
capability of SoC testing. In October 2011, Teradyne entered wireless
product testing market through acquiring LitePoint. Global Top 15 Semiconductor Equipment Vendors by Revenue, 2008-2011 (Unit: US$M)
第一章、全球半导体产业
1.1、DRAM内存产业
1.1.1、DRAM内存产业现状
1.1.2、DRAM内存厂家市场占有率
1.1.3、移动DRAM内存厂家市场占有率
1.2、NAND闪存NAND Falsh
1.3、IC制造与晶圆代工
1.4、IC封测产业概况
1.5、中国IC市场
1.6、中国晶圆代工产业
第二章、半导体设备产业
2.1、半导体设备市场
2.2、刻蚀设备产业
2.3、薄膜沉积设备产业
2.4、光刻机设备产业
2.5、半导体进程控制设备
2.6、复合半导体设备市场
2.6.1、Aixtron
2.6.2、VEECO
2.7、线邦定设备市场
2.8、半导体设备厂家排名
第三章、主要半导体设备厂家研究
3.1、Applied Materials
3.2、ASML
3.3、Tokyo Electron
3.4、KLA-Tencor
3.5、Lam Research
3.6、DAINIPPON SCREEN
3.7、尼康精机
3.8、Advantest
3.9、Hitachi High-Technologies
3.10、ASM International N.V.
3.11、Teradyne
3.12、日立国际电气
3.13、Kulicke & Soffa
第四章、主要半导体厂家研究
4.1、台积电
4.2、三星
4.3、英特尔
1. Global Semiconductor Industry
1.1 DRAM Industry
1.1.1 Current Status of DRAM Industry
1.1.2 Market Share of DRAM Vendors
1.1.3 Market Share of Mobile DRAM Vendors
1.2 NAND Flash
1.3 IC Fabrication and Wafer Foundry
1.4 Overview of IC Packaging and Testing Industry
1.5 Chinese IC Market
1.6 Chinese Wafer Foundry Industry
2. Semiconductor Equipment Industry
2.1 Semiconductor Equipment Market
2.2 Etch Equipment Industry
2.3 Film Deposition Equipment Industry
2.4 Lithography Equipment Industry
2.5 Semiconductor Process Control Equipment
2.6 Compound Semiconductor Equipment Market
2.6.1 Aixtron
2.6.2 Veeco
2.7 Wire Bonder Equipment Market
2.8 Ranking of Semiconductor Equipment Vendors
3. Major Semiconductor Equipment Vendors
3.1 Applied Materials
3.2 ASML
3.3 Tokyo Electron
3.4 KLA-Tencor
3.5 Lam Research
3.6 Dainippon Screen
3.7 Nikon Precision
3.8 Advantest
3.9 Hitachi High-Technologies
3.10 ASM International N.V.
3.11 Teradyne
3.12 Hitachi Kokusai Electric
3.13 Kulicke & Soffa
4. Major Semiconductor Companies
4.1 TSMC
4.2 Samsung Electronics
4.3 Intel
2000-2012年DRAM产业CAPEX
2000-2013年全球DRAM出货量
2009年10月-2012年1月DRAM合约价涨跌幅
2005年1季度-2012年4季度全球DRAM厂家收入
2010年1季度-2012年4季度全球DRAM晶圆出货量
2001-2013年 系统内存需求量
2011年3-4季度全球DRAM内存品牌厂家收入和市场占有率排名
2009-2011年Mobile DRAM 主要厂家市场占有率
2011年NAND Flash制造商收入排名和市场份额
2011年全球12英寸晶圆产能
2011年全球前25大半导体厂家销售额排名
1999-2012年全球12英寸晶圆厂产能地域分布
2005-2011年全球晶圆代工厂销售额排名
2011年全球前20大MEMS晶圆代工厂排名
2011年全球OSAT厂家市场占有率
2007-2011年台湾封测产业收入
2010-2013年全球半导体封装材料厂家收入
2007-2011年中国IC市场规模
2011年中国IC市场产品分布
2011年中国IC市场下游应用分布
2011年中国IC市场主要厂家市场占有率
2011年中国晶圆代工厂家销售额
2005-2012年SMIC收入与运营利润率
2009年1季度-2011年4季度SMIC收入与毛利率
2009年1季度-2011年4季度SMIC收入下游应用分布
2009年1季度-2011年4季度SMIC收入地域分布
2009年1季度-2011年4季度SMIC每季度收入节点(Node)分布
2009年1季度-2011年4季度SMIC出货量与产能利用率
2010年1季度-2011年4季度SMIC各工厂产能
SMIC工厂分布
SMIC主要客户
2007-2016全球晶圆设备投入规模
2011-2016年全球半导体厂家资本支出规模
2011-2016年全球WLP封装设备开支
2011-2016年全球Die封装设备开支
2011-2016年全球自动检测设备开支
2011-2012年全球TOP 10 半导体厂家资本支出额
2011年4季度-2012年4季度主要Fab支出产品分布
2010年1季度-2013年4季度全球晶圆加载产能产品分布
2010-2012年全球晶圆设备开支地域分布
2010-2013年全球半导体材料市场地域分布
2010-2012年全球半导体后段设备支出地域分布
2000\2005\2010刻蚀设备市场主要厂家市场占有率
2000\2005\2010年全球CVD、PVD、ECD、CMP主要厂家市场占有率
1992-2011年全球光刻机厂家市场占有率
1995-2012年半导体进程控制设备市场增幅
1999-2010年MOCVD市场主要厂家市场占有率
1998年1季度-2011年4季度全球MOCVD新订单
2009-2013年MOCVD市场规模
AIXTRON全球分布
2003-2011年AIXTRON收入与EBIT
1999-2011年AIXTRON收入下游应用分布
2010年1季度-2011年4季度AIXTRON新订单
2010年1季度-2011年4季度AIXTRON在手订单
2011年AIXTRON收入地域分布
2004-2012年VEECO收入与运营利润率
2010-2011年VEECO MOCVD下游应用
2008-2010年全球线邦定市场规模与主要厂家市场占有率
2010年1季度-2011年3季度全球自动线邦定主要厂家市场占有率
2011-2016年全球Ball Bonder市场铜线比例
2004-2015年OSAT厂家收入
2005-2016年全球封装节点分布
2006-2011年TOP 15全球半导体设备厂家收入排名
2007-2011年AMAT销售额与毛利率、运营利润率
2007-2011年AMAT新订单额与在手订单额
2010年1季度-2011年4季度AMAT新订单额与运营利润
2010年1季度-2011年4季度AMAT销售额与运营利润率
2009-2011年AMAT新订单地域与分布
2009-2011年AMAT新订单部门分布
2010-2011年AMAT在手订单部门分布
2009-2011年AMAT销售额地域分布
2009-2011年AMAT销售额部门分布
2009-2011年AMAT半导体设备部门新订单业务分布
2007-2011年ASML销售额与毛利率
2006年1季度-2011年4季度ASML销售额
2010年1季度-2011年4季度每季度ASML销售额与运营利润率
2010年1季度-2011年4季度每季度ASML销量与ASP
2010年1季度-2011年4季度每季度ASML销售额与在手订单
2010-2011年ASML在手订单额地域分布
2010-2011年ASML在手订单额下游应用分布
2010-2011年ASML在手订单额技术分布
ASML路线图
2005-2012财年TEL销售额与运营利润率
TEL全球分布
2006-2012财年TEL半导体设备销售额
2006-2011财年TEL 销售额地域分布
2010年1季度-2011年4季度TEL新订单
2005年4季度-2011年4季度TEL半导体设备下游应用分布
2011财年3季度-2012财年3季度TEL半导体设备收入与运营利润率
2011财年3季度-2012财年3季度TEL半导体设备收入地域分布
2007-2012财年KLA-Tencor收入与运营利润率
2009-2012财年上半年KLA-Tencor收入业务分布
2010-2011年KLA-Tencor收入下游应用分布
2009-2012财年上半年KLA-Tencor收入地域分布
2007-2012年Lam Research收入与运营利润率
2007-2011年Novellus收入与净利润
2010年1季度-2011年4季度Novellus销售额与毛利
2010年1季度-2011年4季度Novellus Net Order与环比增幅
2009-2011年Novellus收入地域分布
2011年4季度Lam Research收入下游应用分布
2009-2012财年上半年Lam Research收入地域分布
2009-2011年Lam Research在手订单Backlog
DAINIPPON SCREEN MFG组织结构
2007-2012财年DAINIPPON SCREEN收入与运营利润率
2009财年4季度-2012财年3季度DAINIPPON SCREEN每季度各部门收入与运营利润率
2009财年4季度-2012财年3季度DAINIPPON SCREEN每季度各部门新订单与在手订单
2009财年4季度-2012财年3季度DAINIPPON SCREEN半导体设备部门下游应用分布
2007-2012财年DAINIPPON SCREEN半导体设备销售额
2010年2季度-2011年4季度DAINIPPON SCREEN半导体设备销售额与运营利润率
2011-2012财年DAINIPPON SCREEN半导体设备销售额地域分布
2006-2012年尼康精机销售额与运营利润率
2009-2012年尼康精机Stepper出货量类型分布
2011财年1季度-2012财年3季度Advantest毛利率与运营利润
2011财年1季度-2012财年3季度Advantest新订单部门分布
2011财年1季度-2012财年3季度Advantest新订单地域分布
2011财年1季度-2012财年3季度Advantest销售额部门分布
2011财年1季度-2012财年3季度Advantest销售额地域分布
2000-2011年Advantest半导体测试部门销售额下游应用分布
Advantest全球分布
2007-2012财年Hitachi High-Technologies收入与运营利润率
2011-2012财年Hitachi High-Technologies收入部门分布
2011-2012财年Hitachi High-Technologies运营利润部门分布
2006-2011年ASM销售额与运营利润率
2006-2011年ASM销售额业务分布
2011年ASM Front-end业务销售额地域分布
2011年ASM Back-end业务销售额地域分布
2010年1季度-2011年4季度 Teradyne收入与运营利润率
2005年1季度-2011年4季度Teradyne SOC产品新订单
2011年4季度 Teradyne销售额与在手订单地域分布
2007-2012年日立国际电气收入与运营利润率
2008-2012财年Hitachi Kokusai Electric收入业务分布
2008-2011财年Hitachi Kokusai Electric营业利润业务分布
2007-2011年Kulicke & Soffa收入与运营利润率
2009-2011财年Kulicke & Soffa前10大客户
Kulicke & Soffa全球分布
2010年1季度-2011年4季度Kulicke & Soffa收入与运营利润率
TSMC组织结构
2004-2011年TSMC收入与营业利润率
2004-2011年TSMC出货量与产能利用率
2009年1季度-2011年4季度TSMC每季度收入与营业利润率
2009年1季度-2011年4季度TSMC每季度出货量与营业利润率
2005年-2011年4季度TSMC产品下游应用分布
2008年3季度-2011年4季度台积电收入节点分布(By Node)
2008-2011年台积电各工厂产能
2011年1季度-2012年4季度三星System LSI 事业部收入业务分布
2011年1季度-2012年4季度三星System LSI 事业部收入与运营利润率
2011年1季度-2012年4季度三星NAND内存收入与运营利润率
2011年1季度-2012年4季度三星DRAM内存收入与运营利润率
2004-2011年英特尔收入与毛利率
2004-2011年英特尔收入与运营利润率
2004-2011年英特尔收入与净利率
2006-2011年Q4 英特尔收入地域分布
2006-2008年英特尔收入产品分布
2008-2010年英特尔收入产品分布
英特尔CPU工艺路线图
Intel全球基地分布
INTEL WAFER FAB LIST
CAPEX of DRAM Industry, 2000-2012
Global Shipment of DRAM, 2000-2013
Change in DRAM Contract Price, Oct. 2009-Jan. 2012
Revenue of Global DRAM Vendors, Q1 2005-Q4 2012
Global Shipment of DRAM Wafer, Q1 2010-Q4 2012
Demand for RAM, 2001-2013E
Revenue and Ranking by Market Share of DRAM Brands, Q3-Q4 2011
Market Share of Major Mobile DRAM Vendors, 2009-2011
Ranking by Revenue and Market Share of NAND Flash Makers, 2011
Global 12-inch Wafer Capacity, 2011
Ranking of Global Top 25 Semiconductor Companies by Sales, 2011
Capacity of Global 12-inch Wafer Plants by Region, 1999-2012
Ranking of Global Wafer Foundries by Sales, 2005-2011
Ranking of Global Top 20 MEMS Wafer Foundries, 2011
Market Share of Global OSAT Manufacturers, 2011
Revenue of Taiwanese IC Packaging and Testing Industry, 2007-2011
Revenue of Global Semiconductor Packaging Material Manufacturers, 2010-2013
China IC Market Size, 2007-2011
China IC Market Distribution by Product, 2011
China IC Market Distribution by Application, 2011
China IC Market Distribution by Manufacturer, 2011
Sales of Wafer Foundries in China, 2011
Revenue and Operating Margin of SMIC, Q1 2009-Q4 2011
Revenue and Gross Margin of SMIC, Q1 2009-Q4 2011
Revenue of SMIC by Application, Q1 2009-Q4 2011
Revenue of SMIC by Region, Q1 2009-Q4 2011
Revenue of SMIC by Node, Q1 2009-Q4 2011
Shipment and Capacity Utilization of SMIC, Q1 2009-Q4 2011
Capacity of SMIC by Factory, Q1 2010-Q4 2011
Distribution of SMIC Factories
Main Clients of SMIC
Global Wafer Equipment Investment, 2007-2016
CAPEX of Global Semiconductor Companies, 2011-2016
Global CAPEX on WLP Packaging Equipment, 2011-2016
Global CAPEX on Die Packaging Equipment, 2011-2016
Global CAPEX on Automated Test Equipment, 2011-2016
CAPEX of Global Top10 Semiconductor Vendors, 2011-2012
Fab CAPEX by Product, Q4 2011-Q4 2012
Global Loaded Wafer Capacity by Product, Q1 2010-Q4 2013
Global Wafer Equipment CAPEX by Region, 2010-2012
Global Semiconductor Material Market by Region, 2010-2013
Global Semiconductor Back-end Equipment CAPEX by Region, 2010-2012
Market Share of Major Etch Equipment Vendors, 2000\2005\2010
Market Share of Global CVD, PVD, ECD, CMP Manufacturers, 2000\2005\2010
Market Share of Global Lithography Equipment Manufacturers, 1992-2011
Semiconductor Process Control Equipment Market Growth, 1995-2012
Market Share of Major MOCVD Manufacturers, 1999-2010
Global New MOCVD Orders, Q1 1998-Q4 2011
MOCVD Market Scale, 2009-2013
Global Distribution of Aixtron
Revenue and EBIT of Aixtron, 2003-2011
Revenue of Aixtron by Application, 1999-2011
New Orders of Aixtron, Q1 2010-Q4 2011
Order Backlog of Aixtron, Q1 2010-Q4 2011
Revenue of Aixtron by Region, 2011
Revenue and Operating Margin of Veeco, 2004-2012
MOCVD Applications of Veeco, 2010-2011
Global Wire Bonder Market Size and Market Share of Major Vendors, 2008-2010
Market Share of Major Global Automated Wire Bonder Vendors, Q1 2010-Q3 2011
Proportion of Copper Wire in Global Ball Bonder Market, 2011-2016
Revenue of OSAT Manufacturers, 2014-2015
Global Semiconductor Packaging by Node, 2005-2016
Ranking of Global Top 15 Semiconductor Equipment Manufacturers by Revenue, 2006-2011
Sales, Gross Margin and Operating Margin of AMAT, 2007-2011
New and Backlog Orders of AMAT, 2007-2011
New Orders and Operating Margin of AMAT, Q1 2010-Q4 2011
Sales and Operating Margin of AMAT, Q1 2010-Q4 2011
New Orders of AMAT by Region, 2009-2011
New Orders of AMAT by Division, 2009-2011
Backlog Orders of AMAT by Division, 2010-2011
Sales of AMAT by Region, 2009-2011
Sales of AMAT by Division, 2009-2011
New Orders of AMAT Semiconductor Equipment Division by Business, 2009-2011
Sales and Gross Margin of ASML, 2007-2011
Sales of ASML, Q1 2006-Q4 2011
Sales and Operating Margin of ASML, Q1 2010-Q4 2011
Sales Volume and ASP of ASML by Quarter, Q1 2010-Q4 2011
Sales and Backlog Orders of ASML by Quarter, Q1 2010-Q4 2011
Backlog Order Value of ASML by Region, 2010-2011
Backlog Orders Value of ASML by Application, 2010-2011
Backlog Order Value of ASML by Technology, 2010-2011
Roadmap of ASML
Sales and Operating Margin of TEL, FY2005-FY2012
Global Distribution of TEL
Semiconductor Equipment Sales of TEL, FY2006-FY2012
Sales of TEL by Region, FY2006-FY2011
New Orders of TEL, Q1 2010-Q4 2011
Semiconductor Equipment of TEL by Application, Q4 2005-Q4 2011
Semiconductor Equipment Revenue and Operating Margin of TEL, Q3 FY2011-Q3 FY2012
Semiconductor Equipment Revenue of TEL by Region, Q3 FY2011-Q3 FY2012
Revenue and Operating Margin of KLA-Tencor, FY2007-FY2012
Revenue of KLA-Tencor by Business, FY2009-H1 FY2012
Revenue of KLA-Tencor by Application, 2010-2011
Revenue of KLA-Tencor by Region, FY2009-H1 FY2012
Revenue and Operating Margin of Lam Research, 2007-2012
Revenue and Net Income of Novellus, 2007-2011
Sales and Gross Profit of Novellus, Q1 2010-Q4 2011
New Orders and QoQ Growth of Novellus, Q1 2010-Q4 2011
Revenue of Novellus by Region, 2009-2011
Revenue of Lam Research by Application, Q4 2011
Revenue of Lam Research by Region, FY2009-H1 FY2012
Backlog Orders of Lam Research, 2009-2011
Organization Structure of Dainippon Screen Mfg
Revenue and Operating Margin of Dainippon Screen, FY2007-FY2012
Revenue and Operating Margin of Dainippon Screen by Division, Q4 FY2009-Q3 FY2012
New and Backlog Orders of Dainippon Screen, Q4 FY2009-Q3 FY2012
Semiconductor Division of Dainippon Screen by Application, Q4 FY2009-Q3 FY2012
Semiconductor Equipment Sales of Dainippon Screen, FY2007-FY2012
Semiconductor Equipment Sales and Operating Margin of Dainippon Screen, Q2 2010-Q4 2011
Semiconductor Equipment Sales of Dainippon Screen by Region, FY2011-FY2012
Sales and Operating Margin of Nikon Precision, 2006-2012
Shipment of Nikon Precision by Type, 2009-2012
Gross Margin and Operating Income of Advantest, Q1 FY2011-Q3 FY2012
New Orders of Advantest by Division, Q1 FY2011-Q3 FY2012
New Orders of Advantest by Region, Q1 FY2011-Q3 FY2012
Sales of Advantest by Division, Q1 FY2011-Q3 FY2012
Sales of Advantest by Region, Q1 FY2011-Q3 FY2012
Sales of Advantest Semiconductor Testing Division by Application, 2000-2011
Global Distribution of Advantest
Revenue and Operating Margin of Hitachi High-Technologies, FY2007-FY2012
Revenue of Hitachi High-Technologies by Division, FY2011-FY2012
Operating Income of Hitachi High-Technologies by Division, FY2011-FY2012
Sales and Operating Margin of ASM, 2006-2011
Sales of ASM by Business, 2006-2011
Front-end Business Sales of ASM by Region, 2011
Back-end Business Sales of ASM by Region, 2011
Revenue and Operating Margin of Teradyne, Q1 2010-Q4 2011
New Orders for SOC Products of Teradyne, Q1 2005-Q4 2011
Sales and Backlog Orders of Teradyne by Region, Q4 2011
Sales and Operating Margin of Hitachi Kokusai Electric, 2007-2012
Revenue of Hitachi Kokusai Electric by Business, FY2008-FY2012
Operating Income of Hitachi Kokusai Electric by Business, FY2008-FY2011
Revenue and Operating Margin of Kulicke & Soffa, 2007-2011
Top10 Clients of Kulicke & Soffa, FY2009-FY2011
Global Distribution of Kulicke & Soffa
Revenue and Operating Margin of Kulicke & Soffa, Q1 2010-Q4 2011
Organization Structure of TSMC
Revenue and Operating Margin of TSMC, 2004-2011
Shipment and Capacity Utilization of TSMC, 2004-2011
Revenue and Operating Margin of TSMC by Quarter, Q1 2009-Q4 2011
TSMC Shipment and Operating Margin of TSMC by Quarter, Q1 2009-Q4 2011
TSMC Products by Application, 2005-Q4 2011
TSMC Revenue by Node, Q3 2008-Q4 2011
TSMC Capacity by Factory, 2008-2011
Samsung System LSI Revenue by Business, Q1 2011-Q4 2012
Samsung System LSI Revenue and Operating Margin, Q1 2011-Q4 2012
Samsung NAND RAM Revenue and Operating Margin, Q1 2011-Q4 2012
Samsung DRAM RAM Revenue and Operating Margin, Q1 2011-Q4 2012
Revenue and Gross Margin of Intel, 2004-2011
Revenue and Operating Margin of Intel, 2004-2011
Revenue and Net Income Margin of Intel, 2004-2011
Intel Revenue by Region, 2006-Q4 2011
Intel Revenue by Product, 2006-2008
Intel Revenue by Product, 2008-2010
Intel CPU Technology Roadmap
Intel Bases Worldwide
Intel Wafer Fab List
如果这份报告不能满足您的要求,我们还可以为您定制报告,请 留言说明您的详细需求。
|