|
|
|
报告导航:研究报告—
制造业—化工
|
|
2012年中国改性塑料市场研究报告 |
 |
字数:2.0万 |
页数:60 |
图表数:70 |
|
中文电子版:5500元 |
中文纸版:2750元 |
中文(电子+纸)版:6000元 |
|
英文电子版:1500美元 |
英文纸版:1600美元 |
英文(电子+纸)版:1800美元 |
|
编号:CYQ020
|
发布日期:2012-05 |
附件:下载 |
 |
|
|
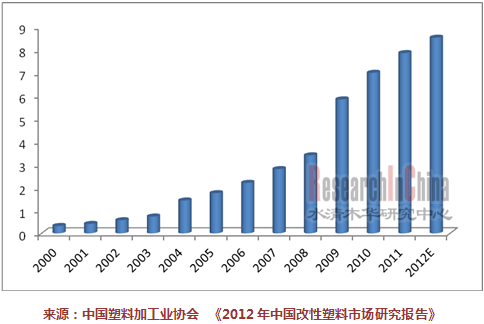
改性塑料是在塑料基础上添加各种改性剂得到的具有优良特性的新材料,在汽车、家电等行业的应用越来越广泛。中国改性塑料产量由2000 年的32 万吨上升至2009 年的584万吨,预计到2012年将达到853万吨。
图:2000-2012E年中国改性塑料产量(百万吨)

《2012年中国改性塑料市场研究报告》主要研究了中国改性塑料的市场供求、竞争格局情况,对家电用改性塑料、汽车用改性塑料、节能灯具用改性塑料和电线电缆用改性塑料四个细分市场的市场规模、竞争现状进行了详尽研究。另外本报告分析了金发科技、哈尔滨鑫达、上海普利特等18家改性塑料生产企业的经营情况。 中国改性塑料行业的迅速发展主要得益于家电、汽车等下游行业的持续发展,从改性塑料的下游应用领域来看,家业、汽车等细分市场发展空间较大。2011年家电行业改性塑料消费量占整个改性塑料市场的54.1%,汽车用改性塑料消费占比为34.1%,且有不断提高的趋势。 改性塑料是家电行业中应用量增速最快的原材料。中国是家电生产和消费大国,改性塑料的应用空间广阔,预计2012年中国家电用改性塑料的市场需求为375.80万吨。该细分市场的主要企业是金发科技、广州花都科苑、广东银禧科技、浙江俊尔等。 汽车用改性塑料的需求除了来自汽车行业的市场容量外,还主要得益于单车塑料零部件使用量的不断增加。。预计到2012年,中国汽车用改性塑料的市场需求将超过220万吨。该细分市场的领先企业主要有哈尔滨鑫达、普利特、北京聚菱燕等。 金发科技是中国规模最大、产品种类最齐全的改性塑料生产企业,2011年公司产能超过58万吨,全年产品产量预计超过60万吨。2012年2月,金发科技启动增发,计划在天津、广州、昆山和绵阳等地共投资38.33亿元建设五个项目,预计于2016年建成,共新增产能123万吨,建成后将新增汽车用改性塑料产能80万吨。 哈尔滨鑫达是汽车用改性塑料细分市场的重要供应商,2011年产品销量为15.13万吨,较2010年的11.37万吨同比增长33%,在中国改性塑料市场中的占有率也由2010年的5.4%提高到2011年的7.2%。哈尔滨鑫达计划进行产能扩张,预计到2013年产能达到30万吨。
As the new materials with good performance made by adding modifying
agents to plastics, modified plastics have been increasingly applied in
automotive, home appliance and other industries. China’s output of
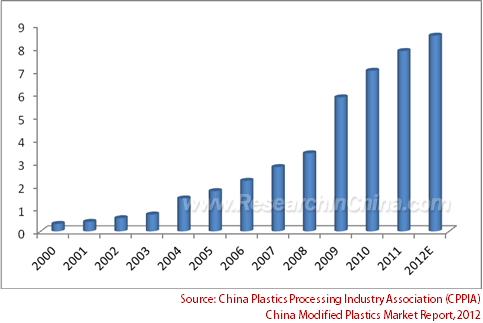
modified plastics increased from 320,000 tons in 2000 to 5.84 million
tons in 2009, and is expected to hit 8.53 million tons in 2012. China’s Output of Modified Plastics, 2000-2012E (mln tons)

The
report centers on the supply & demand, competition pattern of China
modified plastics market, and highlights the market scale and current
competition in four market segments including home appliance modified
plastics, automotive modified plastics, energy-saving lamp modified
plastics and wire & cable modified plastics. In addition, the report
analyzes the operation of 18 modified plastics enterprises including
Kingfa Sci. & Tech., China XD Plastics, and PRET. The boom of
China’s modified plastics industry is largely attributable to the
sustained development of home appliance, automotive and other downstream
industries. The home appliance and automotive modified plastics market
segments have huge growth potential. In 2011, the home appliance
industry made up 54.1% of the consumption of modified plastics, while
the automotive industry accounted for 34.1%, and the proportions are
still climbing. Modified plastics are the raw materials seeing
the fastest application in the home appliance industry. As China is a
large home appliance producer and consumer, the application of modified
plastics may expect unprecedented potential, with the targeted demand
for home appliance modified plastics in 2012 hitting 3.758 million tons.
Leading enterprises in the market segment include Kingfa Sci. &
Tech., Guangzhou Huadu Keyuan, Guangdong Silver Age Sci & Tech, and
Zhejiang Juner New Materials. The considerable demand for
automotive modified plastics results from the growing market capacity of
the automotive industry and the increasing application of plastic parts
in automobiles. It’s estimated that China’s demand for automotive
modified plastics will surpass 2.2 million tons in 2012. Leading
enterprises in the market segment include China XD Plastics, PRET, and
Beijing JuLingYan Plastic. Kingfa Sci. & Tech. is the
largest modified plastics manufacturer in China with the most varieties
of modified plastics products. In 2011, the company’s capacity exceeded
580,000 tons, while the estimated output exceeded 600,000 tons. In
February 2012, Kingfa launched additional share issue and planned to
invest RMB3.833 billion in five projects in Tianjin, Guangzhou, Kunshan
and Mianyang, which are set to be finished by 2016 and increase the
company’s capacity by 1.23 million tons, including 800,000 tons of
automotive modified plastics. China XD Plastics is a major
supplier in the automotive modified plastics market. In 2011, the sales
volume of the company was 151,300 tons, up 33% year-on-year compared
with the 113,700 tons in 2010, with the market occupancy in China’s
modified plastics market rising to 7.2% in 2011 from 5.4% in 2010. China
XD Plastics is scheduled to expand its capacity to 300,000 tons by
2013.
第一章 改性塑料行业概述
1.1定义及分类
1.1.1 定义
1.1.2 分类
1.2 产业链
1.2.1 产业链概况
1.2.2 上游行业
第二章 改性塑料市场分析
2.1 市场供给
2.2 市场需求
2.3 竞争格局
2.3.1 主要外资企业
2.3.2 主要本土厂商
2.4 政策环境
第三章 改性塑料下游应用
3.1 家电用改性塑料市场分析
3.1.1 改性塑料在家电中的应用
3.1.2 市场需求预测
3.2 汽车用改性塑料市场分析
3.2.1概述
3.2.2 需求
3.2.3 市场规模
3.2.4 竞争格局
3.3 节能灯具用改性塑料市场分析
3.3.1 市场规模
3.3.2 主要生产企业
3.4 电线电缆用改性塑料市场分析
3.4.1 市场概况
3.4.2 主要生产企业
第四章 重点企业分析
4.1 金发科技
4.1.1 企业简介
4.1.2 整体经营
4.1.3 营收构成分析
4.1.4 毛利率
4.1.5 客户及供应商分析
4.1.6 产品售价
4.1.7 产能及产量分析
4.1.8 2012-2016年发展规划
4.2 哈尔滨鑫达
4.2.1 企业简介
4.2.2 整体经营
4.2.3 产品销量
4.2.4 营收构成
4.2.5 毛利率
4.2.6 公司研发情况
4.2.7 产能扩张规划
4.3 普利特
4.3.1 企业简介
4.3.2 经营情况
4.3.3 营收构成分析
4.3.4 毛利率
4.3.5 研发及投资分析
4.3.6 客户及供应商分析
4.3.7 预测与展望
4.4 银禧科技
4.4.1 企业简介
4.4.2 整体经营
4.4.3 营收构成
4.4.3 毛利率
4.4.4 供货商及客户
4.4.5 研发及投资
4.4.6 产量及产能分析
4.5 广东聚赛龙工程塑料有限公司
4.6 海尔新材料研发有限公司
4.7 北京聚菱燕塑料有限公司
4.8 上海锦湖日丽塑料有限公司
4.9 苏州旭光聚合物有限公司
4.10 南京金衫汽车工程塑料有限责任公司
4.11 广州科苑新型材料有限公司
4.12 横店集团得邦工程塑料有限公司
4.13 科铨塑胶(深圳)有限公司
4.14 东莞毅兴塑料原料有限公司
4.15 浙江俊尔新材料有限责任公司
4.16 江阴济化新材料有限公司
4.17 南通星辰合成材料有限公司
4.18上海杰事杰新材料(集团)股份有限公司
4.18.1 集团简介
4.18.2 子公司
1. Overview of Modified Plastics Industry
1.1 Definition and Classification
1.1.1 Definition
1.1.2 Classification
1.2 Industry Chain
1.2.1 Overview
1.2.2 Upstream
2. Modified Plastics Market
2.1 Supply
2.2 Demand
2.3 Competition Pattern
2.3.1 Major Foreign-funded Manufacturers
2.3.2 Major Local Manufacturers
2.4 Policies
3. Downstream Application of Modified Plastics
3.1 Market of Modified Plastics for Home Appliance
3.1.1 Application of Modified Plastics in Home Appliance
3.1.2 Demand Forecast
3.2 Market of Modified Plastics for Automobile
3.2.1 Overview
3.2.2 Demand
3.2.3 Market Scale
3.2.4 Competition Pattern
3.3 Market of Modified plastics for Energy-saving Lighting
3.3.1 Market Scale
3.3.2 Major Manufacturers
3.4 Market of Modified Plastics for Wire & Cable
3.4.1 Overview
3.4.2 Major Manufacturers
4. Key Enterprises
4.1 Kingfa Sci. & Tech. Co., Ltd.
4.1.1 Profile
4.1.2 Operation
4.1.3 Operating Revenue Structure
4.1.4 Gross Margin
4.1.5 Customers and Suppliers
4.1.6 Price
4.1.7 Capacity and Output
4.1.8 Development Plan for 2012-2016
4.2 China XD Plastics Company Limited
4.2.1 Profile
4.2.2 Operation
4.2.3 Sales Volume
4.2.4 Operating Revenue Structure
4.2.5 Gross Margin
4.2.6 R&D
4.2.7 Capacity Expansion Plan
4.3 PRET
4.3.1 Profile
4.3.2 Operation
4.3.3 Operating Revenue Structure
4.3.4 Gross Margin
4.3.5 R&D and Investment
4.3.6 Customers and Suppliers
4.3.7 Forecast and Prospect
4.4 Guangdong Silver Age Sci & Tech. Co., Ltd
4.4.1 Profile
4.4.2 Operation
4.4.3 Operating Revenue Structure
4.4.4 Gross Margin
4.4.5 Customers and Suppliers
4.4.6 R&D and Investment
4.4.7 Capacity and Output
4.5 Super-Dragon Engineering Plastic Co., Ltd
4.6 Haier New Material R&D Co., Ltd
4.7 Beijing JuLingYan Plastic Co., Ltd
4.8 Shanghai Kumho Sunny Plastics Co., Ltd
4.9 Suzhou Xuguang Polymer Co., Ltd
4.10 Nanjing Jinshan Automobile Engineering Plastic Co., Ltd
4.11 Guangzhou KeYuan Innovative Materials Co., Ltd
4.12 Hengdian Group Tospo Engineering Plastics Co., Ltd
4.13 Kequan Plastic (Shenzhen) Co., Ltd
4.14 Dongguan Ngai Hing Plastic Materials Co., Ltd
4.15 Zhejiang Juner New Materials Co., Ltd
4.16 Jiangyin Jihua New Material Co., Ltd
4.17 Nantong Xingchen Synthetic Material Co., Ltd
4.18 Shanghai Genius Advanced Material Co., Ltd
4.18.1 Profile
4.18.2 Subsidiaries
图:改性塑料产业链
图:2008-2011年中国合成树脂产量及表观消费量
图:2005-2011年中国石化合成树脂价格
图:2008-2011年中国合成树脂进出口量
图:2000-2012E中国改性塑料产量
图:2000-2012E年中国改性塑料表观消费量
表:主要外资改性塑料生产企业
表:2011年中国主要改性塑料生产厂家
表:2011年中国改性塑料细分市场主要生产企业
表:中国改性塑料相关政策
图:2011年改性塑料在下游行业中的应用比例
图:2010年中国主要家电中塑料的使用比例
表:家电用塑料材料主要品种
图:2002-2011年中国四大家电产量同比增速
图:2002-2012E中国四大家电产量
表:2011-2012年中国家用电器改性塑料需求量测算
表:改性塑料在汽车上的应用
表:可以用塑料替代的汽车部件
图:2002-2012年中国汽车产量
图:2005-2015E年每辆汽车上的改性塑料用量
图:2005-2012E中国汽车用改性塑料需求
图:2005-2012E中国汽车用改性塑料市场规模
表:2010-2011年中国主要企业车用改性塑料产量
表:2011年中国汽车用改性塑料生产厂家主要产品及下游客户
图:2011-2015年中国节能灯具专用改性塑料市场需求预测
表:中国主要节能灯具用改性塑料生产厂家
图:2003-2011年中国电线电缆行业主营业务收入及同比增速
图:2007-2012年中国电线电缆用改性塑料市场需求
表:2011年中国主要电线电缆用改性塑料生产厂家
图:2008-2011年金发科技营业收入及净利润
图:2008-2011年金发科技分产品营业收入
图:2008-2011年金发科技改性塑料分地区营业收入
图:2008-2011年金发科技分产品毛利率
图:2008-2011年金发科技前五名客户销售总额及占公司营收比重
表:2011年上半年金发科技前五名客户销售额及占比
图:2008-2011年金发科技前五名供货商供货金额及占总供货额比重
图:2008-2011年金发科技主要产品售价
图:2008-2011年金发科技产品产能和产量
表:2008-2011年金发科技分产品产量和销量
表:金发科技高端新产品产业化进展情况
表:2012-2016年金发科技建设项目
图:2009-2011年哈尔滨鑫达营业收入及净利润
表:2010-2011年哈尔滨鑫达分产品销量
表:2010-2011年哈尔滨鑫达分产品收入
图:2009-2011年哈尔滨鑫达毛利率
图:2009-2011年哈尔滨鑫达研发投入及占营收比重
图:2008-2011年普利特营业收入及净利润
图:2009-2011年普利特产品销量
图:2009-2011年普利特主营业务分产品销售收入
图:2009-2011年普利特分地区收入
图:2009-2011年普利特分产品毛利率
图:2009-2011年普利特研发费用及占营收比重
表:2010-2012年普利特募投项目
图:2009-2011年普利特前5名客户销售总额及占比
表:2011年普利特前5名客户销售额及占比
图:2009-2011年普利特前五名供应商采购金额及占比
表:2011年普利特前5名供应商采购金额及占采购总额比重
图:2010-2013E普利特主营业务收入
图:2008-2011年银禧科技营业收入及净利润
图:2008-2011年银禧科技分产品营业收入
图:2008-2011年银禧科技分地区收入
表:2008-2011年银禧科技分产品毛利率
图:2008-2011年银禧科技前5名供应商供货额占比
表:2011年银禧科技前5名供货商供货金额及占比
图:2008-2011年银禧科技前5名客户收入占比
表:2011年银禧科技前五名客户销售额及占比
图:2008-2011年银禧科技研发费用及占营收比重
表:2011-2012年银禧科技项目建设及新增产能
图:2008-2010年银禧科技分产品产量
图:2008-2010年银禧科技产能及实际产量
Modified Plastics Industry Chain
Output and Apparent Consumption of Synthetic Resin in China, 2008-2011
Synthetic Resin Price of China Sinopec, 2005-2011
Import and Export Volume of Synthetic Resin in China, 2008-2011
Output of Modified Plastics in China, 2000-2012E
Apparent Consumption of Modified Plastics in China, 2000-2012E
Major Foreign-funded Modified Plastics Manufacturers
Major Modified Plastics Manufacturers in China, 2011
Major Manufacturers in Modified Plastics Market Segments in China, 2011
Policies on Modified Plastics in China
Application of Modified Plastics in Downstream Sectors, 2011
Application Proportion of Plastics in Major Home Appliances in China, 2010
YoY Growth Rate of Output of Four Major Home Appliances in China, 2002-2011
Output of Four Major Home Appliances in China, 2002-2012E
Demand of Home Appliances for Modified Plastics in China, 2011-2012
Application of Modified Plastics in Automobile
Auto Parts Replaceable by Plastics
Output of Automobile in China, 2002-2012
Modified Plastics Consumption per Automobile, 2005-2015E
Demand for Automotive Modified Plastics in China, 2005-2012E
Market Scale of Automotive Modified Plastics, 2005-2012E
Output of Automotive Modified Plastics of Major Enterprises in China, 2010-2011
Main Products and Downstream Clients of Automotive Modified Plastics Manufacturers in China, 2011
Demand Forecast of Modified Plastics for Energy-saving Lamp in China, 2011-2015
Major Manufacturers of Modified Plastics for Energy-saving Lighting in China
Operating Revenue and YoY Growth Rate of Wire & Cable Industry in China, 2003-2011
Demand for Modified Plastics for Wire & Cable in China, 2007-2012E
Major Manufacturers of Modified Plastics for Wire & Cable in China, 2011
Operating Revenue and Net Income of Kingfa Sci. & Tech, 2008-2011
Operating Revenue of Kingfa Sci. & Tech by Product, 2008-2011
Operating Revenue of Kingfa Sci. & Tech by Region, 2008-2011
Gross Margin of Kingfa Sci. & Tech by Product, 2008-2011
Sales and Revenue Contribution of Top 5 Clients of Kingfa Sci. & Tech, 2008-2011
Top 5 Clients of Kingfa Sci. & Tech by Sales, 2011
Top 5 Suppliers of Kingfa Sci. & Tech by Procurement, 2008-2011
Prices of Kingfa Sci. & Tech by Product, 2008-2011
Capacity and Output of Kingfa Sci. & Tech, 2008-2011
Output and Sales Volume of Kingfa Sci. & Tech by Product, 2008-2011
Industrial Progress of High-end New Products of Kingfa Sci. & Tech
Projects of Kingfa Sci. & Tech, 2012-2016
Operating Revenue and Net Income of China XD, 2009-2011
Sales Volume of China XD by Product, 2010-2011
Revenue of China XD by Product, 2010-2011
Gross Margin of China XD, 2009-2011
R&D Investment and Proportion in Operating Revenue of China XD, 2009-2011
Operating Revenue and Net Income of PRET, 2008-2011
Sales Volume of PRET, 2009-2011
Revenue of PRET by Product, 2009-2011
Revenue of PRET by Region, 2009-2011
Gross Margin of PRET by Product, 2009-2011
R&D Expenses and Proportion in Operating Revenue of PRET, 2009-2011
Projects of PRET, 2010-2012
Sales of PRET from Top 5 Clients, 2009-2011
Top 5 Clients of PRET by Sales, 2011
Procurement of PRET from Top 5 Suppliers , 2009-2011
Top 5 Suppliers of PRET by Procurement, 2011
Operating Revenue of PRET, 2010-2013E
Operating Revenue and Net Income of Silver Age Sci & Tech, 2008-2011
Operating Revenue of Silver Age Sci & Tech by Product, 2008-2011
Revenue of Silver Age Sci & Tech by Region, 2008-2011
Gross Margin of Silver Age Sci & Tech by Product, 2008-2011
Procurement of Silver Age Sci & Tech from Top 5 Suppliers, 2008-2011
Top 5 Suppliers of Silver Age Sci & Tech by Procurement, 2011
Revenue of Silver Age Sci & Tech from Top 5 Clients, 2008-2011
Top 5 Customers of Silver Age Sci & Tech by Sales, 2011
R&D Expenses and Proportion in Operating Revenue of Silver Age Sci & Tech, 2008-2011
Projects and New Capacity of Silver Age Sci & Tech, 2011-2012
Output of Silver Age Sci & Tech by Product, 2008-2010
Capacity and Actual Output of Silver Age Sci & Tech, 2008-2010
如果这份报告不能满足您的要求,我们还可以为您定制报告,请 留言说明您的详细需求。
|