|
|
|
报告导航:研究报告—
农业与食品—食品饮料
|
|
2011-2013年中国食用植物油行业研究报告 |
 |
字数:3.7万 |
页数:97 |
图表数:131 |
|
中文电子版:8000元 |
中文纸版:4000元 |
中文(电子+纸)版:8500元 |
|
英文电子版:2200美元 |
英文纸版:2300美元 |
英文(电子+纸)版:2500美元 |
|
编号:XJT020
|
发布日期:2012-09 |
附件:下载 |
 |
|
|
近年来,中国食用植物油消费需求在总量上保持刚性增长的趋势,食用植物油行业整体上也取得了较快发展。2011年,中国食用植物油产量达到4331.9万吨,同比增长19.6%;表观消费量达到4976.7万吨,同比增长8.3%;营业收入达到7350.6亿元,同比增长27.9%。 图:2006-2012年中国食用植物油行业营业收入及增长率 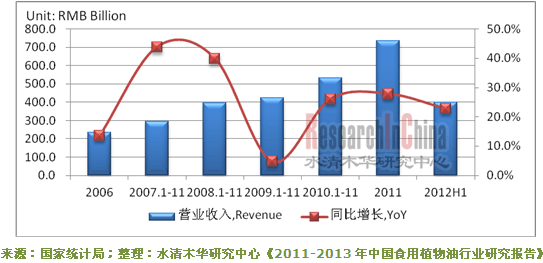 随着原料稀缺、成本上升,政府为维持社会生活的稳定而限制产品价格,中国食用植物油行业毛利率仅维持在7.9%-9.1%之间,成本控制能力较弱的企业面临亏损甚至倒闭的危险。而在产业链中拥有原材料优势、品牌渠道优势的企业则较为有利,2011年益海嘉里、中粮集团、鲁花集团小包装食用油市场占有率分别达到50%、15%、8%,中国食用植物油行业呈现寡头竞争格局。 《2011-2013年中国食用植物油行业研究报告》的内容主要包括以下几方面:- 中国食用植物油市场规模、市场结构、价格走势、进出口情况、利润水平、竞争格局、消费趋势等;
- 中国食用植物油行业监管政策、行业政策、进入壁垒、上下游行业对其影响等;
- 中国食用植物油行业细分市场分析,包括豆油、花生油、菜籽油、玉米油、橄榄油、棕榈油、茶油市场发展及预测等;
- 国内外15家食用植物油企业的生产经营情况、投资并购、食用植物油业务及发展前景等。
China’s edible vegetable oil consumption demand has maintained a rigid
growth trend in recent years; and the whole edible vegetable oil
industry has also made rapid development. In 2011, China’s edible
vegetable oil output registered 43.319 million tons, rising by 19.6%
from the year earlier; the apparent consumption reached 49.767 million
tons, up 8.3% YoY; and the revenue increased by 27.9% YoY to RMB735.06
billion. Revenue and Growth Rate of Chinese Edible Vegetable Oil Industry, 2006-2012
Due
to the scarcity of raw materials, rising costs, and the government’s
restriction on product prices for social stability, the gross margin of
Chinese edible vegetable oil industry is merely 7.9%-9.1%. Affected by
this, enterprises with weaker cost control abilities are exposed to
losses even bankruptcy, while those advantageous in raw materials and
brand channels benefit. In 2011, small-package edible oil market share
of Yihai Kerry Group, COFCO and Shandong Luhua Group reached 50%, 15%
and 8% respectively; and Chinese edible vegetable oil industry presented
an oligopolistic competition pattern. This report mainly covers the following contents:
Market size, market structure, price trend, import & export,
profit, competition pattern and consumption trend of Chinese edible
vegetable oil market;
Impact of regulatory policies, industrial policies, entry barriers and
upstream & downstream sectors on Chinese edible vegetable oil
industry;
Analysis on market segments of Chinese edible vegetable oil industry,
including market development and forecast of soybean oil, peanut oil,
rapeseed oil, corn oil, olive oil, palm oil and camellia oil.
Production & operation, investment & acquisition, edible
vegetable oil business and development prospect of 15 edible vegetable
oil enterprises at home and abroad.
第一章 食用植物油行业概述
1.1 定义
1.2 分类
第二章 中国食用植物油行业发展状况
2.1 总体概况
2.2 市场结构
2.3 进出口分析
2.3.1 进口分析
2.3.2 出口分析
2.4 价格走势
2.5 利润水平
2.6 竞争格局
2.7 进入壁垒
2.7.1 准入壁垒
2.7.2 资金壁垒
2.7.3 品牌壁垒
2.7.4 渠道壁垒
2.8 消费趋势
2.8.1 品牌化
2.8.2 优质化
2.8.3 多元化
2.8.4 全面化
第三章 中国食用植物油行业发展环境
3.1 政策环境
3.1.1 监管政策
3.1.2 行业政策
3.2 上下游行业
3.2.1 上游行业
3.2.2 下游行业
第四章 中国食用植物油细分行业分析
4.1 豆油
4.1.1 简介
4.1.2 市场供需
4.1.3 竞争格局
4.1.4 价格走势
4.2 花生油
4.2.1 简介
4.2.2 市场供需
4.2.3 价格走势
4.3 菜籽油
4.3.1 简介
4.3.2 市场供需
4.3.3 价格走势
4.4 玉米油
4.4.1 简介
4.4.2 市场供需
4.4.3 价格走势
4.4.4 竞争格局
4.5 橄榄油
4.5.1 简介
4.5.2 市场供给
4.5.3 价格走势
4.6 棕榈油
4.6.1 简介
4.6.2 市场供需
4.6.3 价格走势
4.7 茶油
4.7.1 简介
4.7.2 上游行业
4.7.3 生产情况
4.7.4 市场需求
4.7.5 竞争格局
第五章 食用植物油主要企业
5.1 丰益国际
5.1.1 企业简介
5.1.2 经营情况
5.1.3 在华运营
5.2 中粮集团
5.2.1 企业简介
5.2.2 经营情况
5.2.3 食用植物油业务分析
5.3 鲁花集团
5.3.1 企业简介
5.3.2 经营情况
5.3.3 发展情况
5.4 西王食品
5.4.1 企业简介
5.4.2 经营情况
5.4.3 营收构成分析
5.4.4 毛利率分析
5.4.5 预测与展望
5.5 东凌粮油
5.5.1 企业简介
5.5.2 经营情况
5.5.3 营收构成分析
5.5.4 毛利率分析
5.5.5 客户和供应商分析
5.5.6 预测与展望
5.6 加加食品
5.6.1 企业简介
5.6.2 经营情况
5.6.3 营收构成分析
5.6.4 毛利率分析
5.6.5 投资分析
5.6.6客户和供应商分析
5.6.7 食用植物油业务分析
5.6.8 预测与展望
5.7 金健米业
5.7.1 企业简介
5.7.2 经营情况
5.7.3 营收构成分析
5.7.4 毛利率分析
5.7.5 食用植物油业务分析
5.7.6 预测与展望
5.8 长寿花食品
5.8.1 企业简介
5.8.2 经营情况
5.8.3 营收构成分析
5.8.4 毛利率分析
5.8.5 预测与展望
5.9 上海佳格
5.9.1 企业简介
5.9.2 经营情况
5.9.3 发展情况
5.10 湖南金浩
5.10.1 企业简介
5.10.2 经营情况
5.10.3 发展情况
5.11 汇福粮油
5.11.1 企业简介
5.11.2 经营情况
5.11.3 发展情况
5.12 中纺粮油
5.12.1 企业简介
5.12.2 发展情况
5.13 海狮油脂
5.13.1 企业简介
5.13.2 经营情况
5.13.3 发展情况
5.14 玉皇粮油
5.14.1 企业简介
5.14.2 经营情况
5.15 天津聚龙集团
5.15.1 企业简介
5.15.2 经营情况
5.15.3 发展情况
1. Overview of Edible Vegetable Oil Industry
1.1 Definition
1.2 Classification
2. Development of Edible Vegetable Oil Industry in China
2.1 Overview
2.2 Market Structure
2.3 Import & Export
2.3.1 Import
2.3.2 Export
2.4 Price Trends
2.5 Profit
2.6 Competitive Landscape
2.7 Entry Barriers
2.7.1 Access
2.7.2 Fund
2.7.3 Brand
2.7.4 Channel
2.8 Consumer Trends
2.8.1 Brand
2.8.2 High Quality
2.8.3 Diversification
2.8.4 Comprehensive
3. Development Environment of China Edible Vegetable Oil Industry
3.1 Policy Environment
3.1.1 Regulatory Policies
3.1.2 Industry Policies
3.2 Upstream and Downstream Sectors
3.2.1 Upstream
3.2.2 Downstream
4. Market Segments of China Edible Vegetable Oil Industry
4.1 Bean oil
4.1.1 Overview
4.1.2 Supply and Demand
4.1.3 Competitive Landscape
4.1.4 Price Trends
4.2 Peanut Oil
4.2.1 Overview
4.2.2 Supply and Demand
4.2.3 Price Trends
4.3 Rapeseed Oil
4.3.1 Overview
4.3.2 Supply and Demand
4.3.3 Price Trends
4.4 Corn Oil
4.4.1 Overview
4.4.2 Supply and Demand
4.4.3 Price Trends
4.4.4 Competitive Landscape
4.5 Olive Oil
4.5.1 Overview
4.5.2 Supply
4.5.3 Price Trends
4.6 Palm Oil
4.6.1 Overview
4.6.2 Supply and Demand
4.6.3 Price Trend
4.7 Camellia Oil
4.7.1 Overview
4.7.2 Upstream
4.7.3 Production
4.7.4 Demand
4.7.5 Competitive Landscape
5. Key Enterprises
5.1 Wilmar
5.1.1 Profile
5.1.2 Operation
5.1.3 Operation in China
5.2 COFCO
5.2.1 Profile
5.2.2 Operation
5.2.3 Edible Vegetable Oil Business
5.3 Luhua Group
5.3.1 Profile
5.3.2 Operation
5.3.3 Development
5.4 Xiwang Food
5.4.1 Profile
5.4.2 Operation
5.4.3 Revenue Structure
5.4.4 Gross Margin
5.4.5 Forecast and Outlook
5.5 Dongling Grain & Oil
5.5.1 Profile
5.5.2 Operation
5.5.3 Revenue Structure
5.5.4 Gross Margin
5.5.5 Customers and Suppliers
5.5.6 Forecast and Outlook
5.6 Jiajia Foodstuff
5.6.1 Profile
5.6.2 Operation
5.6.3 Revenue Structure
5.6.4 Gross Margin
5.6.5 Investment
5.6.6 Customers and Suppliers
5.6.7 Edible Vegetable Oil Business
5.6.8 Forecast and Outlook
5.7 Jinjian Cereals
5.7.1 Profile
5.7.2 Operation
5.7.3 Revenue Structure
5.7.4 Gross Margin
5.7.5 Edible Vegetable Oil Business
5.7.6 Forecast and Outlook
5.8 Changshouhua Food
5.8.1 Profile
5.8.2 Operation
5.8.3 Revenue Structure
5.8.4 Gross Margin
5.8.5 Forecast and Outlook
5.9 Shanghai Standard
5.9.1 Profile
5.9.2 Operation
5.9.3 Development
5.10 Hunan Jinhao
5.10.1 Profile
5.10.2 Operation
5.10.3 Development
5.11 Hopefull Grain & Oil
5.11.1 Profile
5.11.2 Operation
5.11.3 Development
5.12 Chinatex Grains and Oils
5.12.1 Profile
5.12.2 Development
5.13 Haishi Oils & Fats
5.13.1 Profile
5.13.2 Operation
5.13.3 Development
5.14 Yuhuang Grain & Oil
5.14.1 Profile
5.14.2 Operation
5.15 Julong Group
5.15.1 Profile
5.15.2 Operation
5.15.3 Development
表:中国主要食用植物油种类及特点(按原料)
图:2006-2012年中国食用植物油产量及增长率
图:2006-2012年中国食用植物油行业营业收入及增长率
图:2006-2012年中国食用植物油行业资产总额及流动资产
图:2011年中国食用植物油消费量结构(按品种)
图:2006-2012年中国食用植物油进口量
图:2006-2012年中国食用植物油进口额
图:2006-2012年中国食用植物油进口均价
图:2011年中国食用植物油进口结构(按国家或地区)
图:2011年中国食用植物油进口结构(按产品)
图:2011年中国食用植物油进口量前15企业进口量及占比
图:2006-2012年中国食用植物油出口量
图:2006-2012年中国食用植物油出口额
图:2006-2012年中国食用植物油出口均价
图:2011年中国食用植物油出口量前15企业出口量及占比
图:2010-2012年中国食用油批发价格指数(2008年12月=100)
图:2006-2012年中国食用植物油行业利润总额及增长率
图:2006-2012年中国食用植物油行业毛利率
表:2007-2012年中国主要企业食用植物油业务毛利率
图:2011年中国主要食用油企业小包装市场占有率
表:1998-2012年中国食用植物油行业主要监管政策
表:2007-2011年中国食用植物油主要行业政策
表:2011-2020年中国食用植物油行业发展规划
图:2011-2020年中国食用植物油加工业布局
图:1980-2011年中国人口总数
图:2001-2011年中国城镇居民人均可支配收入和农村居民家庭人均纯收入
图:2004-2011年中国农村、城镇居民人均食用植物油消费量
图:2011年中国、发达国家及世界平均人均食用油消费量
图:2008-2012年中国豆油产量
图:2008-2012年中国豆油进口量及出口量
图:2008-2012年中国豆油供应量及消费量
图:2008-2012年中国大豆压榨量
图:2011年中国前10大豆压榨企业产能占比
图:2010-2012年中国豆油现货平均价
图:2008-2012年中国一级豆油(散装)批发平均价
图:2006-2012年中国36个大中城市大豆油(散装)零售价
图:2008-2012年中国花生油产量
图:2008-2012年中国花生油进口量及出口量
图:2008-2012年中国花生油压榨量
图:2008-2012年中国花生油供应量及消费量
图:2009-2012年中国四级花生油现货平均价
图:2008-2012年中国花生油批发平均价
图:2006-2012年中国36个大中城市花生油(一级桶装)零售价
图:2008-2012年中国菜籽油压榨量
图:2008-2012年中国菜籽油产量
图:2008-2012年中国菜籽油进口量及出口量
图:2008-2012年中国菜籽油供应量及消费量
图:2008-2012年中国菜籽油(散装)批发平均价
图:2006-2012年中国36个大中城市菜籽油(散装)零售价
图:2008-2012年中国玉米油产量
图:2010-2012年吉林省长春市玉米油出厂价
表:2011-2012年中国一级玉米油现货价
图:2011-2012年河北辛集四级玉米油现货价
表:中国玉米油市场重点企业比较
表:橄榄油种类(按品质)、加工工艺及酸度
图:2007-2012年全球橄榄油产量
图:2008-2012年中国橄榄油进口量
图:2008-2012年中国橄榄油进口金额
图:2000-2012年全球橄榄油市场价格
图:2008-2012年中国橄榄油进口平均价格
表:截至2012年8月中国三种常见橄榄油终端售价
图:2007-2012年全球棕榈油产量
图:2007-2012年全球棕榈油食品及工业用量
图:2011/2012年全球棕榈油产量结构(按国家)
图:2007-2012年中国棕榈油进口量及消费量
图:2007-2012年中国棕榈油食品及工业用量
图:2008-2012年中国棕榈油期末库存量
图:2008-2012年中国棕榈油进口成本价及平均价
图:2008-2012年中国棕榈油批发平均价
图:2005-2010年中国油茶籽产量
图:2010年中国油茶籽产量构成(按地区)
表:中国茶油加工企业类型
图:2005-2020年中国茶油产量
图:2010年中国茶油消费占比及发达国家橄榄油消费占比
图:2008-2012年丰益国际营业收入及净利润
表:益海嘉里下属植物油企业及生产经营情况
表:益海嘉里食用植物油主要产品
图:2006-2011年中粮集团利润总额
表:中粮集团下属植物油企业及生产经营情况
表:2007-2009年鲁花集团财务指标
图:2009-2012年西王食品营业收入及净利润
图:2009-2012年西王食品营业收入构成(分产品)
表:2009-2012年西王食品营业收入构成(分地区)
表:2009-2012年西王食品毛利率(分产品)
图:2008-2011年西王食品玉米油销量
表:2011-2013年西王食品营业收入和净利润
图:2008-2012年东凌粮油营业收入及净利润
表:2009-2012年东凌粮油营业收入构成(分产品)
图:2008-2012年东凌粮油营业收入构成(分地区)
表:2008-2012年东凌粮油毛利率(分产品)
图:2009-2011年东凌粮油前五名客户贡献收入及占比
表:2011年东凌粮油前五名客户名称、贡献收入及收入占比
图:2009-2011年东凌粮油前五名供应商采购金额及占比
表:2011年东凌粮油前五名供应商名称、采购金额及采购占比
图:2006-2011年东凌粮油大豆压榨量
图:2009-2011年东凌粮油豆油及豆粕销量
图:2012年东凌粮油大豆压榨产能及投产日期
图:2012年东凌粮油油脂精炼项目产能
表:2011-2013年东凌粮油营业收入和净利润
图:2008-2012年加加食品营业收入及净利润
表:2008-2012年加加食品营业收入构成(分产品)
表:2008-2012年加加食品营业收入构成(分地区)
表:2008-2012年加加食品毛利率(分产品)
表:2012年加加食品拟在建项目
表:2011年加加食品产能及产能利用率
图:2008-2011年加加食品前五名客户贡献收入及占比
表:2011年加加食品前五名客户名称、贡献收入及收入占比
图:2008-2011年加加食品前五名供应商采购金额及占比
表:2011年加加食品前五名供应商名称、采购金额及采购占比
图:2008-2012年加加食品食用植物油业务营业收入及增长率
表:2011-2013年加加食品营业收入和净利润
图:2008-2012年金健米业营业收入及净利润
表:2008-2012年金健米业营业收入构成(分产品)
表:2008-2012年金健米业营业收入构成(分地区)
表:2008-2012年金健米业毛利率(分产品)
表:金健植物油下属油厂概况
表:2011-2013年金健米业营业收入和净利润
图:2008-2012年长寿花食品营业收入及净利润
图:2008-2012年长寿花食品营业收入构成(分产品)
图:2008-2012年长寿花食品营业收入构成(分地区)
表:2008-2012年长寿花食品毛利率(分产品)
表:2010-2012年长寿花食品主要产能
图:2008-2012年长寿花食品玉米油销量
表:2011-2013年长寿花食品营业收入和净利润
表:2007-2009年上海佳格财务指标
表:2007-2009年湖南金浩财务指标
表:2007-2009年汇福粮油精炼植物油公司财务指标
表:中纺粮油下属植物油企业及生产经营情况
表:2007-2009年海狮油脂财务指标
表:2007-2009年玉皇粮油财务指标
表:2007-2009年龙威粮油、聚龙粮油财务指标
Main Edible Vegetable Oil Varieties and Characteristics (by Raw Material) in China
Output and Growth Rate of Edible Vegetable Oil in China, 2006-2012
Revenue and Growth Rate of Edible Vegetable Oil Industry in China, 2006-2012
Total Assets and Current Assets of Edible Vegetable Oil Industry in China, 2006-2012
Consumption Structure of Edible Vegetable Oil in China (by Variety), 2011
Import Volume of Edible Vegetable Oil in China, 2006-2012
Import Value of Edible Vegetable Oil in China, 2006-2012
Average Import Price of Edible Vegetable Oil in China, 2006-2012
Import Structure of Edible Vegetable Oil in China (by Country/Region), 2011
Import Structure of Edible Vegetable Oil in China (by Product), 2011
Import Volume and % of Top 15 Edible Vegetable Oil Importers in China, 2011
Export Volume of Edible Vegetable Oil in China, 2006-2012
Export Value of Edible Vegetable Oil in China, 2006-2012
Average Export Price of Edible Vegetable Oil in China, 2006-2012
Export Volume and % of Top 15 Edible Vegetable Oil Exporters in China, 2011
Wholesale Price Index of Edible Oil in China, 2010-2012 (100 in Dec. 2008)
Total Profit and Growth Rate of Edible Vegetable Oil Industry in China, 2006-2012
Gross Margin of Edible Vegetable Oil Industry in China, 2006-2012
Gross Margin of Edible Vegetable Oil Business in China (by Enterprise), 2007-2012
Small-package Edible Oil Market Structure in China (by Enterprise), 2011
Main Regulatory Policies for Edible Vegetable Oil Industry in China, 1998-2012
Main Industry Policies for Edible Vegetable Oil Industry in China, 2007-2011
Development Plan of Edible Vegetable Oil Industry in China, 2011-2020
Layout of Edible Vegetable Oil Processing Industry in China, 2011-2020
Total Population of China, 1980-2011
Per Capita Disposable Income of Urban Residents and Per Capita Net Income of Rural Households in China, 2001-2011
Per Capita Edible Vegetable Oil Consumption of Rural and Urban Residents in China, 2004-2011
Per Capita Consumption of Edible Oil in China, Developed Countries and Worldwide, 2011
Output of Bean Oil in China, 2008-2012
Import Volume and Export Volume of Bean Oil in China, 2008-2012
Supply and Consumption of Bean Oil in China, 2008-2012
Volume of Soybean Squeezed in China, 2008-2012
Capacity Structure of Top 10 Soybean Squeezing Enterprises in China, 2011
Average Spot Price of Bean Oil in China, 2010-2012
Average Wholesale Price of Grade 1 (Bulk) Bean Oil in China, 2008-2012
Retail Price of (Bulk) Soybean Oil in 36 Medium and Large Cities of China, 2006-2012
Output of Peanut Oil in China, 2008-2012
Import Volume and Export Volume of Peanut Oil in China, 2008-2012
Volume of Peanut Oil Squeezed in China, 2008-2012
Supply and Consumption of Peanut Oil in China, 2008-2012
Average Spot Price of Grade 4 Peanut Oil in China, 2009-2012
Average Wholesale Price of Peanut Oil in China, 2008-2012
Retail Price of (Grade 1 Barrel-contained) Peanut Oil in 36 Medium and Large Cities of China, 2006-2012
Volume of Rapeseed Oil Squeezed in China, 2008-2012
Output of Rapeseed Oil in China, 2008-2012
Import Volume and Export Volume of Rapeseed Oil in China, 2008-2012
Supply and Consumption of Rapeseed Oil in China, 2008-2012
Average Wholesale Price of (Bulk) Rapeseed Oil in China, 2008-2012
Retail Price of (Bulk) Rapeseed Oil in 36 Medium and Large Cities of China, 2006-2012
Output of Corn Oil in China, 2008-2012
Factory Price of Corn Oil in Changchun, Jilin, 2010-2012
Spot Price of Grade 1 Corn Oil in China, 2011-2012
Spot Price of Grade 4 Corn Oil in Xinji, Hebei, 2011-2012
Comparison among Key Enterprises in Chinese Corn Oil Market
Varieties (by Quality), Processing Technology and Acidity of Olive Oil
Global Output of Olive Oil, 2007-2012
Import Volume of Olive Oil in China, 2008-2012
Import Value of Olive Oil in China, 2008-2012
Global Olive Oil Market Price, 2000-2012
Average Import Price of Olive Oil in China, 2008-2012
End-User Prices of Three Common Olive Oil Brands in China, Aug. 2012
Global Output of Palm Oil, 2007-2012
Global Food and Industrial Consumption of Palm Oil, 2007-2012
Global Palm Oil Output Structure (by Country), 2011/2012
Import Volume and Consumption of Palm Oil in China, 2007-2012
Food and Industrial Consumption of Palm Oil in China, 2007-2012
Ending Inventory of Palm Oil in China, 2008-2012
Cost Price and Average Price of Imported Palm Oil in China, 2008-2012
Average Wholesale Price of Palm Oil in China, 2008-2012
Output of Camellia Seed in China, 2005-2010
Output Structure of Camellia Seed in China (by Region), 2010
Camellia Oil Processing Enterprise Types in China
Output of Camellia Oil in China, 2005-2020
Share of Camellia Oil Consumption in China and Olive Oil Consumption in Developed Countries, 2010
Revenue and Net Income of Wilmar International Limited, 2008-2012
Vegetable Oil Subsidiaries, Production and Operation of Yihai Kerry
Main Edible Vegetable Oil Products of Yihai Kerry
Total Profit of COFCO, 2006-2011
Vegetable Oil Subsidiaries, Production and Operation of COFCO
Financial Indicators of Luhua Group, 2007-2009
Revenue and Net Income of Xiwang Food, 2009-2012
Revenue Structure of Xiwang Food (by Product), 2009-2012
Revenue Structure of Xiwang Food (by Region), 2009-2012
Gross Margin of Xiwang Food (by Product), 2009-2012
Sales Volume of Corn Oil of Xiwang Food, 2008-2011
Revenue and Net Income of Xiwang Food, 2011-2013
Revenue and Net Income of Dongling Grain & Oil, 2008-2012
Revenue Structure of Dongling Grain & Oil (by Product), 2009-2012
Revenue Structure of Dongling Grain & Oil (by Region), 2008-2012
Gross Margin of Dongling Grain & Oil (by Product), 2008-2012
Revenue of Dongling Grain & Oil from Top 5 Clients and % of Total Revenue, 2009-2011
Name List and Revenue Contribution of Top 5 Clients of Dongling Grain & Oil, 2011
Procurement of Dongling Grain & Oil from Top 5 Suppliers and % of Total Procurement, 2009-2011
Name List, Procurement and % of Total Procurement from Top 5 Suppliers of Dongling Grain & Oil, 2011
Volume of Soybean Squeezed by Dongling Grain & Oil, 2006-2011
Sales Volume of Bean Oil and Bean Meal of Dongling Grain & Oil, 2009-2011
Soybean Squeezing Capacity and Time to Production of Dongling Grain & Oil, 2012
Capacity of Oil and Grease Refining Projects of Dongling Grain & Oil, 2012
Revenue and Net Income of Dongling Grain & Oil, 2011-2013
Revenue and Net Income of Jiajia Food Group, 2008-2012
Revenue Structure of Jiajia Food Group (by Product), 2008-2012
Revenue Structure of Jiajia Food Group (by Region), 2008-2012
Gross Margin of Jiajia Food Group (by Product), 2008-2012
Projects under Planning/Construction of Jiajia Food Group, 2012
Capacity and Capacity Utilization Rate of Jiajia Food Group, 2011
Revenue of Jiajia Food Group from Top 5 Clients and % of Total Revenue, 2008-2011
Name List, Revenue Contribution and % of Total Revenue of Jiajia Food Group from Top 5 Clients, 2011
Procurement of Jiajia Food Group from Top 5 Suppliers and % of Total Procurement, 2008-2011
Name List, Procurement, and % of Total Procurement from Top 5 Suppliers of Jiajia Food Group, 2011
Revenue and Growth Rate of Edible Vegetable Oil Business of Jiajia Food Group, 2008-2012
Revenue and Net Income of Jiajia Food Group, 2011-2013
Revenue and Net Income of Hunan Jinjian Cereals Industry, 2008-2012
Revenue Structure of Hunan Jinjian Cereals Industry (by Product), 2008-2012
Revenue Structure of Hunan Jinjian Cereals Industry (by Region), 2008-2012
Gross Margin of Hunan Jinjian Cereals Industry (by Product), 2008-2012
Jinjian Vegetable Oil Plants
Revenue and Net Income of Hunan Jinjian Cereals Industry, 2011-2013
Revenue and Net Income of Changshouhua Food, 2008-2012
Revenue Structure of Changshouhua Food (by Product), 2008-2012
Revenue Structure of Changshouhua Food (by Region), 2008-2012
Gross Margin of Changshouhua Food (by Product), 2008-2012
Main Capacity of Changshouhua Food, 2010-2012
Sales Volume of Corn Oil of Changshouhua Food, 2008-2012
Revenue and Net Income of Changshouhua Food, 2011-2013
Financial Indicators of Shanghai Standard Foods, 2007-2009
Financial Indicators of Hunan Jinhao, 2007-2009
Financial Indicators of Vegetable Oil Refinery of Hopefull Grain & Oil, 2007-2009
Vegetable Oil Subsidiaries, Production and Operation of Chinatex Grains and Oils
Financial Indicators of Haishi Oils & Fats, 2007-2009
Financial Indicators of Yuhuang Grain & Oil , 2007-2009
Financial Indicators of Longwit Oils & Grains and Julong Oils & Grains, 2007-2009
如果这份报告不能满足您的要求,我们还可以为您定制报告,请 留言说明您的详细需求。
|