|
|
|
报告导航:研究报告—
生命科学—制药医疗
|
|
2012-2014年中国医疗专业工程行业研究报告 |
 |
字数:2.2万 |
页数:52 |
图表数:56 |
|
中文电子版:5000元 |
中文纸版:2500元 |
中文(电子+纸)版:5500元 |
|
英文电子版:1500美元 |
英文纸版:1600美元 |
英文(电子+纸)版:1800美元 |
|
编号:XJT021
|
发布日期:2012-10 |
附件:下载 |
 |
|
|
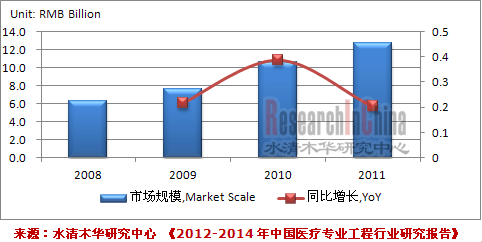
近年来,医疗专业工程行业快速发展,新建和改扩建高标准洁净手术室、ICU、化验室、实验室已成为医院发展建设中的重点之一。2011年,中国医疗专业工程市场规模约为127.7亿元,较上年同期增长23.9%;2008-2011年,中国医疗专业工程市场规模年均增长率达到26.7%。2015年,医疗专业工程市场规模将达到278.4亿元。 图:2008-2011年中国医疗专业工程市场规模及增长率

中国医疗专业工程行业起步较晚,多数企业从事装饰施工、部件生产等技术水平要求较低的业务,能为医疗机构提供一体化服务的企业较少。目前,中国仅尚荣医疗、新华医疗等少数几家企业具有较高的规划设计能力、施工能力、系统集成及软件开发能力,能为医疗机构提供医疗专业工程一体化服务。2011年,尚荣医疗市场占有率达到16.4%,毛利率达到27.1%。 《2012-2013年中国医疗专业工程行业研究报告》的内容主要包括以下几方面:- 中国医疗专业工程市场规模、市场结构、、利润水平、竞争格局、技术水平特点等;
- 中国医疗专业工程行业监管政策、行业政策、进入壁垒、上下游行业对其影响等;
- 中国医疗专业工程行业细分市场分析,包括洁净手术室市场、ICU等其他医疗专业工程市场发展及预测等;
- 国内外8家医疗专业工程企业的生产经营情况、投资并购、医疗专业工程业务及发展前景等。
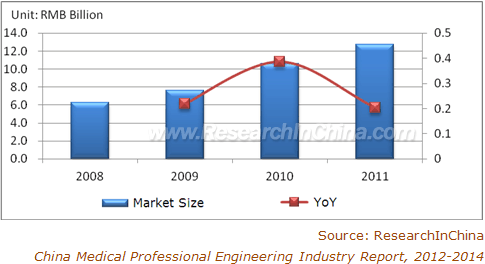
In recent years, the medical professional engineering industry has seen
rapid development, and the construction, reconstruction and expansion of
high-standard clean operating room, ICU and laboratory has already
turned into one of the priorities in hospital development. In 2011,
China’s medical professional engineering market size was approximately
RMB12.77 billion, a year-on-year increase of 23.9%, with AAGR in
2008-2011 up to 26.7%; in 2015, the market size will reach RMB27.84
billion. China’s Medical Professional Engineering Market Size and Growth Rate, 2008-2011

The
medical professional engineering industry started late in China, with
the majority of enterprises engaged in businesses with lower technical
requirements like decorative construction, parts production, etc., while
fewer capable of providing integrated services for medical
institutions. In nowadays China, merely a small number of enterprises,
such as Glory Medical and Shinva Medical, have relatively high
capabilities in planning & design, construction, system integration
and software development, and are able to offer medical organizations
integrated medical professional engineering services. In 2011, Glory
Medical enjoyed market share of 16.4% and gross margin of 27.1%. China Medical Professional Engineering Industry Report, 2012-2014 mainly covers the followings: Market size, market structure, profit, competitive landscape, technical level, etc.;  Supervisory policies, industrial policies, entry barriers, influence from upstream and downstream industries, etc.;  Analysis on market segments, including the development and forecasts of clean operating room market, ICU market, etc.;  Production,
operation, investment, merger & acquisition, medical professional
engineering business and development prospects of eight domestic and
foreign enterprises.
第一章 医疗专业工程行业概述
1.1 定义及分类
1.2 行业特点
第二章 中国医疗专业工程行业现状
2.1 市场规模
2.2 市场结构
2.3 竞争格局
2.4 利润水平
2.5 进入壁垒
2.5.1 市场准入壁垒
2.5.2 经验壁垒
2.5.3 技术与人才壁垒
2.5.4 资金壁垒
2.6 技术水平及特点
第三章 中国医疗专业工程行业发展环境
3.1 政策环境
3.1.1 监管政策
3.1.2 行业政策
3.2 上下游行业
3.2.1 上游行业
3.2.2 下游行业
第四章 中国医疗专业工程行业发展预测分析
4.1 洁净手术室市场规模预测
4.1.1 县医院和县级市医院新增洁净手术室市场规模
4.1.2 县级以外医院新增洁净手术室市场规模
4.1.3 改扩建洁净手术室市场规模
4.1.4 洁净手术室市场总规模
4.2 其他医疗专业工程(ICU等)市场规模预测
4.3 医疗专业工程市场总规模预测
第五章 医疗专业工程主要企业
5.1 尚荣医疗
5.1.1 企业简介
5.1.2 经营情况
5.1.3 营收构成分析
5.1.4 毛利率分析
5.1.5 客户分析
5.1.6 研发和投资分析
5.1.7 医疗专业工程业务分析
5.1.8 预测与展望
5.2 新华医疗
5.2.1 企业简介
5.2.2 经营情况
5.2.3 营收构成分析
5.2.4 毛利率分析
5.2.5 投资分析
5.2.6 医疗专业工程业务分析
5.2.7 预测与展望
5.3 羚亚国际
5.3.1 企业简介
5.3.2 发展情况
5.4 江苏久信
5.4.1 企业简介
5.4.2 经营情况
5.4.3 发展情况
5.5 迈奇股份
5.5.1 企业简介
5.5.2 经营情况
5.6 北京三医特
5.6.1 企业简介
5.6.2 发展情况
5.7 安徽中航
5.7.1 企业简介
5.7.2 经营情况
5.7.3 发展情况
5.8 苏州金叶
5.8.1 企业简介
5.8.2 经营情况
5.8.3 发展情况
1. Overview of Medical Professional Engineering Industry
1.1 Definition and Classification
1.2 Characteristics
2. Status Quo of China Medical Professional Engineering Industry
2.1 Market Size
2.2 Market Structure
2.3 Competitive Landscape
2.4 Profit
2.5 Entry Barriers
2.5.1 Market Access
2.5.2 Experience
2.5.3 Technology and Talents
2.5.4 Capital
2.6 Technical Level and Features
3. Development Environment of China Medical Professional Engineering Industry
3.1 Policy Environment
3.1.1 Supervisory Policies
3.1.2 Industrial Policies
3.2 Upstream and Downstream Industries
3.2.1 Upstream
3.2.2 Downstream
4. Development Prospects of China Medical Professional Engineering Industry
4.1 Market Size of Clean Operating Room
4.1.1 Market Size of New Clean Operating Rooms of County Hospitals and County-level City Hospitals
4.1.2 Market Size of New Clean Operating Rooms of Hospitals Excluding County-level Hospitals
4.1.3 Market Size of Reconstruction and Expansion of Clean Operating Rooms
4.1.4 Overall Market Size of Clean Operating Room
4.2 Market Size of ICU and Other Medical Professional Engineering Sectors
4.3 Overall Market Size of Medical Professional Engineering
5. Key Enterprises
5.1 Glory Medical
5.1.1 Profile
5.1.2 Operation
5.1.3 Revenue Structure
5.1.4 Gross Margin
5.1.5 Customers
5.1.6 R & D and Investment
5.1.7 Medical Professional Engineering Business
5.1.8 Forecasts and Outlook
5.2 Shinva Medical
5.2.1 Profile
5.2.2 Operation
5.2.3 Revenue Structure
5.2.4 Gross Margin
5.2.5 Investment
5.2.6 Medical Professional Engineering Business
5.2.7 Forecasts and Outlook
5.3 Bunstat International Group
5.3.1 Profile
5.3.2 Development
5.4 Jiangsu Jiuxin
5.4.1 Profile
5.4.2 Operation
5.4.3 Development
5.5 MAQUET
5.5.1 Profile
5.5.2 Operation
5.6 Beijing Centremed
5.6.1 Profile
5.6.2 Development
5.7 Anhui Zhonghang
5.7.1 Profile
5.7.2 Operation
5.7.3 Development
5.8 Suzhou Jinye
5.8.1 Profile
5.8.2 Operation
5.8.3 Development
图:2008-2011年中国医疗专业工程市场规模及增长率
图:2009-2011年中国医疗专业工程市场结构
图:中国医疗专业工程行业价值链环节企业数量
表:中国医疗专业工程行业主要企业及经营特点
表:2000-2012年中国医疗专业工程行业主要监管政策
表:2009-2012年中国医疗专业工程主要行业政策
图:2005-2011年中国医院诊疗数
图:2005-2011年中国医院入院人数
图:1980-2011年中国医疗卫生总费用
图:1985-2010年中国医疗卫生总费用占GDP比例
图:1980-2010年中国居民个人卫生支出总额
图:1990-2010年中国城镇与农村居民人均医疗保健支出
图:1990-2010年中国城镇与农村居民人均医疗保健支出占消费性支出比例
图:1980-2011年中国医院数量
图:2011年中国各类医院数量(按业务性质)
图:2011年中国各类医院数量(按等级)
图:2005-2010年中国县医院和县级市医院床位数
图:2005-2010年中国县医院和县级市医院入院人数
图:2005-2011年中国县级市(区)属医院病床使用率
表:2007-2015年中国县医院和县级市医院入院人数及增速
表:2007-2015年中国县医院和县级市医院床位数
图:2009-2015年中国县医院和县级市医院新增洁净手术室市场规模
图:2003-2011中国民营医院数量
图:中国公立医院收入结构变化方向
表:中国医院评级对病床数的要求
表:2006-2009年中国县级以外其他医院床位数
表:2007-2015年中国县级以外其他医院新增洁净手术室市场规模
图:2009-2015年中国改扩建洁净手术室市场规模
表:2009-2015年中国洁净手术室市场规模估算
表:2009-2015年中国医疗专业工程市场规模
图:2008-2012年尚荣医疗营业收入及净利润
图:2008-2012年尚荣医疗营业收入构成(分产品)
表:2008-2012年尚荣医疗营业收入构成(分地区)
表:2008-2011年尚荣医疗毛利率(分产品)
图:2008-2012年尚荣医疗前五名客户贡献收入及占比
表:2011年尚荣医疗前五名客户名称、贡献收入及收入占比
图:2008-2012年尚荣医疗研发支出及占营业收入比例
表:2011年尚荣医疗投资项目及金额
表:2011-2012年尚荣医疗新签医院整体建设项目
表:2011-2014年尚荣医疗营业收入和净利润
图:2008-2012年新华医疗营业收入及净利润
图:2008-2012年新华医疗营业收入构成(分产品)
图:2008-2012年新华医疗营业收入构成(分地区)
表:2008-2012年新华医疗毛利率(分产品)
表:2011年新华医疗投资项目及投资额
表:2011-2014年新华医疗营业收入和净利润
表:2007-2009年广东灵境医疗实业有限公司财务指标
表:2007年江苏久信财务指标
表:江苏久信主营业务及简介
表:洁定集团介绍
图:2007-2008年安徽中航营业收入及利润总额
图:2007-2008年安徽中航毛利率
图:2007-2008年安徽中航资产总额及负债总额
图:2008-2009年苏州金叶营业收入及利润总额
图:2008-2009年苏州金叶毛利率
图:2008-2009年苏州金叶资产总额及负债总额
China’s Medical Professional Engineering Market Size and Growth Rate, 2008-2011
China’s Medical Professional Engineering Market Structure, 2009-2011
Number of Value Chain Enterprises of China Medical Professional Engineering Industry
Operational Characteristics of Major Enterprises of China Medical Professional Engineering Industry
Major Supervisory Policies in China Medical Professional Engineering Industry, 2000-2012
Major Industrial Policies in China Medical Professional Engineering Industry, 2009-2012
Number of Hospital Diagnosis and Treatment in China, 2005-2011
Hospital Admission Number in China, 2005-2011
China’s Total Healthcare and Medical Costs, 1980-2011
China’s Total Healthcare and Medical Costs as Percentage of GDP, 1985-2010
Total Personal Hygiene Expenses of Chinese Residents, 1980-2010
Per Capita Healthcare Expenditure of China’s Urban and Rural Residents, 1990-2010
Per Capita Healthcare Expenditure of China’s Urban and Rural Residents as Percentage of Non-productive Expenditure, 1990-2010
Number of Hospitals in China, 1980-2011
Number of Hospitals in China (by Nature of Business), 2011
Number of Hospitals in China (by Grade), 2011
Number of Beds of County Hospitals and County-level City Hospitals in China, 2005-2010
Admission Number of County Hospitals and County-level City Hospitals in China, 2005-2010
Bed Utilization Rate of County-level City (District) Hospitals in China, 2005-2011
Admission Number and Growth Rate of County Hospitals and County-level City Hospitals in China, 2007-2015
Number of Beds of County Hospitals and County-level City Hospitals in China, 2007-2015
Market Size of New Clean Operating Room of County Hospitals and County-level City Hospitals in China, 2009-2015
Number of Private Hospitals in China, 2003-2011
Change in Revenue Structure of China’s Public Hospitals
Number of Beds Required by Hospital Ratings in China
Number of Beds of Hospitals Excluding County-level Hospitals in China, 2006-2009
Market Size of New Clean Operating Rooms of Hospitals Excluding County-level Hospitals in China, 2007-2015
Market Size of Reconstruction and Expansion of Clean Operating Rooms in China, 2009-2015
China’s Clean Operating Room Market Size, 2009-2015E
China’s Medical Professional Engineering Market Size, 2009-2015E
Revenue and Net Income of Glory Medical, 2008-2012
Revenue Structure of Glory Medical (by Product), 2008-2012
Revenue Structure of Glory Medical (by Region), 2008-2012
Gross Margin of Glory Medical (by Product), 2008-2011
Glory Medical’s Revenue from Top 5 Clients and % of Total Revenue, 2008-2012
Name List and Revenue Contribution of Glory Medical’s Top 5 Clients, 2011
R&D Costs and % of Total Revenue of Glory Medical, 2008-2012
Investment Projects and Amount of Glory Medical, 2011
Integrated Hospital Construction Projects Newly Signed by Glory Medical, 2011-2012
Revenue and Net Income of Glory Medical, 2011-2014
Revenue and Net Income of Shinva Medical, 2008-2012
Revenue Structure of Shinva Medical (by Product), 2008-2012
Revenue Structure of Shinva Medical (by Region), 2008-2012
Gross Margin of Shinva Medical (by Product), 2008-2012
Investment Projects and Investment Amount of Shinva Medical, 2011
Revenue and Net Income of Shinva Medical, 2011-2014
Financial Indicators of Guangdong Lingjing Medical Industrial, 2007-2009
Financial Indicators of Jiangsu Jiuxin, 2007
Main Business and Profile of Jiangsu Jiuxin
Introduction of Getinge Group
Revenue and Total Profit of Anhui Zhonghang, 2007-2008
Gross Margin of Anhui Zhonghang, 2007-2008
Total Assets and Total Liabilities of Anhui Zhonghang, 2007-2008
Revenue and Total Profit of Suzhou Jinye, 2008-2009
Gross Margin of Suzhou Jinye, 2008-2009
Total Assets and Total Liabilities of Suzhou Jinye, 2008-2009
如果这份报告不能满足您的要求,我们还可以为您定制报告,请 留言说明您的详细需求。
|