|
|
|
报告导航:研究报告—
制造业—化工
|
|
2012-2014年中国环氧乙烷产业研究报告 |
 |
字数:4.2万 |
页数:110 |
图表数:133 |
|
中文电子版:8000元 |
中文纸版:4000元 |
中文(电子+纸)版:8500元 |
|
英文电子版:2300美元 |
英文纸版:2400美元 |
英文(电子+纸)版:2600美元 |
|
编号:CYH003
|
发布日期:2012-10 |
附件:下载 |
 |
|
|
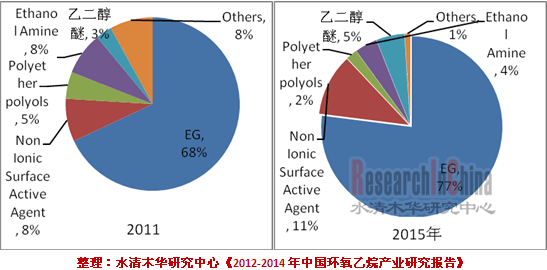
环氧乙烷(EO)是一种有机杂环类化合物,是乙烯工业衍生物中仅次于聚乙烯和聚氯乙烯的重要有机化工原料,已广泛应用于制造乙二醇,表面活性剂、聚羧酸减水剂、乙醇胺等。 2011年,世界环氧乙烷产能约为2750万吨,主要分布在亚太、北美、中东等地区;其消费量约为2250万吨,其亚洲等地消费需求最大。2005-2011年,中国环氧乙烷和商品环氧乙烷产能呈现逐年快速增长趋势,至2011年底,产能分别达到404.3万吨和165.3万吨,并且50%以上的产能分布在华东地区,这与原材料乙烯的供应分布特点相一致。2011年,中国乙烯产能的34.5%分布于华东地区,约为5282万吨;表观消费量为1633万吨。 当前国内环氧乙烷装置基本都联产乙二醇,2011年中国环氧乙烷消费量约260多万吨,其中乙二醇消耗环氧乙烷占68%左右,其次是非离子表面活性剂,占比约8%。随着应用广度和深度的拓展,预计2015年中国环氧乙烷消费量可达500万吨,2011-2015年均增速达17.5%。 图:2011与2015年中国环氧乙烷(分产品)消费结构
2011年,中国环氧乙烷前10名产能最大的企业变化不大,其当量产能最大的企业仍是镇海炼化,其产能是65万吨,占总产能的比例达到16.1%;其次是上海石化,产能占比为13.1%;其后分别是中沙天津、中海壳牌、扬子石化等。商品环氧乙烷产能排名略有变化,产能位居前三的分别是三江化工、扬子石化和上海石化。三江化工其商品环氧乙烷产能由2010年排名第3上升至2011年的排名第1,是中国最大的民营环氧乙烷生产商,同时也是最大的AEO表面活性剂生产企业。 水清木华研究中心《2012-2014年中国环氧乙烷产业研究报告》主要包括以下几个内容:- 全球及中国环氧乙烷行业供需分析、地区分布、进出口分析、市场价格、竞争格局等;
- 中国环氧乙烷上、下游(乙二醇、表面活性剂、高性能羧酸减水剂、多晶硅切割液、乙醇胺以及牛磺酸)产业发展现状、供需分析、竞争格局、市场价格、发展前景等;
- 中国8家环氧乙烷生产企业和7家深加工企业的运营状况、环氧乙烷业务分析及发展前景等
Ethylene oxide (EO) is an organic heterocyclic chemical ranking only
second to polyethylene (PE) and polyvinyl chloride (PVC) among ethylene
industrial derivatives, with extensive applications in the production of
ethylene glycol (EG), surfactant, polycarboxylate water reducer,
ethanolamine, etc. In 2011, the ethylene oxide capacity
approximated 27.5 million tons around the globe, mainly in Asia-Pacific,
North America, Middle East, etc.; the consumption reached 22.5 million
tons approximately, in particular, Asia featured the largest
consumption. During 2005-2011, the capacity of ethylene oxide and
commodity ethylene oxide presented rapid growth tendency in China, and
reached 4.043 million tons and 1.653 million tons respectively by the
end of 2011. Over 50% capacity was distributed in East China,
corresponding to the supply and distribution characteristics of raw
material ethylene. In 2011, 34.5% of China’s ethylene capacity was
distributed in East China, approximating 52.82 million tons; the
apparent consumption amounted to 16.33 million tons. At present,
the domestic EO facilities all co-produce ethylene glycol basically. In
2011, the consumption of EO in China approximated more than 2.6 million
tons, in particular, the EO consumed by ethylene glycol contributed 68%
or so, followed by nonionic surfactant, with share approximating 8%.
Along with the expansion of application width and depth, it is predicted
that consumption of EO will reach 5 million tons by 2015, with AAGR
between 2011-2015 hitting 17.5%. Consumption Structure of Ethylene Oxide in China by Product, 2011 and 2015E
In
2011, the ranking of the top 10 enterprises by EO capacity in China
remained basically the same. Ranked by equivalent EO capacity, Zhenhai
Refining & Chemical Company was still No.1 in 2011, accounting for
650,000 tons or 16.1% of the total capacity; the second place went to
Shanghai Petrochemical Company Limited, accounting for 13.1% of the
total capacity, followed by SINOPEC SABIC TianJin Petrochemical, CNOOC
and Shell Petrochemicals Company Limited and Yangzi Petrochemical
Company Limited. When ranked by the capacity of commodity EO, top three
companies were China Sanjiang Fine Chemicals Company Limited (ranking
3rd in 2010), Yangzi Petrochemical Company Limited and Shanghai
Petrochemical Company Limited. In particular, China Sanjiang Fine
Chemicals Company Limited is not only China’s largest privately-owned EO
producer, but also the largest AEO surfactant producer. This report mainly involves the following contents: 
Supply and demand, regional distribution, import and export, market
price, competition pattern of EO industry around the globe and in China;
Development status, demand and supply, competition pattern, market
price and development prospect of upstream and downstream (ethylene
glycol, surfactant, high performance polycarboxylate water reducer,
polysilicon cutting fluid, ethanolamine and taurine) of EO in China; Operation, EO business and development prospect of 8 EO manufacturers and 7 deep processing enterprises in China.
第一章 环氧乙烷概述
1.1 定义
1.2 生产技术
1.3 产业链
第二章 中国环氧乙烷行业发展概述
2.1 全球市场概况
2.1.1 供给分析
2.1.2 需求分析
2.2 中国市场供需
2.2.1 供给分析
2.2.2 需求分析
2.3 中国进出口分析
2.4 中国企业竞争格局
2.5 价格分析
第三章 环氧乙烷上游产业分析
3.1 乙烯
3.1.1 乙烯供给
3.1.2乙烯需求
3.1.3 乙烯进出口
3.2 乙醇
3.2.1 乙醇供给
3.2.2 乙醇需求
3.2.3进出口分析
第四章 环氧乙烷下游深加工分析
4.1 乙二醇
4.1.1 供给分析
4.1.2 需求分析
4.1.3 进出口
4.1.4 竞争格局
4.2 表面活性剂
4.2.1 供给分析
4.2.2 需求分析
4.2.3 进出口
4.2.4 竞争格局
4.3 高性能混凝土减水剂及聚醚单体
4.3.1 供给分析
4.3.2 需求分析
4.3.3 价格分析
4.3.4 竞争格局
4.3.5 发展前景
4.4 多晶硅切割液
4.4.1 发展概况
4.4.2 供需分析
4.4.3 竞争格局
4.5 乙醇胺
4.5.1供给分析
4.5.2 需求分析
4.6 牛磺酸
第五章 环氧乙烷生产企业分析
5.1 中石化镇海炼化
5.1.1 公司简介
5.1.2 经营情况
5.1.3 乙烯配套环氧乙烷项目
5.1.4 发展前景
5.2 上海石化
5.2.1 公司简介
5.2.2 经营情况
5.2.3 营收构成
5.2.4 毛利率
5.2.5 客户和供应商
5.2.6 研发与投资分析
5.2.7 产品产销量
5.2.8 中间石化产品业务
5.2.9 发展前景
5.3 扬子石油化工有限公司
5.3.1 公司简介
5.3.2 发展情况
5.4 中海壳牌石油化工有限公司
5.5 吉林石化
5.5.1 公司简介
5.5.2 环氧乙烷业务
5.6 杨子石化-巴斯夫有限责任公司
5.6.1 公司简介
5.6.2 经营情况
5.6.3 发展前景
5.7 中国兵器工业集团
5.7.1 公司简介
5.7.2 发展前景
5.7.3 华锦集团
5.7.4 辽宁北方化学工业公司
5.8 三江精细化工有限公司
5.8.1 公司简介
5.8.2 经营情况
5.8.3 营收构成
5.8.4 毛利率分析
5.8.5 客户和供应商分析
5.8.6 环氧乙烷业务
5.8.7 发展前景
第六章 环氧乙烷深加工企业分析
6.1 辽宁华兴集团股份有限公司
6.1.1 公司简介
6.1.2 经营情况
6.1.3 发展前景
6.2 沙索(中国)化学有限公司
6.2.1 公司简介
6.2.2 经营情况
6.2.3 发展前景
6.3 辽宁奥克化学股份有限公司
6.3.1 公司简介
6.3.2 经营情况
6.3.3 营收构成
6.3.4 毛利率分析
6.3.5 投资分析
6.3.6 客户和供应商
6.3.7 发展前景
6.4 辽宁科隆化工实业公司
6.4.1 公司简介
6.4.2 经营情况
6.4.3 营收构成
6.4.4 毛利率分析
6.4.5 研发与投资分析
6.4.6 客户和供应商分析
6.4.7 环氧乙烷衍生物
6.4.8 减水剂业务
6.4.9 发展前景
6.5 江苏苏博特新材料有限公司
6.5.1 公司简介
6.5.2 减水剂业务
6.6 厦门市建筑科学研究院集团股份有限公司
6.6.1 公司简介
6.6.2 经营情况
6.6.3 营收构成
6.6.4 毛利率分析
6.6.5 研发与投资分析
6.6.6 减水剂业务
6.6.7 发展前景
6.7 潜江永安药业股份有限公司
6.7.1 公司简介
6.7.2 经营情况
6.7.3 营收构成
6.7.4 毛利率分析
6.7.5 研发与投资分析
6.7.6 客户和供应商分析
6.7.7 产销量
6.7.8 发展前景
1. Ethylene Oxide (EO) Overview
1.1 Definition
1.2 Production Technology
1.3 Industry Chain
2. China EO Industry Development Overview
2.1 Global Market
2.1.1 Supply
2.1.2 Demand
2.2 China Market
2.2.1 Supply
2.2.2 Demand
2.3 China Import and Export
2.4 China Competition Pattern
2.5 Price
3. EO Upstream
3.1 Ethylene
3.1.1 Supply
3.1.2 Demand
3.1.3 Import and Export
3.2 Ethanol
3.2.1 Supply
3.2.2 Demand
3.2.3 Import and Export
4. Downstream Deep Processing of EO
4.1 Glycol
4.1.1 Supply
4.1.2 Demand
4.1.3 Import and Export
4.1.4 Competition Pattern
4.2 Surfactant
4.2.1 Supply
4.2.2 Demand
4.2.3 Import and Export
4.2.4 Competition Pattern
4.3 High Performance Concrete Water Reducer and Polyether Monomer
4.3.1 Supply
4.3.2 Demand
4.3.3 Price
4.3.4 Competition Pattern
4.3.5 Development Prospect
4.4 Polysilicon Cutting Fluid
4.4.1 Overview
4.4.2 Supply and Demand
4.4.3 Competition Pattern
4.5 Ethanolamine
4.5.1 Supply
4.5.2 Demand
4.6 Taurine
5. Key EO Manufacturers
5.1 Sinopec Zhenhai Refining & Chemical Company
5.1.1 Profile
5.1.2 Operation
5.1.3 Ethylene Supporting Ethylene Oxide Project
5.1.4 Development Prospect
5.2 Sinopec Shanghai Petrochemical Company
5.2.1 Profile
5.2.2 Operation
5.2.3 Revenue Structure
5.2.4 Gross Margin
5.2.5 Client and Supplier
5.2.6 R&D and Investment
5.2.7 Output and Sales Volume
5.2.8 Intermediate Petrochemical Product Business
5.2.9 Development Prospect
5.3 Sinopec Yangzi Petrochemical Company
5.3.1 Profile
5.3.2 Development
5.4 CNOOC and Shell Petrochemicals Company Limited
5.5 Jilin Petrochemical
5.5.1 Profile
5.5.2 EO Business
5.6 BASF-YPC Company Limited
5.6.1 Profile
5.6.2 Operation
5.6.3 Development Prospect
5.7 China North Industries Group Corporation (CNGC)
5.7.1 Profile
5.7.2 Development Prospect
5.7.3 Liaoning Huajin Chemical Industry Group (CNGC Huajin Chemicals)
5.7.4 CNGC China North Chemical Industries (Group) Co., Ltd.
5.8 China Sanjiang Fine Chemicals Company Limited
5.8.1 Profile
5.8.2 Operation
5.8.3 Revenue Structure
5.8.4 Gross Margin
5.8.5 Client and Supplier
5.8.6 EO Business
5.8.7 Development Prospect
6. EO Deep Processing Enterprises
6.1 Liaoning Huaxing Group
6.1.1 Profile
6.1.2 Operation
6.1.3 Development Prospect
6.2 Sasol (China) Chemical Co., Ltd.
6.2.1 Profile
6.2.2 Operation
6.2.3 Development Prospect
6.3 Liaoning Oxiranchem, Inc.
6.3.1 Profile
6.3.2 Operation
6.3.3 Revenue Structure
6.3.4 Gross Margin
6.3.5 Investment
6.3.6 Client and Supplier
6.3.7 Development Prospect
6.4 Liaoning Kelong Fine Chemical Co., Ltd.
6.4.1 Profile
6.4.2 Operation
6.4.3 Revenue Structure
6.4.4 Gross Margin
6.4.5 R&D and Investment
6.4.6 Client and Supplier
6.4.7 EO Derivatives
6.4.8 Water Reducer Business
6.4.9 Development Prospect
6.5 Jiangsu Sobute New Materials Co., Ltd.
6.5.1 Profile
6.5.2 Water Reducer Business
6.6 Xiamen Academy of Building Research Group
6.6.1 Profile
6.6.2 Operation
6.6.3 Revenue Structure
6.6.4 Gross Margin
6.6.5 R&D and Investment
6.6.6 Water Reducer Business
6.6.7 Development Prospect
6.7 Qianjiang Yongan Pharmaceutical
6.7.1 Profile
6.7.2 Operation
6.7.3 Revenue Structure
6.7.4 Gross Margin
6.7.5 R&D and Investment
6.7.6 Client and Supplier
6.7.7 Output and Sales Volume
6.7.8 Development Prospect
图:环氧乙烷产业链
图:2006-2012年全球环氧乙烷产能
图:全球环氧乙烷(分地区)产能占比
图:2007-2012年全球环氧乙烷需求量
图:2011年全球环氧乙烷(分领域)消费占比
图:2005-2012年中国环氧乙烷和商品环氧乙烷产能
图:2011年中国(分地区)环氧乙烷和商品环氧乙烷产能占比
图:2011与2015年中国环氧乙烷(分产品)消费结构
表:2006-2012年中国环氧乙烷进出口数量及金额
图:2011年中国环氧乙烷(分企业)产能占比
表:2011年中国环氧乙烷和商品环氧乙烷(分企业/分地区)产能
表:2012-2015年中国商品环氧乙烷新增加生产能力和投产日期
图:2006-2012年中国环氧乙烷市场价格
图:2006-2012年中国乙烯产量
图:2011年中国乙烯(分地区)产能占比
图:2011年中国乙烯(分企业)产能占比
表:2011年中国乙烯(分企业)产能和产量
图:2006-2012年中国乙烯表观消费量
表:2006-2011年中国乙烯进出口
表:2011年中国乙烯(分国家)进口量及占比
表:2005-2011年中国乙醇(分地区)产能
图:2005-2011年中国乙醇(分地区)产量
表:2011年中国乙醇生产企业地区分布
图:2011年中国乙醇(分产品)需求占比
图:2011年中国乙醇(分税号)出口量
图:2011年中国乙醇(分国家/地区)出口占比
图:2005-2012年中国乙二醇产量
图:2011年中国乙二醇(分用途)消费量占比
图:2011年中国乙二醇(分国家和地区)进口量占比
图:2011年中国乙二醇(分企业)产能占比
表:2012-2015年中国乙二醇拟在建和在建项目
图:2006-2010年中国表面活性剂产量及同比增长
表:2009年中国表面活性剂细分产品产量及占比
图:2005-2010年中国AEO产量及其占比
图:2006-2010年中国表面活性剂表观消费量及同比增长
图:2006-2012年中国表面活性剂进出口量
图:2006-2011年中国表面活性剂进出口单价
图:2009年中国AEO主要生产商市场份额(按产量)
图:2005-2012年中国聚羧酸减水剂产量
表:2011年中国前10名聚羧酸减水剂生产企业产能、销量和市场占有率
图:2011年中国减水剂用聚醚单体(分产品)市场份额
图:2007-2012年中国聚羧酸减水剂消费量
图:2007-2012年中国减水剂用聚醚单体消费量
图:2009-2012年中国聚醚单体(分产品)市场价格
图:2010年中国减水剂用聚醚单体企业市场份额
表:2010-2015年中国聚羧酸减水剂产量
图:晶硅切割液在光伏产业链中的位置
图:2007-2014年全球及中国硅片产量
图:2010年中国多晶硅切割液前5名企业市场份额
表:2000-2011年中国乙醇胺产量和进出口量
表:2008-2013年中国乙醇胺(分企业)产能
图:2005-2012年中国乙醇胺消费量
表:2007-2015年全球牛磺酸供需表
图:2009年全球牛磺酸主要生产国产量占比
表:2009年中国牛磺酸生产企业产量及占比
表:2011年中国环氧乙烷及商品环氧乙烷前10名企业产能及占比
表:镇海炼化(分产品)产能
表:镇海炼化100万吨/年乙烯工程配套装置及产能
表:2011年上海石化拥有50%以上权益的子公司分布
图:2008-2012年上海石化营业收入和净利润
图:2010-2012年上海石化(分产品)营业收入
表:2010-2012年上海石化(分地区)营业收入
表:2010-2012年上海石化(分产品)毛利率
表:2011年上海石化前5名供应商和前5名客户名单
表:2009-2011年上海石化研发支出及占比
表:截止2011年底上海石化在建项目
表:2011年上海石化(分产品)产能
图:2009-2011年上海石化(分产品)销量
表:2010-2012年上海石化(分产品)产量
图:2007-2012年上海石化中间石化产品销售量和销售净额
表:截止2012年6月杨子石化(分产品)产能
表:2011年中海壳牌公司主要产品产能
表:截止2012年6月扬子-巴斯夫公司(分产品)产能
图:2007-2011年扬巴公司销售收入
图:三江化工公司发展历程
图:2007-2012年三江化工营业收入和净利润
图:2007-2012年三江化工(分产品)营业收入构成
图:2009-2012年三江化工(分产品)销量
图:2009-2012年三江化工(分产品)毛利率
表:2009-2011年三江化工前5名客户营业收入合计贡献占比和前5名供应商采购金额合计占比
图:2007-2012年三江化工环氧乙烷产销量
图:2010-2012年三江化工环氧乙烷毛利率
表:2007-2014年三江化工环氧乙烷产能
表:2011年华兴集团主要产品产能
表:2008年华兴集团经营情况
图:2007-2008年沙索(中国)营业收入和利润总额
表:2011年沙索(中国)(分产品)产能
表:2011年奥克股份子公司分布
图:奥克股份业务定位图
图:2008-2012年奥克股份营业收入和净利润
图:2007-2012年奥克股份(分产品)销量
表:2008-2012年奥克股份(分产品)营业收入
表:2011-2012年奥克股份(分地区)营业收入
图:2008-2012年奥克股份(分产品)毛利率
图:2012上半年奥克股份(分产品)毛利润构成
表:截止2012年6月底奥克股份重大建设项目
表:2009-2011年奥克股份研发费用及占比
表:2009-2011年奥克股份前5名供应商合计采购金额占比及前5客户营业收入合计贡献占比
表:2011年奥克股份公司前5名客户名称、营业收入贡献及占比
表:2011年奥克股份环氧乙烷衍生物产品产能
表:2010-2014年奥克股份(分产品)产能
图:2009-2011年科隆化工营业收入和净利润
图:2009-2011年科隆化工(分产品)营业收入
表:2009-2011年科隆公司(分地区)营业收入及占比
表:2009-2011年科隆化工(分产品)毛利和毛利率
表:2009-2011年科隆化工研发费用及占比
表:截止2011年12月底科隆化工建设项目
表:2009-2011年科隆化工前5名客户名称、营业收入贡献及占比
表:2009-2011年科隆化工前5名供应商名称、采购金额及占比
表:2009-2011年科隆化工环氧乙烷衍生物产品产量、产能和产能利用率
图:2009-2011年科隆化工环氧乙烷衍生物(分产品)销量
表:2009-2011年科隆化工聚羧酸减水剂产品产量、产能和产能利用率
表:2009-2014年科隆化工(分产品)产能
表:江苏苏博特高性能减水剂名称及型号
表:苏博特公司(分产品)产能
图:2008-2012年建研集团营业收入和净利润
图:2007-2012年建研集团(分产品)营业收入
表:2011-2012年建研集团(分地区)营业收入
图:2008-2012年建研集团(分产品)毛利率
表:2009-2011年建研集团研发费用及占比
图:2008-2012年建研集团外加剂产能及总产销量
表:截止2012年7月建研集团(分地区/分类别)减水剂产能分布
表:2012年建研集团外加剂产品子公司分布及企业扩张进展
图:2008-2012年永安药业营业收入和净利润
表:2008-2012年永安药业(分产品)营业收入
图:2008-2012年永安药业(分地区)营业收入
图:2008-2012年永安药业(分产品)毛利率
表:2009-2011年永安药业研发投入及占比
表:截止2012年6月底,永安药业重大项目建设
表:2007-2011年永安药业前5名供应商合计采购金额占比及前5名客户合计营业收入占比
图:2007-2012年永安药业牛磺酸产销量
表:2007-2014年永安药业牛磺酸产品产能
表:2010-2014年永安药业(分产品)产能
EO Industrial Chain
Global EO Capacity, 2006-2012
EO Capacity Structure Worldwide by Region
Global EO Demand, 2007-2012
EO Consumption Structure Worldwide by Field, 2011
EO and Commodity EO Capacity in China, 2005-2012
Capacity Structure of EO and Commodity EO in China by Region, 2011
Consumption Structure of EO in China by Product, 2011 and 2015E
EO Import & Export Volume and Value in China, 2006-2012
Capacity Structure of EO in China by Enterprise, 2011
Capacity of EO and Commodity EO in China by Enterprise/Region, 2011
Newly Added Capacity of Commodity EO in China and Time to Production, 2012-2015E
Market Price of EO in China, 2006-2012
Ethylene Output in China, 2006-2012
Capacity Structure of Ethylene in China by Region, 2011
Capacity Structure of Ethylene in China by Enterprise, 2011
Capacity and Output of Ethylene in China by Enterprise, 2011
Apparent Consumption of Ethylene in China, 2006-2012
Ethylene Import and Export in China, 2006-2011
Import Volume and Structure of Ethylene in China by Country, 2011
Ethanol Capacity in China by Region, 2005-2011
Ethanol Output in China by Region, 2005-2011
Regional Distribution of Ethanol Manufacturers in China, 2011
Demand Structure of Ethanol in China by Product, 2011
Export Volume of Ethanol in China by TFN, 2011
Export Structure of Ethanol in China by Country/Region, 2011
Ethylene Glycol Output in China, 2005-2012
Consumption Structure of Ethylene Glycol in China by Application, 2011
Import Volume Structure of Ethylene Glycol in China by Country/Region, 2011
Capacity Structure of Ethylene Glycol in China by Enterprise, 2011
Ethylene Glycol Projects Under Planning/Constructionin China, 2012-2015E
Output of Surfactant in China and YoY Growth, 2006-2010
Output and Proportion of Surfactant in China by Product, 2009
AEO Output and Its Proportion in China, 2005-2010
Apparent Consumption of Surfactant in China and YoY Growth, 2006-2010
Import and Export Volume of Surfactant in China, 2006-2012
Import and Export Unit Price of Surfactant in China, 2006-2011
Market Share of Major AEO Manufacturers in China by Output, 2009
Output of Polycarboxylate Water Reducer in China, 2005-2012
Capacity, Sales Volume and Market Share of Top 10 Polycarboxylate Water Reducer Manufacturers in China, 2011
Market Share of Polyether Monomer for Water Reducer in China by Product, 2011
Consumption of Polycarboxylate Water Reducer in China, 2007-2012
Consumption of Polyether Monomer for Water Reducer in China, 2007-2012
Market Price of Polyether Monomer in China by Product, 2009-2012
Market Share of Polyether Monomer for Water Reducer in China, 2010
Polycarboxylic Water Reducer Output in China, 2010-2015E
Position of Crystalline Silicon Cutting Fluid in PV Industrial China
Output of Silicon Wafer Worldwide and in China, 2007-2014E
Market Share of Top 5 Enterprises of Polycrystalline Silicon Cutting Fluid in China, 2010
Ethanolamine Output and Import & Export Volume in China, 2000-2011
Ethanolamine Capacity in China by Enterprise, 2008-2013E
Ethanolamine Consumption in China, 2005-2012
Supply and Demand of Taurine Worldwide, 2007-2015E
Global Taurine Output by Country, 2009
Taurine Output in China by Enterprise, 2009
Capacity and Proportion of Top 10 Enterprises of EO and Commodity EO in China, 2011
Capacity of ZRCC by Product
Supporting Facilities and Capacity of ZRCC’s 1000 kt/a Ethylene Project
Distribution of Shanghai Petrochemical Company’s Subsidiaries with Equity over 50%, 2011
Revenue and Net Income of Shanghai Petrochemical Company, 2008-2012
Revenue of Shanghai Petrochemical Company by Product, 2010-2012
Revenue of Shanghai Petrochemical Company by Region, 2010-2012
Gross Margin of Shanghai Petrochemical Company by Product, 2010-2012
Top 5 Suppliers and Top 5 Customers of Shanghai Petrochemical Company, 2011
R&D Investment and % of Shanghai Petrochemical Company, 2009-2011
Projects under Construction of Shanghai Petrochemical Company (as of end of 2011)
Capacity of Shanghai Petrochemical Company by Product, 2011
Sales Volume of Shanghai Petrochemical Company by Product, 2009-2011
Output of Shanghai Petrochemical Company by Product, 2010-2012
Sales Volume and Net Sales of Intermediate Chemical Products Made by Shanghai Petrochemical Company, 2007-2012
Capacity of Yangzi Petrochemical Company by Product (as of Jun. 2012)
Capacity of Major Products Made by CNOOC and Shell Petrochemicals Company, 2011
Capacity of BASF-YPC by Product (as of Jun. 2012)
Sales of BASF-YPC, 2007-2011
Development Histroy of China Sanjiang Fine Chemicals
Revenue and Net Income of China Sanjiang Fine Chemicals, 2007-2012
Revenue Structure of China Sanjiang Fine Chemicals by Product, 2007-2012
Sales Volume of China Sanjiang Fine Chemicals by Product, 2009-2012
Gross Margin of China Sanjiang Fine Chemicals by Product, 2009-2012
Proportions of China Sanjiang Fine Chemicals’ Revenue from Top 5 Customers and Procurement from Top 5 Suppliers, 2009-2011
Output and Sales Volume of EO of China Sanjiang Fine Chemicals, 2007-2012
Gross Margin of EO of China Sanjiang Fine Chemicals, 2010-2012
EO Capacity of China Sanjiang Fine Chemicals, 2007-2014E
Capacity of Major Products Made by Huaxing Group, 2011
Operation of Huaxing Group, 2008
Revenue and Total Profits of Sasol (China), 2007-2008
Capacity of Sasol (China) by Product, 2011
Distribution of Oxiranchem’s Subsidiaries, 2011
Business Orientation of Oxiranchem
Revenue and Net Income of Oxiranchem, 2008-2012
Sales Volume of Oxiranchem by Product, 2007-2012
Revenue of Oxiranchem by Product, 2008-2012
Revenue of Oxiranchem by Region, 2011-2012
Gross Margin of Oxiranchem by Product, 2008-2012
Gross Profit Structure of Oxiranchem by Product, H1 2012
Key Construction Projects of Oxiranchem (as of end of Jun. 2012)
R&D Investment and % of Oxiranchem, 2009-2011
Proportions of Oxiranchem's Procurement from Top 5 Suppliers and Revenue from Top 5 Customers, 2009-2011
Name List, Revenue Contribution and % of Top 5 Customers of Oxiranchem, 2011
Capacity of EO Derivatives Made by Oxiranchem, 2011
Capacity of Oxiranchem by Product, 2010-2014E
Revenue and Net Income of Kelong, 2009-2011
Revenue of Kelong by Product, 2009-2011
Revenue and Proportion of Kelong by Region, 2009-2011
Gross Profit and Gross Margin of Kelong by Product, 2009-2011
R&D Investment and % of Kelong, 2009-2011
Construction Projects of Kelong (as of Dec. 2011)
Name List, Revenue Contribution and % of Top 5 Customers of Kelong, 2009-2011
Name List, Procurement Amount and % of Top 5 Suppliers of Kelong, 2009-2011
Output, Capacity and Capacity Utilization of EO Derivatives Made by Kelong, 2009-2011
EO Derivative Sales Volume of Kelong by Product, 2009-2011
Output, Capacity and Capacity Utilization of Polycarboxylic Water Reducers Made by Kelong, 2009-2011
Capacity of Kelong by Product, 2009-2014E
Names and Models of High-Performance Water Reducers Made by Jiangsu Sobute New Materials
Capacity of Jiangsu Sobute New Materials by Product
Revenue and Net Income of Building Research Group, 2008-2012
Revenue of Building Research Group by Product, 2007-2012
Revenue of Building Research Group by Region, 2011-2012
Gross Margin of Building Research Group by Product, 2008-2012
R&D Investment and % of Building Research Group, 2009-2011
Additive Capacity, Total Output and Sales Volume of Building Research Group, 2008-2012
Water Reducer Capacity Distribution of Building Research Group by Region/Category (as of Jul. 2012)
Distribution of Additive Subsidiaries and Enterprise Expansion Progress of Building Research Group, 2012
Revenue and Net Income of Yongan Pharmaceutical, 2008-2012
Revenue of Yongan Pharmaceutical by Product, 2008-2012
Revenue of Yongan Pharmaceutical by Region, 2008-2012
Gross Margin of Yongan Pharmaceutical by Product, 2008-2012
R&D Investment and % of Yongan Pharmaceutical, 2009-2011
Key Project Construction of Yongan Pharmaceutical (as of the end of Jun. 2012)
Proportions of Yongan Pharmaceutical's Procurement from Top 5 Suppliers and Revenue from Top 5 Customers, 2007-2011
Taurine Output and Sales Volume of Yongan Pharmaceutical, 2007-2012
Taurine Capacity of Yongan Pharmaceutical, 2007-2014E
Capacity of Yongan Pharmaceutical by Product, 2010-2014E
如果这份报告不能满足您的要求,我们还可以为您定制报告,请 留言说明您的详细需求。
|