|
|
|
报告导航:研究报告—
农业与食品—食品饮料
|
|
2012-2014年中国制糖行业研究报告 |
 |
字数:2.6万 |
页数:67 |
图表数:76 |
|
中文电子版:6500元 |
中文纸版:3250元 |
中文(电子+纸)版:7000元 |
|
英文电子版:1700美元 |
英文纸版:1800美元 |
英文(电子+纸)版:2000美元 |
|
编号:HK023
|
发布日期:2012-11 |
附件:下载 |
 |
|
|
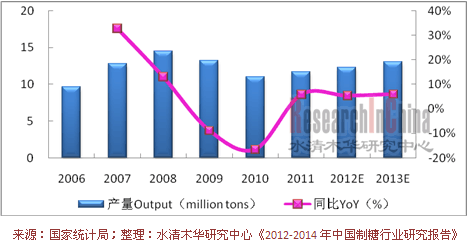
制糖行业是以甘蔗、甜菜为原料制作成品糖的工业,产品主要应用于食品&饮料工业。2011年全球食糖产量为1.6亿吨,主要分布在巴西、印度、欧盟和中国。巴西是全球最大的食糖生产国和出口国,2011年其食糖产量占全球总产量的23.8%。 中国是全球食糖主要生产国和消费国之一,2011年中国食糖产量居世界第三位,消费量居世界第二位。中国主要的制糖原料是甘蔗,甘蔗糖产量占比达90%以上。2011年,中国食糖产量为1170万吨,同比增长5.8%。中国食糖产地主要为广西、云南和广东,三地区食糖产量占全国总产量的85%左右。 图:2006-2013E中国食糖产量及同比增长

从食糖消费来看,随着中国居民生活水平的不断提高以及食品、饮料等主要用糖行业的快速发展,近几年中国食糖消费来一直维持在1400万吨左右。2011年,中国食糖表观消费量达1460万吨,由于产量不足,中国进口食糖290万吨,同比增长65.3%。 中国制糖生产企业主要包括南宁糖业、贵糖股份、中粮屯河等。2011-2012年,由于中国甘蔗收购成本上升以及食糖价格下跌压缩了企业的利润空间,多数制糖企业利润出现下滑。以南宁糖业为例:2011年,公司实现营业收入42.2亿元,同比增长9.0%;实现净利润4540万元,同比下降73.5%。2012年上半年,公司亏损4410万元。 水清木华研究中心《2012-2014年中国制糖行业研究报告》主要包括以下几个内容:- 全球制糖行业供需分析、主要生产国食糖产量及进出口分析;
- 中国制糖行业相关政策、市场规模、供需分析、价格走势、进出口分析等;
- 中国上游甘蔗及甜菜种植业播种面积、产量分析、价格走势等;
- 中国下游饮料、糖果、糕点、乳制品行业需求分析;
- 中国11家制糖企业的运营状况、子公司、制糖业务分析及发展情况等。
The sugar industry takes sugarcane and sugar beet as raw materials to
manufacture finished sugar products which find application in food &
beverage sectors. In 2011, the global sugar output amounted to 160
million tons and was mainly distributed in Brazil, India, the European
Union and China. Brazil, the world’s largest sugar producer and
exporter, boasted 23.8% of the global sugar output in 2011. As
one of the major producers and consumers of sugar, China ranked the
global No. 3 and No. 2 in sugar output and consumption respectively in
2011. Sugarcane serves as principal raw material for sugar production
and contributes more than 90% to the sugar output. In 2011, the output
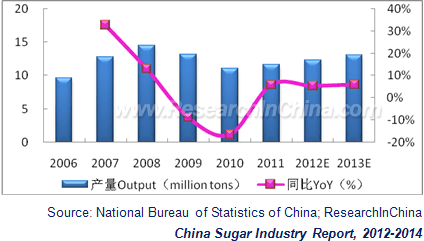
of China’s sugar grew by 5.8% YoY to 11.7 million tons. The main
producing areas of sugar are Guangxi, Yunnan and Guangdong which
together account for about 85% of the country’s total output. Output and YoY Growth Rate of Sugar in China, 2006-2013E

With
respect to sugar consumption, the rising living standards of Chinese
residents and the rapid progress of sugar-consuming industries such as
food and beverage sectors have empowered the sugar consumption in China
to stay at approximately 14 million tons in recent years. In 2011, the
apparent consumption of sugar in China got to 14.6 million tons; due to
the fact that the sugar output failed to meet the demand, China imported
2.9 million tons of sugar, up 65.3% year-on-year. The leading
sugar manufacturers in China include Nanning Sugar Industry Co., Ltd.,
Guangxi Guitang (Group) Co., Ltd. and COFCO Tunhe Co., Ltd., etc. In
2011-2012, as increased purchasing costs of sugarcane and falling sugar
price shrank profit margins of the enterprises, the majority of sugar
producers suffered a declining profit. Taking Nanning Sugar Industry for
example, the revenue of the company rose by 9.0% YoY to RMB4.22
billion, and its net income plummeted by 73.5% YoY to RMB45.4 million in
2011. Later in H1 2012, the company made a loss of RMB44.1 million. The report resolves around the followings: Supply & demand of global sugar industry, output, imports & exports of major sugar producing countries;  Policies, market size, supply and demand, price trend, imports and exports of Chinese sugar industry;  Sown area, output and price trend of upstream sugarcane and sugar beet in China;  Demand from downstream beverage, candy, pastry and dairy products sectors;  Operation, subsidiaries, sugar business and development of 11 sugar manufacturers in China.
第一章 制糖相关概念
1.1 制糖相关概念
1.2 制糖产业链
第二章 国际制糖行业发展概况
2.1 全球制糖行业发展现状
2.1.1 产需分析
2.1.2 制糖分布
2.2 主要国家分析
2.2.1 巴西
2.2.2 欧盟
2.2.3 印度
2.2.4 美国
第三章 中国制糖行业发展概况
3.1 市场规模
3.2 供需状况
3.2.1 供给
3.2.2 需求
3.3 价格走势
3.4 进出口
3.5 替代产品——淀粉糖
3.6 相关政策
第四章 制糖工业上下游分析
4.1 上游行业
4.1.1 甘蔗种植业
4.1.2 甜菜种植业
4.2 下游行业
4.2.1 饮料行业
4.2.2 糖果行业
4.2.3 糕点行业
4.2.4 乳制品行业
第五章 重点企业分析
5.1 南宁糖业
5.1.1 公司介绍
5.1.2 经营状况
5.1.3 营收构成
5.1.4 毛利率
5.1.5 客户情况
5.1.6 制糖业务
5.1.7 预测与展望
5.2 贵糖股份
5.2.1 公司介绍
5.2.2 经营状况
5.2.3 营收构成
5.2.4 毛利率
5.2.5 客户情况
5.2.6 制糖业务
5.2.7 预测与展望
5.3 中粮屯河
5.3.1 公司介绍
5.3.2 经营状况
5.3.3 营收构成
5.3.4 毛利率
5.3.5 客户情况
5.3.6 制糖业务
5.3.7 预测与展望
5.4 华资实业
5.4.1 公司介绍
5.4.2 经营状况
5.4.3 营收构成
5.4.4 毛利率
5.4.5 制糖业务
5.5 南华糖业
5.5.1 公司简介
5.5.2 子公司
5.5.3 募资项目
5.6 东糖集团
5.6.1 公司简介
5.6.2 子公司
5.7 农垦糖业
5.7.1 公司简介
5.7.2 子公司
5.8 英茂糖业
5.8.1 公司简介
5.8.2 经营情况
5.8.3 子公司
5.9 博天糖业
5.9.1 公司简介
5.9.2 子公司
5.10 恒福糖业
5.11 新疆绿原
1 Concepts of Sugar
1.1 Relevant Concepts
1.2 Industry Chain
2 Overview of Global Sugar Industry
2.1 Status Quo
2.1.1 Output & Demand
2.1.2 Distribution
2.2 Major Countries
2.2.1 Brazil
2.2.2 EU
2.2.3 India
2.2.4 USA
3 Overview of Chinese Sugar Industry
3.1 Market Size
3.2 Supply & Demand
3.2.1 Supply
3.2.2 Demand
3.3 Price Trend
3.4 Imports & Exports
3.5 Substitute - Starch Sugar
3.6 Related Policies
4 Upstream & Downstream
4.1 Upstream Industry
4.1.1 Sugarcane Cultivation
4.1.2 Beet Cultivation
4.2 Downstream Industry
4.2.1 Beverage Sector
4.2.2 Candy Sector
4.2.3 Pastry Sector
4.2.4 Dairy Products Sector
5 Key Players
5.1 Nanning Sugar Industry Co., Ltd.
5.1.1 Profile
5.1.2 Operation
5.1.3 Revenue Structure
5.1.4 Gross Margin
5.1.5 Clients
5.1.6 Sugar Business
5.1.7 Forecast and Outlook
5.2 Guangxi Guitang (Group) Co., Ltd.
5.2.1 Profile
5.2.2 Operation
5.2.3 Revenue Structure
5.2.4 Gross Margin
5.2.5 Clients
5.2.6 Sugar Business
5.2.7 Forecast and Outlook
5.3 COFCO Tunhe Co., Ltd.
5.3.1 Profile
5.3.2 Operation
5.3.3 Revenue Structure
5.3.4 Gross Margin
5.3.5 Clients
5.3.6 Sugar Business
5.3.7 Forecast and Outlook
5.4 Baotou Huazi Industry Co., Ltd.
5.4.1 Profile
5.4.2 Operation
5.4.3 Revenue Structure
5.4.4 Gross Margin
5.4.5 Sugar Business
5.5 Guangxi Yangpu Nanhua Sugar Industry Group Co., Ltd.
5.5.1 Profile
5.5.2 Subsidiaries
5.5.3 Fundraising Project
5.6 Dongguan Donta Group Co., Ltd.
5.6.1 Profile
5.6.2 Subsidiaries
5.7 Guangxi State Farms Sugar Industrial Group Co., Ltd.
5.7.1 Profile
5.7.2 Subsidiaries
5.8 Yunnan Yinmore Sugar Group Co., Ltd.
5.8.1 Profile
5.8.2 Operation
5.8.3 Subsidiaries
5.9 Botian Sugar
5.9.1 Profile
5.9.2 Subsidiaries
5.10 Guangdong Hengfu Group Sugar Industry Co., Ltd.
5.11 Luyuan Sugar Industry Co., Ltd
图:制糖工业产业链
图:2006-2013E全球食糖产量和消费量
图:2006-2013E全球甜菜糖和蔗糖产量
图:2011年全球食糖产量地区分布
图:2006-2013E巴西食糖产量及同比增长
图:2006-2013E巴西食糖出口量及占产量的比例
图:2007-2013E欧盟食糖产量及同比增长
图:2007-2013E欧盟食糖进口量和出口量
图:2006-2013E印度食糖产量及同比增长
图:2006-2013E印度食糖进口量及出口量
图:2006-2013E美国食糖产量及同比增长
图:2006-2013E美国食糖进口量及出口量
图:2006-2012年中国制糖企业数量
图:2006-2012年中国制糖企业主营业务收入及同比增长
图:2006-2012年中国制糖企业利润总额及同比增长
图:2006-2013E中国食糖产量及同比增长率
图:2007-2011年中国甘蔗糖和甜菜糖产量占比
图:2011年中国(分地区)食糖产量
图:2006-2013E中国食糖表观消费量
图:2006-2012年中国白砂糖期货收盘价(活跃合约)
图:2006-2011年中国糖料播种面积及同比增长
图:2011年欧美、美国、印度和中国居民年均食糖消费量
图:2006-2012年中国食糖进口量和出口量
图:2011年中国蔗糖进口来源国分布(按进口量计)
图:2006-2011年中国淀粉糖产量及同比增长
图:2006-2011年中国甘蔗播种面积及同比增长
图:2011年中国主要甘蔗播种地区及面积
图:2006-2011年中国甘蔗产量及同比增长
图:2009-2011年广西甘蔗收购价格
图:2006-2011年中国甜菜播种面积及同比增长
图:2011年中国主要甜菜播种地区及面积
图:2006-2011年中国甜菜产量及同比增长
图:2006-2011年中国果汁及果汁饮料产量及同比增长
图:2006-2012年中国糖果产量及同比增长
图:2006-2011年中国糕点产量及同比增长
图:2006-2012年中国乳制品产量及同比增长
图:2008-2012年南宁糖业营业收入和净利润
表:2010-2012年南宁糖业(分产品)营业收入
表:2010-2012年南宁糖业(分产品)营业收入占比
表:2010-2012年南宁糖业(分地区)营业收入
图:2010-2012年南宁糖业(分地区)营业收入占比
图:2008-2012年南宁糖业主营产品毛利率
图:2009-2012年南宁糖业前五名客户贡献收入及占比
表:2012H1南宁糖业前五名客户名称、收入贡献及占比
图:2009-2011年南宁糖业机制糖产销量
图:2010-2014E南宁糖业营业收入及净利润
图:2008-2012年贵糖股份营业收入和净利润
表:2010-2012年贵糖股份(分产品)营业收入
表:2010-2012年贵糖股份(分产品)营业收入占比
表:2010-2012年贵糖股份(分地区)营业收入
图:2010-2012年贵糖股份(分地区)营业收入占比
图:2008-2012年贵糖股份主营产品毛利率
图:2009-2012年贵糖股份前五名客户贡献收入及占比
表:2012H1贵糖股份前五名客户名称、收入贡献及占比
图:2007/08-2010/11制糖年贵糖股份榨蔗量和产糖量
图:2010-2014E贵糖股份营业收入及净利润
图:2008-2012年中粮屯河营业收入和净利润
表:2010-2012年中粮屯河(分产品)营业收入
表:2010-2012年中粮屯河(分产品)营业收入占比
表:2010-2012年中粮屯河(分地区)营业收入
图:2010-2012年中粮屯河(分地区)营业收入占比
图:2009-2012年中粮屯河主营产品毛利率
图:2009-2012年中粮屯河前五名客户贡献收入及占比
表:2012H1中粮屯河前五名客户名称、收入贡献及占比
图:2009-2011年中粮屯河前五名供应商采购额及占比
图:2010-2014E中粮屯河营业收入及净利润
图:2008-2012年华资实业营业收入和净利润
表:2010-2012年华资实业(分产品)营业收入
表:2010-2012年华资实业(分产品)营业收入占比
表:2010-2012年华资实业(分地区)营业收入
图:2009-2012年华资实业主营产品毛利率
表:2011年南华糖业主要子公司及其制糖生产情况
表:2012年南华糖业募集资金投资项目情况表
图:2010-2011年英茂糖业销售收入及利润
表:2010-2011年英茂糖业(分产品)产量
表:英茂糖业下属主要糖厂及其产能
Sugar Industry Chain
Global Sugar Output and Consumption, 2006-2013E
Output of Global Beet Sugar and Cane Sugar, 2006-2013E
Global Sugar Output Distribution, 2011
Sugar Output and YoY Growth Rate in Brazil, 2006-2013E
Export Volume and Its Proportion in Output of Sugar in Brazil, 2006-2013E
Sugar Output and YoY Growth Rate in EU, 2007-2013E
Import Volume and Export Volume of Sugar in EU, 2007-2013E
Sugar Output and YoY Growth Rate in India, 2006-2013E
Import Volume and Export Volume of Sugar in India, 2006-2013E
Sugar Output and YoY Growth Rate in the USA, 2006-2013E
Import Volume and Export Volume of Sugar in the USA, 2006-2013E
Quantity of Sugar Enterprises in China, 2006-2012
Operating Revenue and YoY Growth Rate of Sugar Enterprises in China, 2006-2012
Total Profit and YoY Growth Rate of Sugar Enterprises in China, 2006-2012
Sugar Output and YoY Growth Rate in China, 2006-2013E
Proportion of Cane Sugar and Beet Sugar in Total Output, 2007-2011
Sugar Output in China by Region, 2011
Apparent Consumption of Sugar in China, 2006-2013E
Closing Price of White Granulated Sugar Futures (Active Contract) in China, 2006-2012
Sown Area and YoY Growth Rate of Sugar Crops in China, 2006-2011
Annual Average Sugar Consumption of Residents in EU, the USA, India and China, 2011
Import Volume and Export Volume of Sugar in China, 2006-2012
Import Origins of Sugar in China by Import Volume, 2010
Output and YoY Growth Rate of Starch Sugar in China, 2006-2011
Sown Area and YoY Growth Rate of Sugarcane in China, 2006-2011
Major Regions and Sown Area of Sugarcane in China, 2011
Sugarcane Output and YoY Growth Rate in China, 2006-2011
Purchasing Price of Sugarcane in Guangxi, 2009- 2011
Sown Area and YoY Growth Rate of Sugar Beet in China, 2006-2011
Major Regions and Sown Area of Sugar Beet in China, 2011
Sugar Beet Output and YoY Growth Rate, 2006-2011
Output and YoY Growth Rate of Fruit Juice and Fruit Juice Drinks in China, 2006-2011
Candy Output and YoY Growth Rate in China, 2006-2012
Pastry Output and YoY Growth Rate in China, 2006-2011
Dairy Product Output and YoY Growth Rate in China, 2006-2012
Revenue and Net Income of Nanning Sugar Industry Co., Ltd., 2008-2012
Revenue Breakdown of Nanning Sugar Industry Co., Ltd. by Product, 2010-2012
Revenue Structure of Nanning Sugar Industry Co., Ltd. by Product, 2010-2012
Revenue Breakdown of Nanning Sugar Industry Co., Ltd. by Region, 2010-2012
Revenue Structure of Nanning Sugar Industry Co., Ltd. by Region, 2010-2012
Gross Margin of Leading Products of Nanning Sugar Industry Co., Ltd., 2008-2012
Nanning Sugar Industry’s Revenue from Top 5 Clients and % of Total Revenue, 2009-2012
Name List and Revenue Contribution of Nanning Sugar Industry’s Top 5 Clients, H1 2012
Machine-made Sugar Output and Sales Volume of Nanning Sugar Industry Co., Ltd., 2009-2011
Revenue and Net Income of Nanning Sugar Industry Co., Ltd., 2010-2014E
Revenue and Net Income of Guangxi Guitang (Group) Co., Ltd., 2008-2012
Revenue Breakdown of Guangxi Guitang (Group) Co., Ltd. by Product, 2010-2012
Revenue Structure of Guangxi Guitang (Group) Co., Ltd. by Product, 2010-2012
Revenue Breakdown of Guangxi Guitang (Group) Co., Ltd. by Region, 2010-2012
Revenue Structure of Guangxi Guitang (Group) Co., Ltd. by Region, 2010-2012
Gross Margin of Leading Products of Guangxi Guitang (Group) Co., Ltd., 2008-2012
Guangxi Guitang’s Revenue from Top 5 Clients and % of Total Revenue, 2009-2012
Name List and Revenue Contribution of Guangxi Guitang’s Top 5 Clients, H1 2012
Sugarcane Squeezing Volume and Sugar Output of Guangxi Guitang (Group) Co., Ltd., 2007/08-2010/11 Crop Year
Revenue and Net Income of Guangxi Guitang (Group) Co., Ltd., 2010-2014E
Revenue and Net Income of COFCO Tunhe Co., Ltd., 2008-2012
Revenue Breakdown of COFCO Tunhe Co., Ltd. by Product, 2010-2012
Revenue Structure of COFCO Tunhe Co., Ltd. by Product, 2010-2012
Revenue Breakdown of COFCO Tunhe Co., Ltd. by Region, 2010-2012
Revenue Structure of COFCO Tunhe Co., Ltd. by Region, 2010-2012
Gross Margin of Major Products of COFCO Tunhe Co., Ltd., 2009-2012
COFCO Tunhe’s Revenue from Top 5 Clients and % of Total Revenue, 2009-2012
Name List and Revenue Contribution of COFCO Tunhe’s Top 5 Clients, H 12012
COFCO Tunhe’s Procurement from Top 5 Suppliers and % of Total Procurement, 2009-2011
Revenue and Net Income of COFCO Tunhe Co., Ltd., 2010-2014E
Revenue and Net Income of Baotou Huazi Industry Co., Ltd., 2008-2012
Revenue Breakdown of Baotou Huazi Industry Co., Ltd. by Product, 2010-2012
Revenue Structure of Baotou Huazi Industry Co., Ltd. by Product, 2010-2012
Revenue Breakdown of Baotou Huazi Industry Co., Ltd. by Region, 2010-2012
Gross Margin of Main Products of Baotou Huazi Industry Co., Ltd., 2009-2012
Major Subsidiaries and Sugar Production of Guangxi Yangpu Nanhua Sugar Industry Group Co., Ltd., 2011
Fundraising Projects of Guangxi Yangpu Nanhua Sugar Industry Group Co., Ltd., 2012
Sales and Profit of Yunnan Yinmore Sugar Group Co., Ltd., 2010-2011
Output of Yunnan Yinmore Sugar Group Co., Ltd. by Product, 2010-2011
Major Sugar Refineries and Capacity of Yunnan Yinmore Sugar Group Co., Ltd.
如果这份报告不能满足您的要求,我们还可以为您定制报告,请 留言说明您的详细需求。
|