|
|
|
报告导航:研究报告—
制造业—化工
|
|
2012-2015年中国BDO-PTMEG-氨纶产业链研究报告 |
 |
字数:3.1万 |
页数:81 |
图表数:115 |
|
中文电子版:7500元 |
中文纸版:3750元 |
中文(电子+纸)版:8000元 |
|
英文电子版:1950美元 |
英文纸版:2050美元 |
英文(电子+纸)版:2250美元 |
|
编号:HK024
|
发布日期:2012-11 |
附件:下载 |
 |
|
|
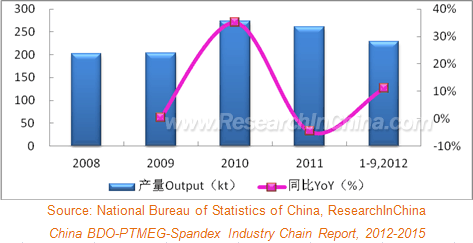
2011-2012年上半年,中国氨纶行业一方面产能持续扩张,另一方面下游需求却萎靡不振,导致氨纶价格下跌,行业内主要生产企业经营业绩均大幅下滑。2011年,中国氨纶产量约为26万吨,同比下降4.6%;表观消费量约为25万吨,同比下降1.7%。
表:2008-2012年中国氨纶产量及同比增长率
2011年,中国氨纶产能达到40.7万吨,占全球总产能的60%以上,同时也是全球最主要的氨纶消费市场。2012年上半年,中国新增氨纶产能已达4万吨以上,预计全年总产能将达到47万吨左右。2013年以后,中国氨纶新增产能明显减少,行业将步入产能消化阶段,供需格局有望好转。 氨纶的上游原料主要为PTMEG和纯MDI,2011年二者市场价格总体在高位运行,给氨纶生产企业带来较大的成本压力。氨纶的下游为纺织服装业,纺织品、服装产量的增长以及消费升级带来的氨纶使用比例不断提高是推动氨纶需求增长的主要原因。 中国氨纶行业集中度较高,主要生产企业包括华峰氨纶、韩国晓星、华海氨纶、美国英威达、友利控股、泰和新材等。2011年,中国氨纶行业前七名氨纶产能之和占中国氨纶总产能的65.2%。而且行业内主要生产企业仍然在继续扩大其氨纶产能,且以差异化氨纶产品为主。 2012年4月,华峰氨纶1.5万吨/年耐高温薄型面料氨纶项目建成投产,总产能达到5.7万吨,超越晓星氨纶再次成为中国规模最大的氨纶企业;烟台氨纶在建的7000吨/年舒适氨纶项目预计2012年底投产,总产能将达到3.7万吨/年。 水清木华研究中心《2012-2015年中国BDO-PTMEG-氨纶产业链研究报告》主要包括以下几个内容:
- 中国氨纶行业产能分析、供需分析、价格走势、竞争格局、进出口分析及发展预测;
- 中国氨纶上游PTMEG、MDI、BDO等行业产能分析、供需分析、进出口分析、价格走势等;
- 中国氨纶下游纺织业产量分析、行业运营、进出口分析等;
- 中国14家氨纶生产企业的经营状况、氨纶业务分析及发展预测等。
Concerning China’s spandex industry from 2011 to the first half of 2012, on the one hand, capacity expansion continued; on the other hand, the demand from downstream sectors plunged into the doldrums, which caused a decrease in spandex price, as well as a substantial decline in business performance of major manufacturers. In 2011, spandex output of China approximated 260,000 tons, a year-on-year decrease of 4.6%; apparent consumption dropped by 1.7% YoY to 250,000 tons or so.
Spandex Output and YoY Growth Rate in China, 2008-2012
In 2011, China’s spandex capacity reached 407,000 tons, accounting for more than 60% of the global total, which also made China the most significant spandex consumer market around the globe. In H1 2012, new spandex production capacity in China exceeded 40,000 tons, and it is expected to hit 470,000 tons for the whole year, then followed by a sharp reduction from 2013, whereupon the industry will step into the capacity digestion phase, accompanied by a possibly better supply-demand pattern. As important upstream materials for spandex, PTMEG and pure MDI in 2011 kept high market prices as a whole, thus exerting greater cost pressure on spandex manufacturers. Downstream consumers of spandex refer to textile and garment, whose output growth plus with the ever-improving spandex utilization proportion owing to consumption upgrading constitute the leading causes to promote demand growth for spandex. Spandex industry features a relatively high concentration degree in China, the key players include Zhejiang Huafon Spandex Co., Ltd., South Korea's Hyosung, Zhuji Huahai Spandex Co., Ltd., United States-based INVISTA, Sichuan Youli Investment Holding Co., Ltd., Yantai Tayho Advanced Materials Co., Ltd., etc.. In 2011, spandex capacity of China spandex industry’s top seven producers altogether occupied 65.2% of the national total. Moreover, leading companies are still expanding their spandex capacity, oriented by differentiated products. In April 2012, Zhejiang Huafon Spandex’s 15,000 t/a High Temperature Thin Fabric Spandex Project was completed and put into operation, with total capacity up to 57,000 tons, thus surpassing Hyosung to again be China’s largest spandex enterprise; the under-construction 7,000 tons/a Comfortable Spandex Project of Yantai Tayho Advanced Materials Co., Ltd., expected to go into operation at the end of 2012, will realize total capacity of 37,000 tons per year. China BDO-PTMEG-Spandex Industry Chain Report, 2012-2015 of ResearchInChina chiefly covers the followings: Capacity, supply & demand, price trend, competitive landscape, import & export as well as development forecast of spandex industry in China; Capacity, supply & demand, import & export, price trend, etc. of upstream Industries of spandex in China such as PTMEG, MDI, BDO; Output, operation, import & export, etc. of downstream textile industry of spandex in China; Operation, spandex business, development forecast, etc. of 14 Chinese spandex producers.
第一章 氨纶行业概述
1.1 定义及应用
1.2 产业链
1.3 工艺简介
第二章 中国氨纶市场分析
2.1 发展现状
2.2 供需分析
2.2.1 产能分析
2.2.2 产量分析
2.2.3 需求分析
2.3 价格分析
2.4 竞争格局
2.5 进出口
2.5.1 氨纶弹性单纱
2.5.2 氨纶纱线
2.6 发展预测
第三章 中国氨纶上游行业发展概况
3.1 PTMEG市场分析
3.1.1 供给
3.1.2 需求
3.1.3 进出口
3.1.4 价格
3.2 MDI市场分析
3.2.1 供给
3.2.2 需求
3.2.3 进出口
3.2.4 价格
3.3 BDO市场分析
3.3.1 供给
3.3.2 需求
3.3.3 竞争格局
3.3.4 进出口
3.3.5 价格分析
3.3.6 发展前景及趋势
第四章 中国氨纶下游行业发展概况
4.1 发展现状
4.2 行业运营
4.3 进出口
4.4 发展前景
第五章 中国氨纶重点生产企业分析
5.1 华峰氨纶
5.1.1 公司简介
5.1.2 经营状况
5.1.3 营收构成
5.1.4 毛利率
5.1.5 客户及供应商
5.1.6 研发
5.1.7 氨纶业务
5.1.8 预测与展望
5.2 Hyosung(中国)
5.2.1 公司简介
5.2.2 经营状况
5.2.3 氨纶业务
5.2.4 在华业务
5.3 Invista(中国)
5.3.1 公司简介
5.3.2 在华业务
5.4 友利控股
5.4.1 公司简介
5.4.2 经营状况
5.4.3 营收构成
5.4.4 氨纶业务
5.4.5 预测与展望
5.5 泰和新材
5.5.1 公司简介
5.5.2 经营状况
5.5.3 营收构成
5.5.4 毛利率
5.5.5 研发
5.5.6 氨纶业务
5.5.7 预测与展望
5.6 泰光化纤
5.6.1 公司简介
5.6.2 经营及发展情况
5.7 杭州益邦
5.7.1 公司简介
5.7.2 经营状况
5.8 新乡化纤
5.8.1 公司简介
5.8.2 经营情况
5.8.3 营收构成
5.8.4 毛利率
5.8.5 氨纶业务
5.8.6 预测与展望
5.9 杭州邦联
5.9.1 公司简介
5.9.2 经营及发展情况
5.10 杭州舒尔姿
5.10.1 公司简介
5.10.2 经营状况
5.11 浙江雅迪
5.11.1 公司简介
5.11.2 经营及发展情况
5.12 四海氨纶
5.12.1 公司简介
5.12.2 经营状况
5.13 薛永兴氨纶
5.13.1 公司简介
5.13.2 经营及发展情况
5.14 杭州旭化成
5.14.1 公司简介
5.14.2 经营状况
1. Overview of Spandex Industry
1.1 Definition and Application
1.2 Industrial Chain
1.3 Technology
2. China Spandex Market
2.1 Development
2.2 Supply and Demand
2.2.1 Capacity
2.2.2 Output
2.2.3 Demand
2.3 Price
2.4 Competitive Landscape
2.5 Import and Export
2.5.1 Spandex Single Yarn
2.5.2 Spandex Yarn
2.6 Development Forecast
3. Development of Upstream Industries of Spandex in China
3.1 PTMEG Market
3.1.1 Supply
3.1.2 Demand
3.1.3 Import and Export
3.1.4 Price
3.2 MDI Market
3.2.1 Supply
3.2.2 Demand
3.2.3 Import and Export
3.2.4 Price
3.3 BDO Market
3.3.1 Supply
3.3.2 Demand
3.3.3 Competitive Landscape
3.3.4 Import and Export
3.3.5 Price
3.3.6 Development Prospects and Trends
4. Development of Downstream Industries of Spandex in China
4.1 Development Status
4.2 Industrial Operation
4.3 Import and Export
4.4 Development Outlook
5. Key Enterprises in China
5.1 Zhejiang Huafon Spandex
5.1.1 Profile
5.1.2 Operation
5.1.3 Revenue Structure
5.1.4 Gross Margin
5.1.5 Clients and Suppliers
5.1.6 R & D
5.1.7 Spandex Business
5.1.8 Forecast and Prospects
5.2 Hyosung (China)
5.2.1 Profile
5.2.2 Operation
5.2.3 Spandex Business
5.2.4 Business in China
5.3 INVISTA (China)
5.3.1 Profile
5.3.2 Business in China
5.4 Sichuan Youli Investment Holding
5.4.1 Profile
5.4.2 Operation
5.4.3 Revenue Structure
5.4.4 Spandex Business
5.4.5 Forecast and Prospects
5.5 Yantai Tayho Advanced Materials
5.5.1 Profile
5.5.2 Operation
5.5.3 Revenue Structure
5.5.4 Gross Margin
5.5.5 R & D
5.5.6 Spandex Business
5.5.7 Forecast and Prospects
5.6 Taekwang Synthetic Fiber
5.6.1 Profile
5.6.2 Operation and Development
5.7 EBH Spandex
5.7.1 Profile
5.7.2 Operation
5.8 Xinxiang Chemical Fibre
5.8.1 Profile
5.8.2 Operation
5.8.3 Revenue Structure
5.8.4 Gross Margin
5.8.5 Spandex Business
5.8.6 Forecast and Prospects
5.9 Hangzhou Banglian Spandex
5.9.1 Profile
5.9.2 Operation and Development
5.10 Hangzhou Sunrise Spandex
5.10.1 Profile
5.10.2 Operation
5.11 Zhejiang Yadi Fiber
5.11.1 Profile
5.11.2 Operation and Development
5.12 Zhejiang Sihai Spandex Fiber
5.12.1 Profile
5.12.2 Operation
5.13 Zhejiang Shei Yung Hsin Spandex
5.13.1 Profile
5.13.2 Operation and Development
5.14 Hangzhou Asahikasei Spandex
5.14.1 Profile
5.14.2 Operation
图:2011年中国合成纤维主要种类及其及产量占比
表:氨纶的分类及应用终端
图:氨纶产业链
表:氨纶工艺路线优劣对比
表:2010-2011年中国氨纶主要生产企业及其产能
表:2012年中国氨纶在建/拟建项目
表:2008-2012年中国氨纶产量及同比增长率
图:2011年中国氨纶产量地区分布
图:2008-2012年中国氨纶表观消费量及同比增长率
图:2006-2012年中国氨纶40D市场价格走势
图:2011年中国氨纶主要生产企业及产能占比
图:2008-2012年中国氨纶弹性单纱进出口量
图:2008-2012年中国氨纶弹性单纱进出口平均价格
图:2011年中国氨纶弹性单纱进口来源结构
图:2011年中国氨纶弹性单纱出口地区分布
图:2008-2012年中国氨纶纱线进出口量
图:2008-2012年中国氨纶纱线进出口平均价格
图:2011年中国氨纶纱线进口来源结构(按进口量)
图:2011年中国氨纶纱线出口地区分布(按出口量)
图:2011-2015年中国氨纶产能及开工率预测
图:2011-2015年中国氨纶产量及表观消费量
图:2006-2012年中国PTMEG产量、产能及开工率
表:2011年中国大陆PTMEG生产企业及其产能
表:2012年中国拟/在建PTMEG项目
图:2006-2012年中国PTMEG表观消费量及进口依赖率
图:2011年中国PTMEG消费结构
图:2008-2012年中国PTMEG进出口数量
图:2008-2012年中国PTMEG进出口平均价格
图:2011年中国PTMEG进口来源分布(按进口量)
图:2011年中国PTMEG出口地区分布(按出口量)
图:2008-2011年中国华东市场PTMEG(1800分子量)价格
表:2008-2011年中国MDI主要企业产能
表:2012-2016年中国MDI新增产能情况
图:2008-2012年中国纯MDI需求量及同比增长率
图:2011年中国纯MDI消费结构
图:2008-2012年中国纯MDI进出口量
图:2008-2012年中国纯MDI进出口平均价格
图:2011年中国纯MDI进口来源分布(按进口量)
图:2011年中国纯MDI出口地区分布(按出口量)
图:2010-2012年中国纯MDI月平均价格
表:2011年中国BDO生产企业及产能
表:2012-2015年中国BDO新增产能
图:2006-2012年中国BDO产能、产量及开工率
图:2006-2012年中国BDO表观需求量
图:2011年中国BDO分领域消费结构
图:2011年中国BDO生产厂家产能占比
图:2007-2012年中国其他二元醇进出口量
图:2006-2011年中国BDO进口量
图:2011年中国其他二元醇进口来源分布(按进口量)
图:2011年中国其他二元醇出口目的地分布(按出口量)
图:2009-2012年中国华东地区BDO平均价格
图:2006-2012年中国纱产量及同比增长率
图:2006-2012年中国布产量及同比增长率
图:2006-2012年中国纺织业企业数量
图:2006-2012年中国纺织业主营业务收入及同比增长
图:2006-2012年中国纺织业利润总额及同比增长
图:2007-2012中国纺织纱线、织物及制品进出口金额
图:2008-2012年华峰氨纶营业收入和净利润
表:2010-2012年华峰氨纶(分产品)营业收入
表:2010-2012年华峰氨纶(分产品)营业收入占比
表:2010-2012年华峰氨纶(分地区)营业收入
图:2010-2012年华峰氨纶(分地区)营业收入占比
图:2008-2012年华峰氨纶氨纶业务毛利率
图:2009-2012年华峰氨纶前五名客户贡献收入及占比
表:2012H1华峰氨纶前五名客户名称、收入贡献及占比
图:2009-2011年华峰氨纶前五名供应商采购额及占比
图:2009-2011年华峰氨纶研发支出及占营业收入比例
图:2010-2014年华峰氨纶营业收入和净利润预测
表:HYOSUNG八大事业部门及其主营业务
图:2007-2011年Hyosung销售收入及净利润
图:2008-2011年Hyosung纺织品部门销售收入及营业利润
表:晓星主要的氨纶产品及其性能
图:2007-2009年晓星(嘉兴)主营业务收入及营业利润
图:2007-2009年晓星(广东)主营业务收入及营业利润
图:2008年晓星(中国)氨纶业务的主营业务收入构成
图:2008年晓星氨纶(嘉兴)、晓星氨纶(广东)、晓星氨纶(珠海)产品毛利率情况
表:英威达业务部门及主要产品
表:2009年英威达中国(分公司)主营业务收入、营业利润及产品毛利率
图:2007-2009年英威达纤维主营业务收入、营业利润及毛利率
图:2007-2009年英威达纤维(上海)主营业务收入、营业利润及毛利率
图:2007-2009年英威达纤维(佛山)主营业务收入、营业利润及产品毛利率
图:2008-2012年友利控股营业收入及净利润
表:2010-2012年友利控股(分产品)营业收入
表:2010-2012年友利控股(分产品)营业收入占比
表:2010-2012年友利控股(分地区)营业收入
图:2010-2012年友利控股(分地区)营业收入占比
表:2011年友利控股氨纶相关子公司总资产及净利润
图:2010-2014E友利控股营业收入及净利润
图:2008-2012泰和新材营业收入及净利润
表:2010-2012年泰和新材(分产品)营业收入
表:2010-2012年泰和新材(分产品)营业收入占比
表:2010-2012年泰和新材(分地区)营业收入
图:2010-2012年泰和新材(分地区)营业收入占比
图:2008-2012年泰和新材主营产品毛利率
图:2009-2011年泰和新材研发支出及占营业收入比例
图:2010-2014E泰和新材营业收入及净利润
图:2007-2009年泰光化纤主营业务收入、利润总额及毛利率
图:2007-2009年杭州益邦主营业务收入、利润总额及毛利率
表:2011年新乡化纤产能情况
图:2008-2012年新乡化纤营业收入和净利润
表:2010-2012年新乡化纤(分产品)营业收入
表:2010-2012年新乡化纤(分产品)营业收入占比
表:2010-2012年新乡化纤(分地区)营业收入
图:2010-2012年新乡化纤(分地区)营业收入占比
图:2008-2012年新乡化纤主营产品毛利率
表:2008-2012年新乡化纤氨纶产量
表:截止2012年6月新乡化纤在建项目情况
图:2010-2014E新乡化纤营业收入和净利润
表:2007-2009年杭州邦联主营业务收入、利润总额及毛利率
图:2007-2009年杭州舒尔姿主营业务收入、利润总额及毛利率
表:2008-2009年浙江雅迪主营业务收入、利润总额及毛利率
图:2009-2011年四海氨纶营业收入与营业利润
表:2009-2012年四海股份纺织品业务毛利率
图:2007-2009年薛永兴氨纶主营业务收入、利润总额及毛利率
图:2007-2009年杭州旭化成主营业务收入、利润总额及毛利率
Output Structure of Major Varieties of Synthetic Fiber in China, 2011
Classification and Application Terminals of Spandex
Spandex Industry Chain
Advantages & Disadvantages of Spandex Process Route
Capacity of Leading Spandex Manufacturers in China, 2010-2011
Spandex Projects under Construction or Planned in China, 2012
Spandex Output and YoY Growth Rate in China, 2008-2012
China’s Spandex Output by Region, 2011
Apparent Consumption of Spandex and YoY Growth Rate in China, 2008-2012
Market Price Trends of Spandex 40D in China, 2006-2012
Capacity Structure of Leading Spandex Manufacturers in China, 2011
Import / Export Volume of Spandex Single Yarn in China, 2008-2012
Average Import / Export Price of Spandex Single Yarn in China, 2008-2012
Import Source Structure of Spandex Single Yarn in China, 2011
Export Destinations of China-made Spandex Single Yarn, 2011
Import / Export Volume of Spandex Yarn in China, 2008-2012
Average Import / Export Price of Spandex Yarn in China, 2008-2012
Import Source Structure of Spandex Yarn in China (by Import Volume), 2011
Export Destinations of China-made Spandex Yarn (by Export Volume), 2011
Capacity and Operating Rate of Spandex in China, 2011-2015E
Output and Apparent Consumption of Spandex in China, 2011-2015
Output, Capacity and Operating Rate of PTMEG in China, 2006-2012
Capacity of PTMEG Manufacturers in Mainland China, 2011
PTMEG Projects Planned or under Construction in China, 2012
Apparent Consumption and Import Dependence Ratio of PTMEG in China, 2006-2012
PTMEG Consumption Structure in China, 2011
Import / Export Volume of PTMEG in China, 2008-2012
Average Import / Export Price of PTMEG in China, 2008-2012
Import Source Structure of PTMEG in China (by Import Volume), 2011
Export Destinations of PTMEG in China (by Export Volume), 2011
PTMEG (1800 Molecular Weight) Price in East China Market, 2008-2011
Capacity of Main MDI Enterprises in China, 2008-2011
New MDI Capacity in China, 2012-2016
Demand and YoY Growth Rate of Pure MDI in China, 2008-2012
Consumption Structure of Pure MDI in China, 2011
Import / Export Volume of Pure MDI in China, 2008-2012
Average Import / Export Price of Pure MDI in China, 2008-2012
Import Source Structure of Pure MDI in China (by Import Volume), 2011
Export Destinations of Pure MDI in China (by Export Volume), 2011
Monthly Price Average of Pure MDI in China, 2010-2012
Capacity of BDO Manufacturers in China, 2011
New BDO Capacity in China, 2012-2015
Capacity, Output and Operating Rate of BDO in China, 2006-2012
Apparent Demand of BDO in China, 2006-2012
China’s BDO Consumption Structure by Field, 2011
Capacity Structure of BDO Manufacturers in China, 2011
Import / Export Volume of Other Dibasic Alcohols in China, 2007-2012
Import Volume of BDO in China, 2006-2011
Import Source Structure of Other Dibasic Alcohols in China (by Import Volume), 2011
Export Destinations of Other Dibasic Alcohols in China (by Export Volume), 2011
Average BDO Price in East China Market, 2009-2012
Yarn Output and YoY Growth Rate in China, 2006-2012
Fabric Output and YoY Growth Rate in China, 2006-2012
Number of Textile Enterprises in China, 2006-2012
Operating Revenue and YoY Growth Rate of Textile Industry in China, 2006-2012
Total Profit and YoY Growth Rate of China Textile Industry, 2006-2012
Import / Export Value of Textile Yarn, Fabric and Related Products in China, 2007-2012
Revenue and Net Income of Zhejiang Huafon Spandex, 2008-2012
Revenue Breakdown of Zhejiang Huafon Spandex by Products, 2010-2012
Revenue Structure of Zhejiang Huafon Spandex by Products, 2010-2012
Revenue Breakdown of Zhejiang Huafon Spandex by Regions, 2010-2012
Revenue Structure of Zhejiang Huafon Spandex by Regions, 2010-2012
Gross Margin of Spandex Business of Zhejiang Huafon Spandex, 2008-2012
Zhejiang Huafon Spandex’s Revenue from Top 5 Clients and % of Total Revenue, 2009-2012
Name List and Revenue Contribution of Zhejiang Huafon Spandex’s Top 5 Clients, H1 2012
Zhejiang Huafon Spandex’s Procurement from Top 5 Suppliers and % of Total Procurement, 2009-2011
R&D Costs and % of Total Revenue of Zhejiang Huafon Spandex, 2009-2011
Revenue and Net Income of Zhejiang Huafon Spandex, 2010-2014E
Primary Business of Hyosung’s 8 Major Business Divisions
Revenue and Net Income of Hyosung, 2007-2011
Revenue and Operating Income of Hyosung’s Textile Sector, 2008-2011
Performance of Main Spandex Products of Hyosung
Operating Revenue and Operating Income of Hyosung (Jiaxing), 2007-2009
Operating Revenue and Operating Income of Hyosung (Guangdong), 2007-2009
Operating Revenue Structure of Spandex Business of Hyosung (China), 2008
Gross Margin of Hyosung Spandex (Jiaxing), Hyosung Spandex (Guangdong) and Hyosung Spandex (Zhuhai), 2008
Business Divisions and Main Products of INVISTA
Operating revenue, Operating Income and Gross Margin of INVISTA China Branch, 2009
Operating Revenue, Operating Income and Gross Margin of INVISTA Fibers, 2007-2009
Operating Revenue, Operating Income and Gross Margin of INVISTA Fibers (Shanghai), 2007-2009
Operating Revenue, Operating Income and Gross Margin of INVISTA Fibers (Foshan), 2007-2009
Revenue and Net Income of Sichuan Youli Investment Holding, 2008-2012
Revenue Breakdown of Sichuan Youli Investment Holding by Products, 2010-2012
Revenue Structure of Sichuan Youli Investment Holding by Products, 2010-2012
Revenue Breakdown of Sichuan Youli Investment Holding by Regions, 2010-2012
Revenue Structure of Sichuan Youli Investment Holding by Regions, 2010-2012
Total Assets and Net Income of Spandex Related Subsidiaries of Sichuan Youli Investment Holding, 2011
Revenue and Net Income of Sichuan Youli Investment Holding, 2010-2014E
Revenue and Net Income of Yantai Tayho Advanced Materials, 2008-2012
Revenue Breakdown of Yantai Tayho Advanced Materials by Products, 2010-2012
Revenue Structure of Yantai Tayho Advanced Materials by Products, 2010-2012
Revenue Breakdown of Yantai Tayho Advanced Materials by Regions, 2010-2012
Revenue Structure of Yantai Tayho Advanced Materials by Regions, 2010-2012
Gross Margin of Major Products of Yantai Tayho Advanced Materials, 2008-2012
R&D Costs and % of Total Revenue of Yantai Tayho Advanced Materials, 2009-2011
Revenue and Net Income of Yantai Tayho Advanced Materials, 2010-2014E
Operating Revenue, Total Profit and Gross Margin of Taekwang Synthetic Fiber, 2007-2009
Operating Revenue, Total Profit and Gross Margin of EBH Spandex, 2007-2009
Capacity of Xinxiang Chemical Fibre, 2011
Revenue and Net Income of Xinxiang Chemical Fibre, 2008-2012
Revenue Breakdown of Xinxiang Chemical Fibre by Products, 2010-2012
Revenue Structure of Xinxiang Chemical Fibre by Products, 2010-2012
Revenue Breakdown of Xinxiang Chemical Fibre by Regions, 2010-2012
Revenue Structure of Xinxiang Chemical Fibre by Regions, 2010-2012
Gross Margin of Major Products of Xinxiang Chemical Fibre, 2008-2012
Spandex Output of Xinxiang Chemical Fibre, 2008-2012
Projects under Construction of Xinxiang Chemical Fibre by June 2012
Revenue and Net Income of Xinxiang Chemical Fibre, 2010-2014E
Operating Revenue, Total Profit and Gross Margin of Hangzhou Banglian Spandex, 2007-2009
Operating Revenue, Total Profit and Gross Margin of Hangzhou Sunrise Spandex, 2007-2009
Operating Revenue, Total Profit and Gross Margin of Zhejiang Yadi Fiber, 2008-2009
Revenue and Operating Income of Zhejiang Sihai Spandex Fiber, 2009-2011
Gross Margin of Sihai’s Textile Business, 2009-2012
Operating Revenue, Total Profit and Gross Margin of Zhejiang Shei Yung Hsin Spandex, 2007-2009
Operating Revenue, Total Profit and Gross Margin of Hangzhou Asahikasei Spandex, 2007-2009
如果这份报告不能满足您的要求,我们还可以为您定制报告,请 留言说明您的详细需求。
|