|
|
|
报告导航:研究报告—
农业与食品—食品饮料
|
|
2012-2014年全球及中国啤酒产业研究报告 |
 |
字数:3.9万 |
页数:115 |
图表数:163 |
|
中文电子版:8000元 |
中文纸版:4000元 |
中文(电子+纸)版:8500元 |
|
英文电子版:2200美元 |
英文纸版:2300美元 |
英文(电子+纸)版:2500美元 |
|
编号:CYH006
|
发布日期:2012-12 |
附件:下载 |
 |
|
|
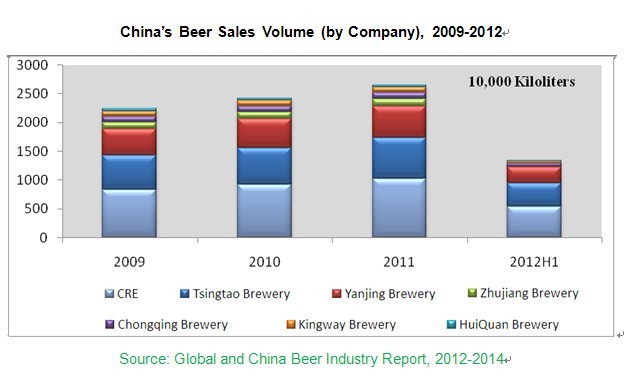
近年来,全球啤酒产销持续增长。2011年全球啤酒生产总量达到1.927亿千升,同比增长3.82%;中国、美国、巴西、俄罗斯和德国等为全球前5大啤酒生产国,合计占全球啤酒总产量的54%。随着啤酒行业的跨国并购的加速(如AB-INBEV全资控股中国哈尔滨啤酒、SABMiller占有中国华润雪花公司49%的股份,嘉士伯占有中国重庆啤酒股份公司29.71%的股份等),全球啤酒企业集中度逐渐提高,目前AB-INBEV、SABMiller、HEINEKE以及Carlsberg等四家企业的全球市场占有率合计达46%。 中国是全球最大的啤酒生产国和消费国,2011年中国啤酒产销量分别达4898.9万千升、4855.7万千升,其中产量占全球总量的25.42%。目前中国啤酒市场主要分布在中国的华东、华中、华南和东北等地区,2011年四大地区啤酒合计产量占中国总量的76.5%。 华润创业、青岛啤酒和燕京啤酒等公司为中国啤酒市场的主要生产商,2011年,三大集团合计占中国市场的48.1%;其中华润创业公司实现啤酒销量1023.5万千升,位居中国啤酒销量第一。
图:2009-2012年中国啤酒(分企业)销量
中国各大啤酒生产商在积极加大啤酒品牌宣传力度的同时,也通过新建、并购或扩建等方式扩大啤酒产能。以青岛啤酒为例。2011年,青岛啤酒通过收购杭州新安江啤酒有限公司、韶关活力啤酒有限公司以及扩建宿迁啤酒厂等项目,实现新增啤酒产能210万千升;2012年,青岛啤酒公司新建广东揭阳啤酒厂、扩建扬州啤酒厂、扩建武威啤酒厂等项目竣工投产;此外,青岛啤酒第一个海外基地“青岛啤酒(泰国)公司”计划于2013年年末竣工投产。 水清木华研究中心《2012-2014年全球及中国啤酒产业研究报告》主要包括以下几个内容:
- 全球啤酒行业供需分析、区域分布、竞争格局、发展趋势等;
- 中国啤酒行业供需分析、地区分布、进出口分析、竞争格局、发展趋势等;
- 全球及中国15家啤酒生产企业的运营状况、啤酒业务分析及发展情况等。
In recent years, the global beer production and sales have maintained continuous growth. Total production in 2011 reached 192.7 million kiloliters, a year-on-year rise of 3.82%; China, the United States, Brazil, Russia and Germany as the world’s top five largest beer-producing countries together accounted for 54% of the global beer production. Following the acceleration of cross-border mergers and acquisitions in the beer industry (e.g. Anheuser-Busch InBev wholly owns China’s Harbin Brewery; SABMiller holds a 49% stake in China Resources Snow Breweries; Carlsberg acquires a 29.71% stake in China’s Chongqing Brewery, etc.), international beer companies have witnessed an increasing concentration ratio; currently, Anheuser-Busch InBev, SABMiller, Heineken and Carlsberg occupy a total of 46% market share.
As the world’s largest beer producer and consumer, in 2011 China realized beer production and sales volume of 48.989 million kiloliters and 48.557 million kiloliters, respectively, of which, the former accounted for 25.42% worldwide. At present, China’s beer market is mainly distributed in East, Central, South and Northeast regions, whose aggregate output held 76.5% of the national total in 2011.
In 2011, China Resources Enterprise, Limited (CRE), Tsingtao Brewery Co.,Ltd. and Yanjing Beer Group Corporation as the leading beer brewers in China accounted for a total of 48.1% market share nationwide; wherein, CRE ranked first in beer sales volume by reaching 10.235 million kiloliters.
In addition to actively intensifying brand propaganda, major Chinese beer brewers have also expanded capacity by way of new construction, mergers & acquisitions or construction expansion. Tsingtao Brewery, for instance, realized new capacity of 2.1 million kiloliters in 2011 by means of acquiring Hangzhou Xin’an River Brewery Co., Ltd. and Shaoguan Vigour Brewery Co., Ltd., expanding Suqian Brewery, etc.; in 2012, the new construction project of Guangdong Jieyang Brewery, expansion projects of Yangzhou Brewery and Weiwu Brewery were completed and put into production; moreover, Tsingtao Brewery’s first overseas base “Tsingtao Brewery (Thailand) Co., Ltd.” plans to be completed and put into operation at the end of 2013.
Global and China Beer Industry Report, 2012-2014 of ResearchInChina mainly covers the followings:
Supply and demand, regional distribution, competitive landscape, development trend, etc. of global beer industry;
supply and demand, regional distribution, import and export, competitive landscape, development trend, etc. of China beer industry.
Operation, beer business analysis and development, etc. of 15 international and Chinese beer enterprises.
第一章 啤酒行业概述
1.1 定义
1.2 分类
第二章 全球啤酒行业发展
2.1 市场供给
2.2 市场需求
2.3 区域分布
2.4 竞争格局
2.5 发展趋势
第三章 中国啤酒行业发展
3.1 发展概况
3.2 市场供给
3.3 市场需求
3.4 进出口
3.5 区域分布
3.6 市场价格
3.7 竞争格局
3.8 发展趋势
第四章 全球啤酒重点生产企业
4.1 百威英博(Anheuser-Busch InBev)
4.1.1 企业简介
4.1.2 经营情况
4.1.3 营收构成
4.1.4 研发与投资
4.1.5 在华业务
4.1.6 发展前景
4.2 SABMiller
4.2.1 企业简介
4.2.2 经营情况
4.2.3 营收构成
4.2.4 研发与投资
4.2.5 在华业务
4.2.6 发展前景
4.3 喜力集团(HEINEKEN)
4.3.1 企业简介
4.3.2 经营情况
4.3.3 营收构成
4.3.4 研发与投资
4.3.5 在华业务
4.3.6 发展前景
4.4 嘉士伯
4.4.1 企业简介
4.4.2 经营情况
4.4.3 营收构成
4.4.4 研发与投资
4.4.5 在华业务
4.4.6 发展前景
4.5 朝日啤酒
4.5.1 企业简介
4.5.2 经营情况
4.5.3 营收构成
4.5.4 研发与投资
4.5.5 啤酒业务
4.5.6 在华业务
4.5.7 发展前景
第五章 中国啤酒重点生产企业
5.1 青岛啤酒(600600)
5.1.1 企业简介
5.1.2 经营情况
5.1.3 营收构成
5.1.4 毛利率
5.1.5 客户
5.1.6 研发与投资
5.1.7 营销模式
5.1.8 发展前景
5.2 燕京啤酒(000729)
5.2.1 企业简介
5.2.2 经营情况
5.2.3 营收构成
5.2.4 毛利率
5.2.5 客户和供应商
5.2.6 研发与投资
5.2.7 发展前景
5.3 华润创业(0291.HK)
5.3.1 企业简介
5.3.2 经营情况
5.3.3 营收构成
5.3.4 毛利润
5.3.5 啤酒业务
5.3.6 发展前景
5.4 珠江啤酒(002461)
5.4.1 企业简介
5.4.2 经营情况
5.4.3 营收构成
5.4.4 毛利率
5.4.5 客户和供应商
5.4.6 投资
5.4.7 发展前景
5.5 重庆啤酒(600132)
5.5.1 企业简介
5.5.2 经营情况
5.5.3 营收构成
5.5.4 毛利率
5.5.5 发展前景
5.6 惠泉啤酒(600573)
5.6.1 企业简介
5.6.2 经营情况
5.6.3 营收构成
5.6.4 毛利率
5.6.5 客户和供应商
5.6.6 发展前景
5.7 兰州黄河
5.7.1 企业简介
5.7.2 经营情况
5.7.3 营收构成
5.7.4 毛利率
5.7.5 客户和供应商
5.7.6 发展前景
5.8 西藏发展(000752)
5.8.1 企业简介
5.8.2 经营情况
5.8.3 营收构成
5.8.4 毛利率
5.8.5 客户和供应商
5.8.6 发展前景
5.9 金威啤酒(0124.HK)
5.9.1 企业简介
5.9.2 经营情况
5.9.3 营收构成
5.9.4 发展前景
5.10 香港生力啤酒(0236.HK)
5.10.1 企业简介
5.10.2 经营情况
5.10.3 营收构成
5.10.4 客户和供应商
5.10.5 发展前景
1. Beer Industry Overview
1.1 Definition
1.2 Classification
2. Development of Global Beer Industry
2.1 Market Supply
2.2 Market Demand
2.3 Regional Distribution
2.4 Competitive Landscape
2.5 Development Trend
3. Development of China Beer Industry
3.1 Overview
3.2 Market Supply
3.3 Market Demand
3.4 Import & Export
3.5 Regional Distribution
3.6 Market Price
3.7 Competitive Landscape
3.8 Development Trend
4. Key Global Beer Brewers
4.1 Anheuser-Busch InBev
4.1.1 Profile
4.1.2 Operation
4.1.3 Revenue Structure
4.1.4 R&D and Investment
4.1.5 Business in China
4.1.6 Development Prospect
4.2 SABMiller
4.2.1 Profile
4.2.2 Operation
4.2.3 Revenue Structure
4.2.4 R&D and Investment
4.2.5 Business in China
4.2.6 Development Prospect
4.3 Heineken
4.3.1 Profile
4.3.2 Operation
4.3.3 Revenue Structure
4.3.4 R&D and Investment
4.3.5 Business in China
4.3.6 Development Prospect
4.4 Carlsberg
4.4.1 Profile
4.4.2 Operation
4.4.3 Revenue Structure
4.4.4 R&D and Investment
4.4.5 Business in China
4.4.6 Development Prospect
4.5 Asahi
4.5.1 Profile
4.5.2 Operation
4.5.3 Revenue Structure
4.5.4 R&D and Investment
4.5.5 Beer Business
4.5.6 Business in China
4.5.7 Development Prospect
5. Key Chinese Beer Brewers
5.1 Tsingtao Brewery (600600)
5.1.1 Profile
5.1.2 Operation
5.1.3 Revenue Structure
5.1.4 Gross Margin
5.1.5 Clients
5.1.6 R&D and Investment
5.1.7 Marketing Mode
5.1.8 Development Prospect
5.2 Beijing Yanjing Brewery (000729)
5.2.1 Profile
5.2.2 Operation
5.2.3 Revenue Structure
5.2.4 Gross Margin
5.2.5 Clients and Suppliers
5.2.6 R&D and Investment
5.2.7 Development Prospect
5.3 China Resources Enterprise (0291.HK)
5.3.1 Profile
5.3.2 Operation
5.3.3 Revenue Structure
5.3.4 Gross Profit
5.3.5 Beer Business
5.3.6 Development Prospect
5.4 Guangzhou Zhujiang Brewery (002461)
5.4.1 Profile
5.4.2 Operation
5.4.3 Revenue Structure
5.4.4 Gross Margin
5.4.5 Clients and Suppliers
5.4.6 Investment
5.4.7 Development Prospect
5.5 Chongqing Brewery (600132)
5.5.1 Profile
5.5.2 Operation
5.5.3 Revenue Structure
5.5.4 Gross Margin
5.5.5 Development Prospect
5.6 Fujian Yanjing Huiquan Brewery (600573)
5.6.1 Profile
5.6.2 Operation
5.6.3 Revenue Structure
5.6.4 Gross Margin
5.6.5 Client and Supplier
5.6.6 Development Prospect
5.7 Lanzhou Huanghe Enterprise (000929)
5.7.1 Profile
5.7.2 Operation
5.7.3 Revenue Structure
5.7.4 Gross Margin
5.7.5 Clients and Suppliers
5.7.6 Development Prospect
5.8 Tibet Galaxy Science & Technology Development (000752)
5.8.1 Profile
5.8.2 Operation
5.8.3 Revenue Structure
5.8.4 Gross Margin
5.8.5 Clients and Suppliers
5.8.6 Development Prospect
5.9 Kingway Brewery (0124.HK)
5.9.1 Profile
5.9.2 Operation
5.9.3 Revenue Structure
5.9.4 Development Prospect
5.10 San Miguel Brewery Hong Kong (0236.HK)
5.10.1 Profile
5.10.2 Operation
5.10.3 Revenue Structure
5.10.4 Clients and Suppliers
5.10.5 Development Prospect
图:啤酒生产工艺
表:啤酒分类(按生产工艺)
表:啤酒分类(按色泽)
表:啤酒分类(按麦汁浓度)
图:2007-2011年全球啤酒产量及同比增长
图:2011年全球前10大国家啤酒产量占比
表:2004-2010年全球前10大啤酒消费国消费量(Millions of barrels)
图:2010年全球(分国家)人均啤酒消费量(升/人)
图:2010年全球(分地区)啤酒消费量占比
图:2010年全球四大啤酒厂商啤酒市场份额
表:2010年全球啤酒(分国家)前三大啤酒品牌及市场占有率
图:2007-2012年中国啤酒产量及同比增长
图:2007-2012年中国啤酒销量及同比增长
图:2005-2012年中国啤酒产销率
图:2001-2012年中国啤酒毛利率
图:2004-2011年中国人均啤酒消费量
图:2008-2012年中国啤酒进出口量
图:2008-2012年中国啤酒进出口金额
图:2007-2012年中国啤酒(分地区)产量
表:2008-2012年中国前10大啤酒生产省份(单位:万千升)
图:2009-2012年中国大麦进口月度价格
图:2008-2012年中国主要啤酒企业啤酒业务收入
图:2009-2012年中国啤酒(分企业)销量
图:2008-2012年中国啤酒部分企业(按销量)市场占有率
表:2011年中国四大啤酒企业市场布局
图:2012年中国前6大啤酒品牌价值
表:2010-2015年中国啤酒产销量和产销率
图:2007-2012年百威英博营业收入及同比增长
图:2009-2012年百威英博毛利润及同比增长
图:2009-2012年百威英博啤酒销量及同比增长
图:2010-2012年百威英博(分地区)营业收入
图:2009-2012年百威英博(分地区)啤酒销量占比
表:2009-2011年百威英博研发费用及占营业收入的比重
表:2011年百威英博在中国的主要子公司分布
表:2011-2014年百威英博在中国主要建设项目(万千升、百万元)
表:2010-2014年百威英博营业收入与毛利润及同比增长
表:SABmiller发展战略
图:FY2008-FY2013年SABmiller公司营业收入及同比增长
图:FY2009-FY2013年SABmiller啤酒销量及同比增长
图:FY2008-FY2013年SABmiller(分地区)营业收入
图:FY2009-FY2013年SABmiller(分地区)啤酒销量
表:FY2009-FY2012年SABmiller公司研发支出及占比
表:FY2011-FY2015年SABmiller公司营业收入及同比增长
图:2007-2012年喜力集团营业收入及同比增长
图:2007-2012年喜力集团净利润及同比增长
图:2007-2012年喜力集团啤酒销量及同比增长
图:2010-2012年喜力集团(分地区)营业收入
图:2010-2012年喜力集团(分地区)啤酒销量
表:2007-2011年喜力集团研发投入与占比
表:2011年喜力集团主要收购企业
表:2010-2015年喜力集团营业收入与净利润及同比增长
图:2007-2012年嘉士伯营业收入及同比增长
图:2008-2012年嘉士伯毛利润及同比增长
图:2007-2012年嘉士伯啤酒销量及同比增长
图:2010-2012年嘉士伯(分地区)营业收入
表:2008-2011年嘉士伯研发费用及占比
表:2011年嘉士伯在中国重点子公司分布
表:2010-2014年嘉士伯营业收入与毛利润及同比增长
图:2011年朝日集团(分国家)子公司分布
图:2012年朝日集团(分业务)结构
图:2007-2012年朝日集团营业收入及同比增长
图:2007-2012年朝日集团净利润及同比增长
图:2007-2012年朝日集团(分业务/地区)营业收入
图:2007-2011年朝日集团研发费用
图:2007-2011年朝日集团啤酒业务销售收入及同比增长
图:2010-2011年朝日集团啤酒业务(分场所)营业收入占比
图:2007-2011年朝日集团啤酒销量及同比增长
表:2011年朝日集团在中国重点子公司分布
表:2010-2014年朝日集团营业收入与净利润及同比增长
图:2011年青岛啤酒公司股权结构
图:2009-2011年青岛啤酒品牌价值
图:2006-2012年青岛啤酒营业收入及同比增长
图:2006-2012年青岛啤酒净利润及同比增长
图:2008-2012年青岛啤酒(分品牌)销量及同比增长
图:2006-2012年青岛啤酒(分产品)营业收入占比
图:2006-2012年青岛啤酒(分地区)营业收入
图:2006-2012年青岛啤酒啤酒产品毛利率及销售毛利率
表:2009-2012年青岛啤酒前5名客户营业收入贡献及占比
表:2010-2011年青岛啤酒公司前5名客户名称、营业收入贡献及占比
表:2009-2011年青岛啤酒公司研发支出及占比
表:2006-2011年青岛啤酒主要收购事件
表:2011-2014年青岛啤酒重大建设项目(单位:万千升/年、百万元)
图:青岛啤酒“大客户”模式
表:2006-2012年青岛啤酒公司体育营销活动
图:青岛啤酒“三位一体”营销模式
表:2011年青岛啤酒(分品牌)产品分类
表:2010-2014年青岛啤酒公司营业收入和净利润及同比增长
图:2009-2011年燕京啤酒(分品牌)品牌价值
图:2006-2012年燕京啤酒营业收入及同比增长
图:2006-2012年燕京啤酒净利润及同比增长
图:2008-2012年燕京啤酒公司啤酒销量及同比增长
图:2011-2012年燕京啤酒(分产品)营业收入占比
图:2008-2011年燕京啤酒(分地区)营业收入占比
图:2010-2012年燕京啤酒公司(分产品)毛利率
表:2008-2012年燕京啤酒前5名供应商采购金额及占比、前5名客户营业收入贡献合计及占比
表:2011-2012年燕京啤酒前5名客户名称、营业收入贡献及占比
表:截止2012年6月燕京啤酒在建项目
表:2010-2014年燕京啤酒公司营业收入、净利润及同比增长
表:2011年华润创业(分业务)主要事件分布
图:2007-2012年华润创业营业收入及同比增长
图:2007-2012年华润创业公司净利润及同比增长
图:2010-2011年华润创业(分业务)营业收入占比
图:2009-2011年华润创业(分地区)营业收入占比
图:2007-2012年华润创业毛利润及同比增长
图:2009-2012年华润创业啤酒业务营业收入及同比增长
图:2008-2012年华润创业啤酒业务(分品牌)销量及同比增长
表:2010-2012年华润创业啤酒厂个数及啤酒产能
表:截止2011年底华润创业公司(分地区)啤酒厂分布
表:2003-2011年华润创业在中国主要啤酒收购大事件
表:2010-2014年华润创业公司营业收入与净利润及同比增长
表:截止2011年底珠江啤酒公司(分子公司)产能分布(单位:万千升/年)
图:2006-2012年珠江啤酒公司营业收入及同比增长
图:2006-2012年珠江啤酒净利润及同比增长
图:2007-2011年珠江啤酒销量及同比增长
图:2007-2012年珠江啤酒(分产品)营业收入
图:2011年珠江啤酒(分地区)营业收入占比
图:2007-2012年珠江啤酒(分产品)毛利率
表:2007-2012年珠江啤酒前5名客户营业收入合计贡献及占比和前5名供应商合计采购金额及占比
表:2010-2011年珠江啤酒前5名客户名称、营业收入贡献及占比
截止2011年珠江啤酒重点在建工程
表:2010-2014年珠江啤酒公司营业收入、净利润及同比增长
图:2007-2012年重庆啤酒营业收入及同比增长
图:2007-2012年重庆啤酒净利润及同比增长
表:2010-2012年重庆啤酒前5名客户合计营业收入贡献及占比
图:2009-2012年重庆啤酒销量及同比增长
图:2007-2012年重庆啤酒(分产品)营业收入
图:2011年重庆啤酒(分地区)营业收入占比
图:2007-2012年重庆啤酒(分产品)毛利率
表:2010-2014年重庆啤酒营业收入、净利润及同比增长
图:2007-2012年惠泉啤酒营业收入及同比增长
图:2007-2012年惠泉啤酒净利润及同比增长
图:2009-2012年惠泉啤酒销量及同比增长
图:2009-2012年惠泉啤酒(分产品)营业收入
图:2007-2012年惠泉啤酒(分地区)营业收入
图:2009-2012年惠泉啤酒(分产品)毛利率
表:2010-2012年惠泉啤酒前5名供应商合计采购金额及占比与前5名客户合计营业收入及占比
表:2010-2014年惠泉啤酒营业收入、净利润及同比增长
图:2007-2012年兰州黄河公司营业收入及同比增长
图:2007-2012年兰州黄河净利润及同比增长
图:2007-2012年兰州黄河(分产品)营业收入
图:2007-2012年兰州黄河(分地区)营业收入
图:2007-2012年兰州黄河(分产品)毛利率
表:2009-2012年兰州黄河公司前5名供应商合计采购金额及占比、前5名客户合计营业收入金额及占比
表:2012上半年兰州黄河公司前5名客户名称、营业收入贡献及占比
表:2010-2014年兰州黄河营业收入、净利润及同比增长
图:2007-2012年西藏发展公司营业收入及同比增长
图:2007-2012年西藏发展公司净利润及同比增长
图:2007-2012年西藏发展(分产品)营业收入
图:2007-2012年西藏发展(分地区)营业收入
图:2007-2012年西藏发展(分产品)毛利率
表:2010-2012上半年西藏发展公司前5名供应商采购金额占比与前5名客户合计营业收入及占比
表:2011年西藏发展前5名客户名称、营业收入贡献及占比
表:2010-2014年西藏发展营业收入与净利润及同比增长
图:2007-2012年金威啤酒营业收入及同比增长
图:2007-2012年金威啤酒毛利润及同比增长
图:2007-2012年金威公司啤酒销量及同比增长
图:2010-2012年金威啤酒(分地区)营业收入
表:2010-2014年金威公司营业收入与毛利润及同比增长
图:2007-2012年香港生力啤酒公司营业收入及同比增长
图:2009-2012年香港生力啤酒公司毛利润及同比增长
图:2010-2012年香港生力啤酒公司(分地区)营业收入
表:2009-2011年香港生力啤酒公司前5名供应商采购金额占比及前5名客户营业收入贡献占比
表:2010-2014年香港生力啤酒公司营业收入与毛利润及同比增长
Beer Production Technology
Beer Classification (by Production Technology)
Beer Classification (by Color)
Beer Classification (by Wort Concentration)
Global Beer Production and YoY Growth Rate, 2007-2011
Proportion of Beer Production of World’s Top 10 Countries, 2011
Consumption of World’s Top 10 Beer Consuming Countries, 2004-2010
Global Beer Consumption Per Capita (by Country), 2010
Global Beer Consumption Structure (by Region), 2010
Market Share of World’s Top 4 Beer Brewers, 2010
Top 3 Global Beer Brands and Market Share (by Country), 2010
Beer Output and YoY Growth Rate in China, 2007-2012
Beer Sales Volume and YoY Growth Rate in China, 2007-2012
Beer Sales-Output Ratio in China, 2005-2012
Gross Margin of Beer in China, 2001-2012
Chinese Beer Consumption Per Capita, 2004-2011
China’s Beer Import and Export Volume, 2008-2012
China’s Beer Import and Export Value, 2008-2012
China’s Beer Output (by Region), 2007-2012
China’s Top 10 Beer Producing Provinces, 2008-2012
Monthly Wheat Import Price in China, 2009-2012
Beer Business Revenue of Main Beer Companies in China, 2008-2012
China’s Beer Sales Volume (by Company), 2009-2012
Market Share of Some Chinese Beer Companies (by Sales Volume), 2008-2012
Market Layout of China’s Top 4 Beer Companies, 2011
Value of China’s Top 6 Beer Brands, 2012
Beer Output, Sales Volume and Sales-Output Ratio in China, 2010-2015
Revenue and YoY Growth Rate of Anheuser-Busch InBev, 2007-2012
Gross Profit and YoY Growth Rate of Anheuser-Busch InBev, 2009-2012
Beer Sales Volume and YoY Growth Rate of Anheuser-Busch InBev, 2009-2012
Revenue Breakdown of Anheuser-Busch InBev (by Region), 2010-2012
Beer Sales Volume Structure of Anheuser-Busch InBev (by Region), 2009-2012
R&D Costs and % of Total Revenue of Anheuser-Busch InBev, 2009-2011
Distribution of Anheuser-Busch InBev’s Key Subsidiaries in China, 2011
Key Construction Projects of Anheuser-Busch InBev in China, 2011-2014
Revenue, Gross Profit and YoY Growth Rate of Anheuser-Busch InBev, 2010-2014
SABmiller’s Development Strategy
Revenue and YoY Growth Rate of SABmiller, FY2008-FY2013
Beer Sales Volume and YoY Growth Rate of SABmiller, FY2009-FY2013
Revenue Breakdown of SABmiller (by Region), FY2008-FY2013
Beer Sales Volume Breakdown of SABmiller (by Region), FY2009-FY2013
R&D Costs and % of Total Revenue of SABmiller, FY2009-FY2012
Revenue and YoY Growth Rate of SABmiller, FY2011-FY2015
Revenue and YoY Growth Rate of Heineken, 2007-2012
Net Income and YoY Growth Rate of Heineken, 2007-2012
Beer Sales Volume and YoY Growth Rate of Heineken, 2007-2012
Revenue Breakdown of Heineken (by Region), 2010-2012
Beer Sales Volume Breakdown of Heineken (by Region), 2010-2012
R&D Costs and % of Total Revenue of Heineken, 2007-2011
Main Companies Acquired by Heineken, 2011
Revenue, Net Income and YoY Growth Rate of Heineken, 2010-2015
Revenue and YoY Growth Rate of Carlsberg, 2007-2012
Gross Profit and YoY Growth Rate of Carlsberg, 2008-2012
Beer Sales Volume and YoY Growth Rate of Carlsberg, 2007-2012
Revenue Breakdown of Carlsberg (by Region), 2010-2012
R&D Costs and % of Total Revenue of Carlsberg, 2008-2011
Distribution of Carlsberg’s Key Subsidiaries in China, 2011
Revenue, Gross Profit and YoY Growth Rate of Carlsberg, 2010-2014
Subsidiary Distribution of Asahi (by country), 2011
Asahi’s Structure (by Business), 2012
Revenue and YoY Growth Rate of Asahi, 2007-2012
Net Income and YoY Growth Rate of Asahi, 2007-2012
Revenue Breakdown of Asahi (by Business / Region), 2007-2012
R&D Costs of Asahi, 2007-2011
Beer Sales and YoY Growth Rate of Asahi, 2007-2011
Beer Revenue Structure of Asahi (by Location), 2010-2011
Beer Sales Volume and YoY Growth Rate of Asahi, 2007-2011
Distribution of Asahi’s Key Subsidiaries in China, 2011
Revenue, Net Income and YoY Growth Rate of Asahi, 2010-2014
Ownership Structure of Tsingtao Brewery, 2011
Brand Value of Tsingtao Brewery, 2009-2011
Revenue and YoY Growth Rate of Tsingtao Brewery, 2006-2012
Net Income and YoY Growth Rate of Tsingtao Brewery, 2006-2012
Sales Volume and YoY Growth Rate of Tsingtao Brewery (by Brand), 2008-2012
Revenue Structure of Tsingtao Brewery (by Product), 2006-2012
Revenue Breakdown of Tsingtao Brewery (by Region), 2006-2012
Beer Product Gross Margin and Sales Gross Margin of Tsingtao Brewery, 2006-2012
Tsingtao Brewery’s Revenue from Top 5 Clients and % of Total Revenue, 2009-2012
Name List and Revenue Contribution of Tsingtao Brewery’s Top 5 Clients, 2010-2011
R&D Costs and % of Total Revenue of Tsingtao Brewery, 2009-2011
Major Acquisition Events of Tsingtao Brewery, 2006-2011
Key Construction Projects of Tsingtao Brewery, 2011-2014
“Big Customer” Model of Tsingtao Brewery
Sports Marketing Activities of Tsingtao Brewery, 2006-2012
Product Classification of Tsingtao Brewery (by Brand), 2011
Revenue, Net Income and YoY Growth Rate of Tsingtao Brewery, 2010-2014
Brand Value of Beijing Yanjing Brewery (by Brand), 2009-2011
Revenue and YoY Growth Rate of Beijing Yanjing Brewery, 2006-2012
Net Income and YoY Growth Rate of Beijing Yanjing Brewery, 2006-2012
Beer Sales Volume and YoY Growth Rate of Beijing Yanjing Brewery, 2008-2012
Revenue Structure of Beijing Yanjing Brewery (by Product), 2011-2012
Revenue Structure of Beijing Yanjing Brewery (by Region), 2008-2011
Gross Margin Breakdown of Beijing Yanjing Brewery (by Product), 2010-2012
Beijing Yanjing Brewery’s Procurement / Revenue from Top 5 Suppliers / Clients and % of Total Procurement / Revenue, 2008-2012
Name List and Revenue Contribution of Beijing Yanjing Brewery’s Top 5 Clients, 2011-2012
Projects under Construction of Beijing Yanjing Brewery by June 2012
Revenue, Net Income and YoY Growth Rate of Beijing Yanjing Brewery, 2010-2014
Distribution of Major Events of China Resources Enterprise (by Business), 2011
Revenue and YoY Growth Rate of China Resources Enterprise, 2007-2012
Net Income and YoY Growth Rate of China Resources Enterprise, 2007-2012
Revenue Structure of China Resources Enterprise (by Business), 2010-2011
Revenue Structure of China Resources Enterprise (by Region), 2009-2011
Gross Profit and YoY Growth Rate of China Resources Enterprise, 2007-2011
Beer Revenue and YoY Growth Rate of China Resources Enterprise, 2009-2012
Beer Sales Volume and YoY Growth Rate of China Resources Enterprise (by Brand), 2008-2012
Brewery Number and Beer Capacity of China Resources Enterprise, 2010-2012
Brewery Distribution of China Resources Enterprise (by Region) by end-2011
Major Beer Acquisition Events of China Resources Enterprise in China, 2003-2011
Revenue, Net Income and YoY Growth Rate of China Resources Enterprise, 2010-2014
Capacity Distribution of Guangzhou Zhujiang Brewery (by Subsidiary) as of end-2011
Revenue and YoY Growth Rate of Guangzhou Zhujiang Brewery, 2006-2012
Net Income and YoY Growth Rate of Guangzhou Zhujiang Brewery, 2006-2012
Sales Volume and YoY Growth Rate of Guangzhou Zhujiang Brewery, 2007-2011
Revenue Breakdown of Guangzhou Zhujiang Brewery (by Product), 2007-2012
Revenue Structure of Guangzhou Zhujiang Brewery (by Region), 2011
Gross Margin Breakdown of Guangzhou Zhujiang Brewery (by Product), 2007-2012
Guangzhou Zhujiang Brewery’s Revenue / Procurement from Top 5 Clients / Suppliers and % of Total Revenue / Procurement, 2007-2012
Name List and Revenue Contribution of Guangzhou Zhujiang Brewery’s Top 5 Clients, 2010-2011
Key Projects under Construction of Guangzhou Zhujiang Brewery by 2011
Revenue, Net Income and YoY Growth Rate of Guangzhou Zhujiang Brewery, 2010-2014
Revenue and YoY Growth Rate of Chongqing Brewery, 2007-2012
Net Income and YoY Growth Rate of Chongqing Brewery, 2007-2012
Chongqing Brewery’s Revenue from Top 5 Clients and % of Total Revenue, 2010-2012
Sales Volume and YoY Growth Rate of Chongqing Brewery, 2009-2012
Revenue Breakdown of Chongqing Brewery (by Product), 2007-2012
Revenue Structure of Chongqing Brewery (by Region), 2011
Gross Margin Breakdown of Chongqing Brewery (by Product), 2007-2012
Revenue, Net Income and YoY of Chongqing Brewery, 2010-2014
Revenue and YoY Growth Rate of Fujian Yanjing Huiquan Brewery, 2007-2012
Net Income and YoY Growth Rate of Fujian Yanjing Huiquan Brewery, 2007-2012
Sales Volume and YoY Growth Rate of Fujian Yanjing Huiquan Brewery, 2009-2012
Revenue Breakdown of Fujian Yanjing Huiquan Brewery (by Product), 2009-2012
Revenue Breakdown of Fujian Yanjing Huiquan Brewery (by Region), 2007-2012
Gross Margin Breakdown of Fujian Yanjing Huiquan Brewery (by Product), 2009-2012
Fujian Yanjing Huiquan Brewery’s Procurement / Revenue from Top 5 Suppliers / Clients and % of Total Procurement / Revenue, 2010-2012
Revenue, Net Income and YoY Growth Rate of Fujian Yanjing Huiquan Brewery, 2010-2014
Revenue and YoY Growth Rate of Lanzhou Huanghe Enterprise, 2007-2012
Net Income and YoY Growth Rate of Lanzhou Huanghe Enterprise, 2007-2012
Revenue Breakdown of Lanzhou Huanghe Enterprise (by Product), 2007-2012
Revenue Breakdown of Lanzhou Huanghe Enterprise (by Region), 2007-2012
Gross Margin Breakdown of Lanzhou Huanghe Enterprise (by Product), 2007-2012
Lanzhou Huanghe Enterprise’s Procurement / Revenue from Top 5 Suppliers / Clients and % of Total Procurement / Revenue, 2009-2012
Name List and Revenue Contribution of Lanzhou Huanghe Enterprise, H1 2012
Revenue, Net Income and YoY Growth Rate of Lanzhou Huanghe Enterprise, 2010-2014
Revenue and YoY Growth Rate of Tibet Galaxy Science & Technology Development, 2007-2012
Net Income and YoY Growth Rate of Tibet Galaxy Science & Technology Development, 2007-2012
Revenue Breakdown of Tibet Galaxy Science & Technology Development (by Product), 2007-2012
Revenue Breakdown of Tibet Galaxy Science & Technology Development (by Region), 2007-2012
Gross Margin Breakdown of Tibet Galaxy Science & Technology Development (by Product), 2007-2012
Tibet Galaxy Science & Technology Development’s Procurement / Revenue from Top 5 Suppliers / Clients and % of Total Procurement / Revenue, 2009-2012
Name List and Revenue Contribution of Tibet Galaxy Science & Technology Development, 2011
Revenue, Net Income and YoY Growth Rate of Tibet Galaxy Science & Technology Development, 2010-2014
Revenue and YoY Growth Rate of Kingway Brewery, 2007-2012
Gross Profit and YoY Growth Rate of Kingway Brewery, 2007-2012
Beer Sales Volume and YoY Growth Rate of Kingway, 2007-2012
Revenue Breakdown of Kingway Brewery (by Region), 2010-2012
Revenue, Gross Profit and YoY Growth Rate of Kingway, 2010-2014
Revenue and YoY Growth Rate of San Miguel Brewery Hong Kong, 2007-2012
Gross Profit and YoY Growth Rate of San Miguel Brewery Hong Kong, 2009-2012
Revenue Breakdown of San Miguel Brewery Hong Kong (by Region), 2010-2012
San Miguel Brewery Hong Kong’s Procurement / Revenue from Top 5 Suppliers / Clients and % of Total Procurement / Revenue, 2009-2011
Revenue, Gross Profit and YoY Growth Rate of San Miguel Brewery Hong Kong, 2010-2014
如果这份报告不能满足您的要求,我们还可以为您定制报告,请 留言说明您的详细需求。
|