|
|
|
报告导航:研究报告—
TMT产业—电子半导体
|
|
2012年全球及中国柔性线路板(软板 FPCB)行业研究报告 |
 |
字数:3.2万 |
页数:175 |
图表数:156 |
|
中文电子版:9000元 |
中文纸版:4500元 |
中文(电子+纸)版:9500元 |
|
英文电子版:2500美元 |
英文纸版:2600美元 |
英文(电子+纸)版:2800美元 |
|
编号:ZYW137
|
发布日期:2012-12 |
附件:下载 |
 |
|
|
2012年全球及中国柔性线路板行业研究报告包括以下内容:
- 1、FPCB简介
- 2、FPCB市场与产业格局
- 3、22家主要FPCB厂家研究
- 4、9家FCCL厂家研究
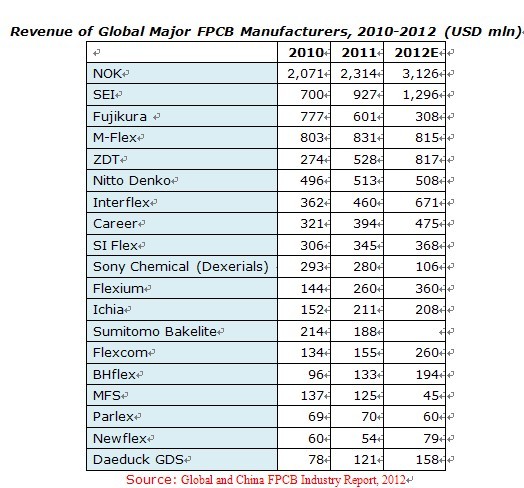
2012年是FPCB厂家的丰收年,任何热门的电子产品都是FPCB的市场,尤其是平板电脑和智能手机强力拉动了FPCB市场。2012年全球FPCB市场规模达10680百万美元,比2011年增长15.2%,这是所有电子零组件中成长力度最强的。2013年会延续这种强劲增长的势头,预计全球FPCB市场会达到11628百万美元,比2012年增长8.9%。 虽然市场很好,但不是所有厂家都能抓住市场。2012年业务下滑最厉害的莫过于Fujikura,在2011年底泰国洪水中其FPCB业务遭到重创,直到2012年底也没有恢复,收入大幅度下滑,只有2011年的一半。不过2013年Fujikura的FPCB业务就可以慢慢恢复,但是订单不可能在短时间内重新获得,因此2013年Fujikura得继续过苦日子。 龙头厂家NOK高歌猛进,Fujikura留下的市场空缺都被NOK占领。2012年其业绩将第一次突破30亿美元大关,远远抛开第二名。 鸿海旗下的臻鼎(ZDT)大幅度增长,苹果是臻鼎的主要客户。2012年ZDT从M-FLEX那里夺得了更多来自苹果的订单,结果M-FLEX的收入轻微下滑。M-FLEX在美国上市,总部在新加坡,生产基地在中国。 受益于三星智能手机热卖,韩国的FPCB厂家都取得了不错的成绩。Interflex不仅是三星的主力供应商,也是苹果的供应商。考虑到和三星的竞争关系,Interflex获得苹果的订单有所减少,不过来自三星的订单足以让Interflex取得好成绩。 FLEXCOM 70%的收入都来自三星,2012年收入大增67.7%。SI FLEX则受大客户LG下滑的拖累。 台湾厂家中FLEXIUM是苹果的供应商,CAREER则主要供应大陆市场。 虽然中国大陆曾经出现过数十家FPCB厂家,但规模都很小,年收入多在2亿人民币以下,很难获得稳定的订单。虽然整体市场很好,但是大陆厂家未能充分享受到市场扩大带来的好处,收入多年未见大的增长。 2012年另一个现象是有些把FPCB业务当非核心业务的厂家开始退出。如住友电木在2012年9月宣布退出FPCB业务,另一个是索尼化学。2012年10月1日,Sony Chemical & Information Device Corporation将化学品业务出售给日本政府机构,同时更名为Dexerials,该公司60%的股份归Development Bank of Japan,40%的股份由Unison Capital私募基金获得。今后Dexerials主要发展方向是Adhesive materials, Optical materials。此外NITTO DENKO的核心业务也不是FPCB,也有可能出售。
全球主要FPCB厂家2010-2012年收入(百万美元)
Global and China Flexible Printed Circuit Board (FPCB) Industry Report, 2012 includes the following contents:
1. Profile of FPCB
2. Overview of FPCB Market and Industry
3. Analysis of 22 Major FPCB Manufacturers
4. Analysis of Nine FCCL Companies
2012 is a bumper year for FPCB manufacturers, since FPCB is used in almost all popular electronic products, especially tablet PC and smart phone which have strongly promoted the FPCB market. The global FPCB market scale reached USD 10,680 million in 2012, an increase of 15.2% compared with 2011. FPCB achieved the strongest growth among all electronic parts and components in 2012, and will maintain the strong growth momentum in 2013. The global FPCB market scale is expected to reach USD 11,628 million in 2013, up 8.9% compared with 2012.
Although the market conditions are good, not all manufacturers can seize the opportunities. Fujikura suffered the most serious business decline in 2012. Its FPCB business was heavily hit by the flood in Thailand at the end of 2011, hasn’t recovered so far, and the revenue declined significantly to only half of that in 2011. In 2013, Fujikura’s FPCB business will recover slowly, but will be unlikely to regain orders in a short period of time, so Fujikura will continue to have a tough time in 2013.
Advancing triumphantly, industry leader NOK occupied the market vacancy left by Fujikura, and for the first time its revenue exceeded USD 3 billion in 2012, far beyond the second place.
ZDT of Hon Hai achieved substantial growth. With Apple as its major customer, it grabbed more Apple orders from M-Flex in 2012, leading to slight decline in the revenue of M-Flex. M-Flex is headquartered in Singapore, listed in the United States, and has production bases in China.
Benefiting from the popularity of Samsung smart phones, South Korean FPCB manufacturers have delivered a good performance. Interflex is not only a major supplier of Samsung, but a supplier of Apple. Taking into account the competition with Samsung, Interflex’ orders from Apple declined, but the orders from Samsung are enough for Interflex to achieve good results.
Flexcom gets 70% of its revenue from Samsung, and its revenue soared by 67.7% in 2012. SI Flex was dragged down by its big customer LG.
Among Taiwanese manufacturers, Flexium is a supplier of Apple, and Career mainly supplies the mainland Chinese market.
Although there have been dozens of FPCB manufacturers in Mainland China, their business scale is very small, the annual revenue is mostly under RMB 200 million, and it’s difficult for them to obtain stable orders. The overall market is very good, but mainland Chinese manufacturers are unable to fully enjoy the benefits of market expansion and achieve significant revenue growth.
Another phenomenon in 2012 is that some manufacturers that take FPCB business as a non-core business began to withdraw from the business. For example, SUMITOMO BAKELITE Co., Ltd.announced its withdrawal from the FPCB business in Sep.2012; on October 1, 2012, Sony Chemical & Information Device Corporation sold its chemicals business to a Japanese government agency, and renamed Dexerials, with 60% and 40% of the shares held by Development Bank of Japan and Unison Capital respectively. The main development direction of Dexerials will be adhesive materials and optical materials. In addition, FPCB is also not the core business of NITTO DENKO, and may be sold too.
第一章:FPC市场
1.1、FPC市场规模
1.2、硬盘产业
1.3、硬盘产业格局
1.4、光盘驱动器
1.5、手机MOBILE PHONE
1.5.1、手机软板应用
1.5.2、全球手机市场规模
1.5.3、手机品牌市场占有率
1.5.4、智能手机市场与产业
1.5.5、中国手机产业地域分布
1.5.6、中国手机企业产量排名
1.5.7、中国手机出口规模
1.5.8、中国手机出口特点
1.5.9、中国手机出口地域分布
1.6、触控面板
1.6.1、触控面板市场规模与分布
1.6.2、触控面板产业格局
1.6.3、触控屏客户供应关系
1.7、笔记本电脑
1.7.1、全球笔记本电脑市场规模与品牌格局
1.7.2、平板电脑市场
1.7.3、ULTRABOOK
第二章:软板产业
2.1、软板产业链
2.2、FPCB厂家业务模式
2.3、FPC产业地域分布
2.4、FPCB客户供应关系
2.5、手机软板供应关系
2.6、FPCB厂家排名
第三章、FPCB厂家研究
3.1、FUJIKURA(藤仓)
3.1.1、藤仓电子(上海)有限公司
4.1.2、藤仓电子(无锡)有限公司
3.2、NIPPON MEKTRON(旗胜)
3.2.1、珠海紫翔电子科技有限公司
3.2.2、苏州紫翔电子科技有限公司
3.3、日东电工
3.4、索尼凯美高
3.5、M-FLEX
3.6、台郡科技
3.7、嘉联益
3.8、旭软
3.9、珠海元盛
3.10、安捷利
3.11、精诚达(JINGCHENGDA)
3.12、景旺
3.13、 金达(珠海)电路版
3.14、新福莱科斯
3.15、住友电木
3.16、PARLEX
3.17、SI FLEX
3.18、住友电工
3.19、DAEDUCK GDS
3.20、INTERFLEX
3.21、奈电软性科技有限公司NETRON SOFT-TECH
3.22、范桓BHFLEX
3.23、NEWFLEX
3.24、FLEXCOM
3.25、MFS
3.26、毅嘉
3.27、臻鼎
第四章:FCCL厂家
4.1、宏仁电子
4.2、台虹科技
4.3、新扬科技
4.4、新日本制铁化学NIPPON STEEL CHEMICAL
4.5、有泽制造所
4.6、律胜科技MICROCOSM
4.7、亚洲电材AEM
4.8、达迈科技
1. FPC Market 1.1 FPC Market Scale 1.2 HDD Industry 1.3 HDD Industry Structure 1.4 ODD 1.5 Mobile Phone 1.5.1 FPCB for Mobile Phone 1.5.2 Global Mobile Phone Market Scale 1.5.3 Market Share of Mobile Phone by Brand 1.5.4 Smart Phone Market and Industry 1.5.5 China Mobile Phone Industry by Region 1.5.6 Ranking of Mobile Phone Vendors by Output 1.5.7 China Mobile Phone Export 1.5.8 Highlights of China Mobile Phone Export 1.5.9 China Mobile Phone Export by Region 1.6 Touch Panel 1.6.1 Touch Panel Market Scale and Distribution 1.6.2 Touch Panel Industry Structure 1.6.3 Touch Panel Supply Relationship 1.7 Notebook 1.7.1 Global Notebook Market Scale and Brand Structure 1.7.2 Tablet PC Market 1.7.3 Ultrabook
2. FPCB Industry
2.1 FPCB Industry Chain
2.2 FPCB Business Model
2.3 FPC Industry by Region
2.4 FPCB Supply Relationship
2.5 Mobile Phone FPCB Supply Relationship
2.6 Ranking of FPCB Manufacturers
3. FPCB Manufacturers
3.1 Fujikura
3.1.1 Fujikura Electronics Shanghai
4.1.2 Fujikura Electronics Wuxi
3.2 Nippon Mektron
3.2.1 Mektec Manufacturing Corporation (Zhuhai)
3.2.2 Mektec Manufacturing Corporation (Suzhou)
3.3 Nitto Denko
3.4 Sony Chemical
3.5 M-Flex
3.6 Flexium
3.7 Career
3.8 Sunflex
3.9 Zhuhai Topsun
3.10 AKM
3.11 Jingchengda
3.12 Kinwong
3.13 Jinda PCB
3.14 Xiamen New Flex
3.15 Sumitomo Bakelite
3.16 Parlex
3.17 SI Flex
3.18 Sumitomo Electric Industries
3.19 Daeduck GDS
3.20 Interflex
3.21 Netron Soft-Tech
3.22 BHflex
3.23 Newflex
3.24 Flexcom
3.25 MFS
3.26 Ichia
3.27 ZDT
4. FCCL Companies
4.1 Grace Electron
4.2 Taiflex
4.3 ThinFlex
4.4 Nippon Steel Chemical
4.5 Arisawa
4.6 Microcosm
4.7 AEM
4.8 Taimide
2007-2013年FPC市场规模
2007-2013年FPC市场下游分布
1998-2008年全球硬盘出货量
2009-2014年全球硬盘出货量
2009-2014年硬盘尺寸分布
2011年全球硬盘出货量地域分布
2007年1季度-2010年2季度全球主要硬盘厂家出货量市场占有率
2011年全球硬盘主要厂家出货量市场占有率
2008-2013年光盘驱动器出货量
2010年全球光盘驱动器(ODD)主要厂家市场占有率
2007-2013年自动对焦相机手机出货量
2007-2014年全球手机出货量
2009年1季度-2011年4季度每季度全球手机出货量 与年度增幅
2010-2012年全球CDMA/WCDMA手机出货量地域分布
2010-2011年每季度全球主要手机品牌出货量
2010-2011年全球主要手机厂家出货量
2010-2011年全球主要手机厂家智能手机出货量
2011年智能手机操作系统市场占有率
2008-2015年全球各区域智能手机市场渗透率
2011年1-11月中国手机产量各省分布
2011年中国手机产量地域分布
2011年45家中国手机厂家产量排名
2000-2011年中国手机出口量与增幅
2002-2011年中国手机出口额与增幅
2002-2011年中国手机出口量与ASP
2010年1月-2011年12月中国手机出口量与平均价格
2011年我手机出口前10大市场 出货量
2008-2015年全球触控屏出货量
2010-2012年全球触控屏出货量下游应用分布
2009-2010年主要触控屏厂家收入
2010-2012年台湾主要触控屏厂家产能
2010-2012年中国大陆主要触控屏厂家产能
20111年1季度-2012年4季度苹果iPhone 触控屏供应商分布
20111年1季度-2012年4季度苹果iPad 触控屏供应商分布
台湾触控厂家主要客户
日韩触控厂家主要客户
大陆触控厂家主要客户
2007-2013年全球笔记本电脑出货量与增幅
2010-2011年全球主要笔记本电脑厂家出货量
2010年4季度-2012年1季度全球主要笔记本电脑厂家市场占有率
2008-2012年NETBOOK、iPad、平板电脑出货量
台湾软板产业链
2009-2012年全球FPCB产业收入地域分布
2010-2011年全球FPCB产业收入地域分布
2011年诺基亚软板主要供应商供应比例(金额)
2011年、2012三星软板主要供应商供应比例(金额)
2011年LG 软板主要供应商供应比例(金额)
2011年、2012苹果软板主要供应商供应比例(金额)
2009-2012年日本FPC厂家收入排名
2009-2012年韩国FPC厂家收入与运营利润率排名
2009-2012年台湾FPC厂家收入与运营利润率排名
全球主要FPCB厂家2010-2012年收入
2011年中国大陆主要FPCB厂家市场占有率
2010年全球主要FPCB厂家产能
藤仓泰国基地一览
2004-2013财年藤仓收入与运营利润统计
2008-2013财年藤仓收入部门分布
2007-2012财年藤仓运营利润部门分布
2008-2012财年藤仓电子电装部门收入产品分布
2004-2010年藤仓电子(上海)有限公司收入与运营利润
2006-2010年藤仓电子(无锡)有限公司收入与运营利润
Mektron组织结构
2006-2013财年NOK收入与运营利润
2006-2013财年NOK收入产品分布
2010-2013财年NOK收入地域分布
2010-2013财年MEKTRON FPC事业部收入地域分布
2004-2012年珠海紫翔电子科技有限公司收入与运营利润
2005-2012年日东电工收入与运营利润率
1999-2011年财年日东电工电子材料事业部收入与运营利润统计
2004-2010年索尼凯美高苏州公司部分财务数据
2004-2012财年M-FLEX收入与运营利润
2010年1季度-2011年4季度M-FLEX收入与毛利统计
2006-2011财年M-FELX收入国别结构
2006-2012财年M-FELX运营利润地域结构
2006-2012财年M-FLEX客户结构比例
2006-2011财年M-FLEX收入地域分布
2008财年1季度-2012财年4季度MFLEX收入下游分布
2002-2012年台郡收入与毛利率
2002-2012年台郡收入与运营利润率
2011年1月-2012年11月台郡收入与年增率
2009-2012年台郡收入下游应用分布
2009-2012年台郡FPC层数分布
2010年1季度-2011年4季度台郡手机、平板电脑软板出货量
台郡软板工程能力
嘉联益关联公司关系
2003-2012年嘉联益收入与运营利润率
2011年11月-2012年11月嘉联益收入与年增率
2012年年底 嘉联益各项产品产能
2012年嘉联益各工厂主要业务
2011年嘉联益大陆三子公司部分财务数据
2010年11月-2012年11月旭软每月收入与增幅
珠海元盛股东结构
元盛电子FPC技术能力
元盛电子技术能力
元盛电子设备
元盛电子2004-2010部分财务数据
2007-2010年H1珠海元盛收入下游应用分布
2007-2010年H1珠海元盛收入产品分布
2010H1珠海元盛客户分布
2004-2012年安捷利实业收入与毛利率
2004-2012年安捷利实业收入与运营利润
2009-2012年安捷利实业收入业务分布
安捷利主要客户
安捷利FPC技术能力
景旺组织结构
景旺FPC制程能力
景旺设备
2005-2012财年住友电木收入与净利润统计
2004-2012财年住友电木PCB事业部收入统计
2007-2012年SI FLEX收入与运营利润
2005-2013财年住友电工收入与运营利润
2009-2013财年住友电工各部门收入统计
2008-2013财年住友电工FPC部门收入统计
2005-2013年大德GDS收入与运营利润率
2010-2012年大德GDS收入业务分布
2003-2013年Interflex收入与运营利润率
2011年1季度-2012年4季度Interflex收入产品分布
2009-2012年Interflex收入客户分布
2009-2012年Interflex产能
2005-2012年范桓株式会社BHflex收入与运营利润
2009-2012年BHflex收入客户分布
2009-2012年BHflex收入下游应用分布
2005-2012年Newflex收入与运营利润
2006-2013年FLEXCOM收入与运营利润率
2011年FLEXCOM收入客户分布
2006-2011年MFS收入与股东应得利润
2008-2011年MFS收入地域分布
毅嘉组织结构
2006-2012年毅嘉收入与运营利润率
2011年1月-2012年11月毅嘉月度收入
臻鼎组织结构
臻鼎全球分布
2008-2012年臻鼎收入与运营利润率
2006-2011年1月底臻鼎员工数量
2011年全球FFCL厂家市场占有率
2002-2012年台虹收入与运营利润率
2010年11月-2012年11月,台虹科技收入与年增率
2009-2012年台虹产品收入结构
2011年1季度台虹客户分布
2011年11月-2012年11月新扬科技收入与年增率
2005-2013财年新日本制铁化学收入与运营利润
2006-2013财年新日本制铁化学产品收入结构
2006-2013财年有泽制造所收入与运营利润率
2006-2012财年有泽制造所收入与毛利 率
2006-2012财年有泽制造所收入产品分布
2003-2012年律胜科技收入与运营利润率
2010年10月-2012年10月律胜科技收入与年增率
2007-2012年亚洲电材收入与运营利润率
2011年亚洲电材收入产品分布
2005-2012年达迈科技收入与运营利润率
2010年11月-2012年11月达迈科技每月收入与增幅
2010-2011年达迈科技收入客户分布
2011年全球主要PI厂家市场占有率
2005-2013年INNOX收入与运营利润率
2011-2013年INNOX收入产品分布
INNOX 2012年收入客户分布
FPC Market Scale, 2007-2013
FPC Market Distribution by Application, 2007-2013
Global HDD Shipment, 1998-2008
Global HDD Shipment, 2009-2014
HDD Size Distribution, 2009-2014
Global HDD Shipment by Region, 2011
Market Share of Global Major HDD Manufacturers by Shipment, Q1 2007-Q2 2010
Market Share of Global Major HDD Manufacturers by Shipment, 2011
ODD Shipment, 2008-2013
Market Share of Global Major ODD Manufacturers, 2010
Autofocus Camera Phone Shipment, 2007-2013
Global Mobile Phone Shipment, 2007-2014
Quarterly Mobile Phone Shipment and Annual Growth Rate, Q1 2009-Q4 2011
Global CDMA/WCDMA Mobile Phone Shipment by Region, 2010-2012
Quarterly Shipment of Global Major Mobile Phone Brands, 2010-2011
Shipment of Global Major Mobile Phone Vendors, 2010-2011
Smart Phone Shipment of Global Major Mobile Phone Vendors, 2010-2011
Market Share of Smart Phone Operating System, 2011
Global Smart Phone Market Penetration by Region, 2008-2015
China’s Mobile Phone Output by Province, Jan.-Nov. 2011
China’s Mobile Phone Output by Region, 2011
Ranking of 45 Mobile Phone Vendors in China by Output, 2011
China’s Mobile Phone Export Volume and Growth Rate, 2000-2011
China’s Mobile Phone Export Value and Growth Rate, 2002-2011
China’s Mobile Phone Export Volume and ASP, 2002-2011
China’s Mobile Phone Export Volume and Average Price, Jan. 2010-Dec. 2011
Top 10 Mobile Phone Export Markets of China by Shipment, 2011
Global Touch Panel Shipment, 2008-2015
Global Touch Panel Shipment by Application, 2010-2012
Revenue of Major Touch Panel Companies, 2009-2010
Capacity of Major Taiwanese Touch Panel Companies, 2010-2012
Capacity of Major Mainland Chinese Touch Panel Companies, 2010-2012
Touch Panel Suppliers of Apple iPhone, Q1 2011-Q4 2012
Touch Panel Suppliers of Apple iPad, Q1 2011-Q4 2012
Major Customers of Taiwanese Touch Panel Companies
Major Customers of Japanese and South Korean Touch Panel Companies
Major Customers of Mainland Chinese Touch Panel Companies
Global Notebook Shipment and Growth Rate, 2007-2013
Shipment of Global Major Notebook Companies, 2010-2011
Market Share of Global Major Notebook Companies Q4 2010-Q1 2012
Shipment of Netbook, iPad and Tablet PC, 2008-2012
Taiwan FPCB Industry Chain
Revenue of Global FPCB Industry by Region, 2009-2012
Revenue of Global FPCB Industry by Region, 2010-2011
Major FPCB Suppliers of Nokia by Value, 2011
Major FPCB Suppliers of Samsung by Value, 2011-2012
Major FPCB Suppliers of LG by Value, 2011
Major FPCB Suppliers of Apple by Value, 2011-2012
Ranking of Japanese FPC Manufacturers by Revenue, 2009-2012
Ranking of South Korean FPC Manufacturers by Revenue and Operating Margin, 2009-2012
Ranking of Taiwanese FPC Manufacturers by Revenue and Operating Margin, 2009-2012
Revenue of Global Major FPCB Manufacturers, 2010-2012
Market Share of Major Mainland Chinese FPCB Manufacturers, 2011
Capacity of Global Major FPCB Manufacturers, 2010
Bases of Fujikura in Thailand
Revenue and Operating Income of Fujikura, FY2004-FY2013
Revenue of Fujikura by Division, FY2008-FY2013
Operating Income of Fujikura by Division, FY2007-FY2012
Revenue of Fujikura’s Electronics & Auto Division by Product, FY2008-FY2012
Revenue and Operating Income of Fujikura Electronics Shanghai, 2004-2010
Revenue and Operating Income of Fujikura Electronics Wuxi, 2006-2010
Organizational Structure of Mektron
Revenue and Operating Income of NOK, FY2006-FY2013
Revenue of NOK by Product, FY2006-FY2013
Revenue of NOK by Region, FY2010-FY2013
Revenue of Mektron FPC Division by Region, FY2010-FY2013
Revenue and Operating Income of Mektec Manufacturing Corporation (Zhuhai), 2004-2012
Revenue and Operating Margin of Nitto Denko, 2005-2012
Revenue and Operating Income of Nitto Denko’s Electronic Materials Division, FY1999-FY2011
Financial Data of Sony Chemical Suzhou, 2004-2010
Revenue and Operating Income of M-Flex, FY2004-FY2012
Revenue and Gross Profit of M-Flex, Q1 2010-Q4 2011
Revenue of M-Flex by Country, FY2006-FY2011
Operating Income of M-Flex by Region, FY2006-FY2012
Customer Structure of M-Flex, FY2006-FY2012
Revenue of M-Flex by Region, FY2006-FY2011
Revenue of M-Flex by Application, Q1 FY2008-Q4 FY2012
Revenue and Gross Margin of Flexium, 2002-2012
Revenue and Operating Margin of Flexium, 2002-2012
Revenue and Annual Growth Rate of Flexium, Jan. 2011-Nov. 2012
Revenue of Flexium by Application, 2009-2012
FPC Layers of Flexium, 2009-2012
Mobile Phone, Tablet PC FPCB Shipment of Flexium, Q1 2010-Q4 2011
FPCB Engineering Capacity of Flexium
Associated Companies of Career
Revenue and Operating Margin of Career, 2003-2012
Revenue and Annual Growth Rate of Career, Nov. 2011 -Nov. 2012
Capacity of Career by Product, 2012
Major Businesses of Career by Plant, 2012
Financial Data of Three Mainland Chinese Subsidiaries of Career, 2011
Monthly Revenue and Growth Rate of Sunflex, Nov. 2010 -Nov. 2012
Shareholding Structure of Zhuhai Topsun
FPC Technical Capacity of Topsun
Technical Capacity of Topsun
Equipment of Topsun
Financial Data of Topsun, 2004-2010
Revenue of Zhuhai Topsun by Application, 2007-H1 2010
Revenue of Zhuhai Topsun by Product, 2007-H1 2010
Customer Distribution of Zhuhai Topsun, H1 2010
Revenue and Gross Margin of AKM, 2004-2012
Revenue and Operating Income of AKM, 2004-2012
Revenue of AKM by Business, 2009-2012
Major Customers of AKM
FPC Technical Capacity of AKM
Organizational Structure of Kinwong
FPC Process Capacity of Kinwong
Equipment of Kinwong
Revenue and Net Income of Sumitomo Bakelite, FY2005-FY2012
Revenue of PCB Division of Sumitomo Bakelite, FY2004-FY2012
Revenue and Operating Income of SI Flex, FY2007-2012
Revenue and Operating Income of Sumitomo Electric Industries, FY2005-FY2013
Revenue of Sumitomo Electric Industries by Division, FY2009-FY2013
Revenue of FPC Division of Sumitomo Electric Industries, FY2008-FY2013
Revenue and Operating Margin of Daeduck GDS, 2005-2013
Revenue of Daeduck GDS by Business, 2010-2012
Revenue and Operating Margin of Interflex, 2003-2013
Revenue of Interflex by Product, Q1 2011-Q4 2012
Revenue of Interflex by Customer, 2009-2012
Capacity of Interflex, 2009-2012
Revenue and Operating Income of BHflex, 2005-2012
Revenue of BHflex by Customer, 2009-2012
Revenue of BHflex by Application, 2009-2012
Revenue and Operating Income of Newflex, 2005-2012
Revenue and Operating Margin of Flexcom, 2006-2013
Revenue of Flexcom by Customer, 2011
Revenue and Profit Attributable to Shareholders of MFS, 2006-2011
Revenue of MFS by Region, 2008-2011
Organizational Structure of Ichia
Revenue and Operating Margin of Ichia, 2006-2012
Monthly Revenue of Ichia, Jan. 2011-Nov. 2012
Organizational Structure of ZDT
Global Distribution of ZDT
Revenue and Operating Margin of ZDT, 2008-2012
Employment of ZDT, 2006-Jan. 2011
Market Share of Global FFCL Manufacturers, 2011
Revenue and Operating Margin of Taiflex, 2002-2012
Revenue and Annual Growth Rate of Taiflex, Nov. 2010-Nov. 2012
Revenue Structure of Taiflex by Product, 2009-2012
Customer Distribution of Taiflex, Q1 2011
Revenue and Annual Growth Rate of ThinFlex, Nov. 2011-Nov. 2012
Revenue and Operating Income of Nippon Steel Chemical, FY2005-FY2013
Revenue structure of Nippon Steel Chemical by Product, FY2006-FY2013
Revenue and Operating Margin of Arisawa, FY2006-FY2013
Revenue and Gross Margin of Arisawa, FY2006-FY2012
Revenue of Arisawa by Product, FY2006-FY2012
Revenue and Operating Margin of Microcosm, 2003-2012
Revenue and Annual Growth Rate of Microcosm, Oct. 2010-Oct. 2012
Revenue and Operating Margin of AEM, 2007-2012
Revenue of AEM by Product, 2011
Revenue and Operating Margin of Taimide, 2005-2012
Monthly Revenue and Growth Rate of Taimide, Nov. 2010-Nov. 2012
Revenue of Taimide by Customer, 2010-2011
Market Share of Global Major PI Manufacturers, 2011
Revenue and Operating Margin of Innox, 2005-2013
Revenue of Innox by Product, 2011-2013
Revenue of Innox by Customer, 2012
如果这份报告不能满足您的要求,我们还可以为您定制报告,请 留言说明您的详细需求。
|