|
|
|
报告导航:研究报告—
生命科学—生物科技
|
|
2012-2014年中国诊断试剂行业研究报告 |
 |
字数:3.3万 |
页数:85 |
图表数:110 |
|
中文电子版:7500元 |
中文纸版:3750元 |
中文(电子+纸)版:8000元 |
|
|
|
|
|
编号:XJT025
|
发布日期:2012-12 |
附件:下载 |
 |
|
|
目前,中国诊断试剂行业已具备一定的市场规模和基础,正从产业导入期步入成长期。随着中国医疗保障水平投入、人均医疗支出的持续增长,中国诊断试剂市场发展前景良好。
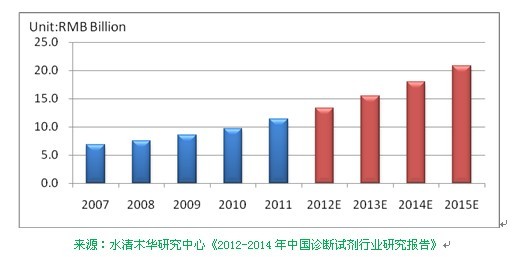
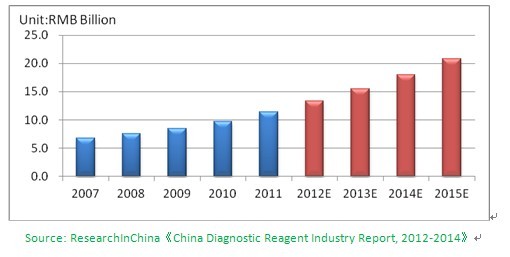
中国诊断试剂行业中,体外诊断试剂产量占比达90.0%以上。2011年,中国体外诊断试剂市场规模约为114.0亿元,预计行业未来将保持15%-20%的增速,2015年市场规模将达到208.0亿元。
图:2007-2015年中国体外诊断试剂行业市场规模
目前,中国诊断试剂市场具有较强实力的综合性体外诊断试剂企业仅有科华生物、复星医药等少数几家企业;而其他如达安基因、中生北控、利德曼、丽珠集团等企业则在生化诊断、免疫诊断、分子诊断等某一领域具备竞争优势。同时,中国体外诊断试剂行业集中度较低,300-400家企业中年销售收入过亿元的企业仅约20家,企业普遍规模小、品种少。2011年,科华生物、达安基因、中生北控、利德曼市场占有率分别仅为3.8%、2.3%、1.9%、1.6%。
作为高新技术行业,中国诊断试剂行业利润水平整体较高。2011年,中国诊断试剂主要企业中,科华生物、达安基因、中生北控、金豪制药、丽珠集团、利德曼综合毛利率均超过50%;复星医药诊断试剂及器械业务占营业收入比重较低,其毛利率达到40.4%。随着行业集中度的提升,预计技术创新能力强、生产规模大的优势企业将获得更高的市场份额及更高的利润水平。
《2012-2014年中国诊断试剂行业研究报告》的内容主要包括以下几方面:
中国诊断试剂行业市场规模、市场结构、进出口情况、竞争格局、利润水平、进入壁垒等;
中国诊断试剂行业监管体制及政策、行业政策等;诊断试剂行业产业链、上下游行业影响等;
中国诊断试剂行业发展预测分析,包括市场规模预测、主要品种市场预测、行业竞争情况预测预计企业发展趋势预测等;
中国15家诊断试剂企业的生产经营情况、投资并购、诊断试剂业务及发展前景等。
China’s diagnostic reagent industry has formed a certain market scale and basis, and is marching from the introduction stage to the growth stage. With the continuous growth in China’s medical care investment and per capita health care spending, the China’s diagnostic reagent market has a promising prospect.
In vitro diagnostic reagents account for more than 90.0% of the output of China’s diagnostic reagent industry. In 2011, the market scale of in vitro diagnostic reagents reached about RMB 11.4 billion in China, the industry will maintain a growth rate of 15%-20% in the future, and the market scale will hit RMB 20.8 billion in 2015.
Market Scale of In Vitro Diagnostic Reagent in China, 2007-2015
At present, there are only a few integrated in vitro diagnostic reagent enterprises with strong strength in China’s diagnostic reagent market, including KHB and Fosun Pharma; other enterprises such as Da An Gene, BioSino, Leadman and Livzon have competitive advantages in specific fields such as biochemical diagnosis, immunodiagnosis, and molecular diagnosis. Meanwhile, China’s in vitro diagnostic reagent industry concentration is low. Among 300-400 enterprises, there are only about 20 enterprises with annual sales of more than RMB 100 million. The enterprises are generally small and have a few product varieties. In 2011, KHB, Da An Gene, BioSino, Leadman only occupied 3.8%, 2.3%, 1.9%, 1.6% of the market respectively.
As a high-tech industry, the profitability of the overall Chinese diagnostic reagent industry is high. In 2011, among major Chinese diagnostic reagent enterprises, KHB, Da An Gene, BioSino, Kinghawk, Livzon, Leadman all achieved a gross margin of more than 50%; Fosun Pharma reached a gross margin of 40.4%, since diagnostic reagent and instrument business accounts for a lower proportion of its revenue. With the improvement of industry concentration, it’s expected that the advantageous enterprises with strong capability of technological innovation and large production scale will obtain higher market share and profitability.
China Diagnostic Reagent Industry Report, 2012-2014 mainly includes the following contents:
Market scale, market structure, import and export, competitive landscape, profitability, entry barriers of China’s diagnostic reagent industry;
Regulatory system and policy, industry policy, industrial chain, upstream and downstream of China’s diagnostic reagent industry;
Development forecast of China’s diagnostic reagent industry, including the forecast of market scale, major market segments, industry competition, and enterprise development trends;
Production, operation, investment, M&A, diagnostic reagent business and development prospect of 15 Chinese diagnostic reagent enterprises.
第一章 诊断试剂行业概述
1.1 定义
1.2 分类
第二章 中国诊断试剂行业现状
2.1 总体概况
2.2 市场结构
2.3 进出口
2.3.1 进口情况
2.3.2 出口情况
2.4 竞争格局
2.4.1 生化诊断试剂
2.4.2 免疫诊断试剂
2.4.3 分子诊断试剂
2.4.4 综合性体外诊断试剂
2.5 利润水平
2.6 进入壁垒
2.6.1 技术壁垒
2.6.2 质量及品牌壁垒
2.6.3 营销渠道壁垒
2.6.4 市场准入壁垒
第三章 中国诊断试剂行业发展环境
3.1 政策环境
3.1.1 监管政策
3.1.2 行业政策
3.2 上下游行业
3.2.1 产业链构成
3.2.2 上游行业
3.2.3 下游行业
第四章 中国诊断试剂行业发展预测
4.1 总体预测分析
4.1.1 市场需求驱动因素
4.1.2 市场规模预测
4.2 诊断试剂行业发展趋势
4.2.1 生化免疫诊断仍将占据主流
4.2.2 行业集中度将有所提高
4.2.3 产品线全面、试剂仪器一体化企业将胜出
第五章 中国诊断试剂主要企业
5.1 科华生物
5.1.1 企业简介
5.1.2 经营情况
5.1.3 营收构成分析
5.1.4 毛利率分析
5.1.5 研发和投资分析
5.1.6 客户分析
5.1.7 诊断试剂业务分析
5.1.8 预测与展望
5.2 达安基因
5.2.1 企业简介
5.2.2 经营情况
5.2.3 营收构成分析
5.2.4 毛利率分析
5.2.5 研发和投资分析
5.2.6 诊断试剂业务分析
5.2.7 预测与展望
5.3 复星医药
5.3.1 企业简介
5.3.2 经营情况
5.3.3 营收构成分析
5.3.4 毛利率分析
5.3.5 研发和投资分析
5.3.6 诊断试剂业务分析
5.3.7 预测与展望
5.4 中生北控
5.4.1 企业简介
5.4.2 经营情况
5.4.3 营收构成分析
5.4.4 研发和投资分析
5.4.5 预测与展望
5.5 金豪制药
5.5.1 企业简介
5.5.2 经营情况
5.5.3 营收构成分析
5.5.4 毛利率分析
5.5.5 诊断试剂业务分析
5.5.6 预测与展望
5.6 丽珠集团
5.6.1 企业简介
5.6.2 经营情况
5.6.3 营收构成分析
5.6.4 毛利率分析
5.6.5 诊断试剂业务分析
5.6.6 预测与展望
5.7 利德曼
5.7.1 企业简介
5.7.2 经营情况
5.7.3 营收构成分析
5.7.4 毛利率分析
5.7.5 研发和投资分析
5.7.6 客户分析
5.7.6 诊断试剂业务分析
5.7.7 预测与展望
5.8 艾康生物
5.8.1 企业简介
5.8.2 经营情况
5.8.3 发展情况
5.9 万泰生物
5.9.1 企业简介
5.9.2 经营情况
5.9.3 发展情况
5.10 荣盛生物
5.10.1 企业简介
5.10.2 经营情况
5.10.3 发展情况
5.11 匹基生物
5.11.1 企业简介
5.11.2 经营情况
5.12 奥普生物
5.12.1 企业简介
5.12.2 经营情况
5.12.3 发展情况
5.13 上海英伯肯
5.13.1 企业简介
5.13.2 经营情况
5.14 蓝十字生物
5.14.1 企业简介
5.14.2 经营情况
5.14.3 发展情况
5.15 北方生物
5.15.1 企业简介
5.15.2 经营情况
5.15.3 发展情况
1. Overview of Diagnostic Reagent Industry
1.1 Definition
1.2 Classification
2. China Diagnostic Reagent Industry
2.1 Overview
2.2 Market Structure
2.3 Import and Export
2.3.1 Import
2.3.2 Export
2.4 Competitive Landscape
2.4.1 Biochemical Diagnostic Reagents
2.4.2 Immune Diagnostic Reagents
2.4.3 Molecular Diagnostic Reagents
2.4.4 Integrated In Vitro Diagnostic Reagents
2.5 Profitability
2.6 Entry Barriers
2.6.1 Technical Barriers
2.6.2 Quality and Brand Barriers
2.6.3 Marketing Channel Barriers
2.6.4 Market Access Barriers
3. Development Environment of China Diagnostic Reagent Industry
3.1 Policy Environment
3.1.1 Regulatory Policy
3.1.2 Industry Policy
3.2 Upstream and Downstream Industries
3.2.1 Industrial Chain
3.2.2 Upstream
3.2.3 Downstream
4. Development Forecast of China Diagnostic Reagent Industry
4.1 Overall Forecast
4.1.1 Market Demand Drivers
4.1.2 Market Scale Forecast
4.2 Development Trends of Diagnostic Reagent Industry
4.2.1 Biochemical Diagnosis and Immunodiagnosis Will Still Be the Mainstream
4.2.2 Industry Concentration Will Increase
4.2.3 Enterprises with Complete Product Line Integrating Reagents and Instruments will Win
5. Major Chinese Diagnostic Reagent Enterprises
5.1 Shanghai Kehua Bio-engineering Co., Ltd. (KHB)
5.1.1 Profile
5.1.2 Operation
5.1.3 Revenue Structure
5.1.4 Gross Margin
5.1.5 R & D and Investment
5.1.6 Customers
5.1.7 Diagnostic Reagent Business
5.1.8 Forecast and Prospect
5.2 Da An Gene Co., Ltd.
5.2.1 Profile
5.2.2 Operation
5.2.3 Revenue Structure
5.2.4 Gross Margin
5.2.5 R & D and Investment
5.2.6 Diagnostic Reagent Business
5.2.7 Forecast and Prospect
5.3 Shanghai Fosun Pharmaceutical (Group) Co., Ltd.
5.3.1 Profile
5.3.2 Operation
5.3.3 Revenue Structure
5.3.4 Gross Margin
5.3.5 R & D and Investment
5.3.6 Diagnostic Reagent Business
5.3.7 Forecast and Prospect
5.4 BioSino Bio-technology and Science Inc.
5.4.1 Profile
5.4.2 Operation
5.4.3 Revenue Structure
5.4.4 R & D and Investment
5.4.5 Forecast and Prospect
5.5 Beijing Kinghawk Pharmaceutical Co., Ltd.
5.5.1 Profile
5.5.2 Operation
5.5.3 Revenue Structure
5.5.4 Gross Margin
5.5.5 Diagnostic Reagent Business
5.5.6 Forecast and Prospect
5.6 Livzon Pharmaceutical Group Inc.
5.6.1 Profile
5.6.2 Operation
5.6.3 Revenue Structure
5.6.4 Gross Margin
5.6.5 Diagnostic Reagent Business
5.6.6 Forecast and Prospect
5.7 Beijing Leadman Biochemistry Co., Ltd.
5.7.1 Profile
5.7.2 Operation
5.7.3 Revenue Structure
5.7.4 Gross Margin
5.7.5 R & D and Investment
5.7.6 Customers
5.7.7 Diagnostic Reagent Business
5.7.8 Forecast and Prospect
5.8 Acon Biotech (Hangzhou) Co., Ltd.
5.8.1 Profile
5.8.2 Operation
5.8.3 Development
5.9 Beijing Wantai Biological Pharmacy Enterprise Co., Ltd.
5.9.1 Profile
5.9.2 Operation
5.9.3 Development
5.10 Shanghai Rongsheng Biotech Co., Ltd. (Rsbio)
5.10.1 Profile
5.10.2 Operation
5.10.3 Development
5.11 Shenzhen PG Biotech Co., Ltd.
5.11.1 Profile
5.11.2 Operation
5.12 Shanghai Upper Bio-Tech Pharma Co., Ltd.
5.12.1 Profile
5.12.2 Operation
5.12.3 Development
5.13 Inverness Medical (Shanghai) Co., Ltd.
5.13.1 Profile
5.13.2 Operation
5.14 Blue Cross Bio-Medical (Beijing) Co., Ltd.
5.14.1 Profile
5.14.2 Operation
5.14.3 Development
5.15 Beijing North Institute of Biological Technology (BNIBT)
5.15.1 Profile
5.15.2 Operation
5.15.3 Development
表:体外诊断试剂主要类别(按检测原理或检测方法)
表:体外诊断试剂类别及产品(按国家政策分)
图:2005-2012年中国生物制品行业营业收入
图:2007-2011年中国体外诊断试剂行业市场规模
图:2011年中国体外诊断试剂行业市场结构
图:2007-2012年中国诊断试剂进口量
图:2007-2012年中国诊断试剂进口金额
图:2007-2012年中国诊断试剂进口价格
表:2011年中国诊断试剂主要进口国家或地区进口量、进口额及进口单价
图:2007-2012年中国诊断试剂出口量
图:2007-2012年中国诊断试剂出口额
图:2007-2012年中国诊断试剂出口均价
表:2011年中国诊断试剂出口前十国家出口量、出口额及出口单价
表:中国诊断试剂行业竞争格局
图:2011年中国主要企业诊断试剂业务营业收入
图:2011年中国诊断试剂行业主要企业市场份额
表:2008-2012年中国诊断试剂主要企业综合毛利率
表:2001-2012年中国诊断试剂行业主要监管政策
表:2005-2012年中国诊断试剂行业主要政策
图:诊断试剂行业产业链
图:1980-2011年中国医院数量
图:2011年中国各类医院数量(按等级)
图:1980-2011年中国医疗卫生总费用
图:1985-2010年中国医疗卫生总费用占GDP比例
图:1980-2010年中国居民个人卫生支出总额
图:1990-2010年中国城镇与农村居民人均医疗保健支出
图:1990-2010年中国城镇与农村居民人均医疗保健支出占消费性支出比例
图:2005-2011年中国医院诊疗数
图:2005-2011年中国医院入院人数
图:1982-2010年中国65岁人口数及占总人口比例
图:中国各年龄段人口两周患病率
表:2007-2015年中国体外诊断试剂行业市场规模
图:2011年成熟市场诊断试剂产品结构
图:2008-2012年中国体外诊断试剂主要品种市场规模
表:全球主要诊断试剂企业产品及营业收入
表:罗氏诊断发展历程
表:全球领先诊断试剂公司一体化发展战略
图:2008-2012年科华生物营业收入及净利润
表:2008-2012年科华生物(分产品)营业收入
图:2010-2012年科华生物(分地区)营业收入
表:2008-2012年科华生物毛利率(分产品)
图:2008-2012年科华生物研发支出及占营业收入比例
图:2008-2012年科华生物前五名客户销售金额及占比
表:2011年科华生物前五名客户名称、贡献收入及收入占比
表:1989-2012年科华生物主要产品及上市时间
表:2011年科华生物主要业务及主要产品
表:2012年科华生物医疗仪器类型及产品
图:2005-2011年科华生物诊断试剂营业收入增速与全国诊疗人数增速
表:2011-2014年科华生物营业收入和净利润
图:2008-2012年达安基因营业收入及净利润
表:2008-2012年达安基因(分产品)营业收入
图:2008-2012年达安基因(分地区)营业收入
表:2008-2012年达安基因毛利率(分产品)
图:2008-2012年达安基因研发支出及占营业收入比例
表:2007-2012年达安基因新产品批件类别及数量
表:达安基因旗下主要资产及业务
图:达安基因产业链布局
表:2011-2014年达安基因营业收入和净利润
图:2008-2012年复星医药营业收入及净利润
图:2008-2012年复星医药(分产品)营业收入
图:2008-2012年复星医药(分地区)营业收入
表:2008-2011年复星医药毛利率(分产品)
图:2008-2012年复星医药研发支出及占营业收入比例
表:2011-2014年复星医药营业收入和净利润
图:2008-2012年中生北控营业收入及年度溢利
图:2008-2012年中生北控(分产品)营业收入
图:2008-2012年中生北控研发支出及占营业收入比例
表:2011-2014年中生北控营业收入和年度溢利
图:2008-2012年金豪制药营业收入及净利润
图:2010-2012年金豪制药(分产品)营业收入
表:2010-2011年金豪制药毛利率(分产品)
表:2011-2014年金豪制药营业收入和净利润
图:2008-2012年丽珠集团营业收入及净利润
表:2008-2012年丽珠集团(分产品)营业收入
表:2008-2012年丽珠集团(分地区)营业收入
表:2008-2011年丽珠集团毛利率(分产品)
表:丽珠集团诊断试剂业务主要产品
表:2011-2014年丽珠集团营业收入和净利润
图:2008-2012年利德曼营业收入及净利润
表:2008-2012年利德曼(分产品)营业收入
表:2008-2011年利德曼毛利率(分产品)
图:2008-2012年利德曼研发支出及占营业收入比例
图:2008-2012年利德曼前五名客户销售金额及占比
表:2011年利德曼前五名客户名称、贡献收入及收入占比
表:2008-2011年利德曼经销商数量
表:2011-2014年利德曼营业收入和净利润
图:2007-2009年艾康生物营业收入及利润总额
图:2007-2009年艾康生物毛利率
图:2007-2009年艾康生物资产总额及负债总额
图:2007-2009年万泰生物营业收入及利润总额
图:2007-2009年万泰生物毛利率
图:2007-2009年万泰生物资产总额及负债总额
图:2007-2009年荣盛生物营业收入及利润总额
图:2007-2009年荣盛生物毛利率
图:2007-2009年荣盛生物资产总额及负债总额
图:2007-2008年匹基生物营业收入及利润总额
图:2007-2008年匹基生物毛利率
图:2007-2008年匹基生物资产总额及负债总额
图:2008-2009年奥普生物营业收入及利润总额
图:2008-2009年奥普生物毛利率
图:2008-2009年奥普生物资产总额及负债总额
图:2007-2009年上海英伯肯营业收入及利润总额
图:2007-2009年上海英伯肯毛利率
图:2007-2009年上海英伯肯资产总额及负债总额
图:2007-2009年蓝十字生物营业收入及利润总额
图:2007-2009年蓝十字生物毛利率
图:2007-2009年蓝十字生物资产总额及负债总额
图:2007-2009年北方生物营业收入及利润总额
图:2007-2009年北方生物毛利率
图:2007-2009年北方生物资产总额及负债总额
Classification of In Vitro Diagnostic Reagents by Test Principle/Method
In Vitro Diagnostic Reagent Categories and Products by National Policy
Revenue of China’s Biological Product Industry, 2005-2012
Market Scale of China’s In Vitro Diagnostic Reagent Industry, 2007-2011
Market Structure of China’s In Vitro Diagnostic Reagent Industry, 2011
China’s Import Volume of Diagnostic Reagent, 2007-2012
China’s Import Value of Diagnostic Reagent, 2007-2012
China’s Import Price of Diagnostic Reagent, 2007-2012
China’s Import Volume, Import Value and Unit Import Price of Diagnostic Reagent by Country/Region, 2011
China’s Export Volume of Diagnostic Reagent, 2007-2012
China’s Export Value of Diagnostic Reagent, 2007-2012
China’s Average Export Price of Diagnostic Reagent, 2007-2012
China’s Export Volume, Export Value and Unit Export Price of Diagnostic Reagent, 2011
Competitive Landscape of China’s Diagnostic Reagent Industry
Diagnostic Reagent Business Revenue of Major Enterprises in China, 2011
Market Share of Major Enterprises in China’s Diagnostic Reagent Industry, 2011
Consolidated Gross Margin of Major Enterprises in China’s Diagnostic Reagent Industry, 2008-2012
Major Regulatory Policies in China’s Diagnostic Reagent Industry, 2001-2012
Main Policies in China’s Diagnostic Reagent Industry, 2005-2012
Diagnostic Reagent Industry Chain
China’s Hospital Quantity, 1980-2011
China’s Hospital Quantity by Grade, 2011
China’s Medical and Health Expenses, 1980-2011
China’s Medical and Health Expenses as a Percentage of GDP, 1985-2010
Total Personal Health Expenditure of Residents in China, 1980-2010
Per Capita Health Care Spending of China’s Urban and Rural Residents, 1990-2010
Per Capita Health Care Spending of China’s Urban and Rural Residents as a Percentage of Consumer Expenditure, 1990-2010
China’s Hospital Diagnosis and Treatment Quantity, 2005-2011
China’s Hospital Admissions, 2005-2011
China’s Population Aged above 65 and % of Total Population, 1982-2010
China’s Bi-weekly Incidence of Disease by Age
Market Scale of China’s In Vitro Diagnostic Reagent Industry, 2007-2015
Diagnostic Reagent Product Structure of Mature Market, 2011
Market Scale of Major In Vitro Diagnostic Reagent Varieties in China, 2008-2012
Products and Revenue of Global Major Diagnostic Reagent Manufacturers
Development Course of Roche Diagnostics
Integrated Development Strategy of Global Leading Diagnostic Reagent Company
Revenue and Net Income of KHB, 2008-2012
Revenue of KHB by Product, 2008-2012
Revenue of KHB by Region, 2010-2012
Gross Margin of KHB by Product, 2008-2012
R&D Expenditure and % of Revenue of KHB, 2008-2012
Sales of KHB from Top 5 Customers, 2008-2012
Name List, Revenue Contribution and % of KHB’s Top 5 Customers, 2011
Main Products and Time to Market of KHB, 1989-2012
Main Businesses and Products of KHB, 2011
Medical Equipment Types and Products of KHB, 2012
Growth Rates of KHB’s Diagnostic Reagent Revenue and National Diagnosis and Treatment Quantity, 2005-2011
Revenue and Net Income of KHB, 2011-2014
Revenue and Net Income of Da An Gene, 2008-2012
Revenue of Da An Gene by Product, 2008-2012
Revenue of Da An Gene by Region, 2008-2012
Gross Margin of Da An Gene by Product, 2008-2012
R&D Expenditure and % of Revenue of Da An Gene, 2008-2012
New Product Approval Document Type and Quantity of Da An Gene, 2007-2012
Main Assets and Businesses of Da An Gene
Industrial Chain of Da An Gene
Revenue and Net Income of Da An Gene, 2011-2014
Revenue and Net Income of Fosun Pharma, 2008-2012
Revenue of Fosun Pharma by Product, 2008-2012
Revenue of Fosun Pharma by Region, 2008-2012
Gross Margin of Fosun Pharma by Product, 2008-2011
R&D Expenditure and % of Revenue of Fosun Pharma, 2008-2012
Revenue and Net Income of Fosun Pharma, 2011-2014
Revenue and Profit of BioSino, 2008-2012
Revenue of BioSino by Product, 2008-2012
R&D Expenditure and % of Revenue of BioSino, 2008-2012
Revenue and Profit of BioSino, 2011-2014
Revenue and Net Income of Kinghawk, 2008-2012
Revenue of Kinghawk by Product, 2010-2012
Gross Margin of Kinghawk by Product, 2010-2011
Revenue and Net Income of Kinghawk, 2011-2014
Revenue and Net Income of Livzon, 2008-2012
Revenue of Livzon by Product, 2008-2012
Revenue of Livzon by Region, 2008-2012
Gross Margin of Livzon by Product, 2008-2011
Main Diagnostic Reagent Products of Livzon
Revenue and Net Income of Livzon, 2011-2014
Revenue and Net Income of Leadman, 2008-2012
Revenue of Leadman by Product, 2008-2012
Gross Margin of Leadman by Product, 2008-2011
R&D Expenditure and % of Revenue of Leadman, 2008-2012
Sales of Leadman from Top 5 Customers, 2008-2012
Name List, Revenue Contribution and % of Leadman’s Top 5 Customers, 2011
Dealers of Leadman, 2008-2011
Revenue and Net Income of Leadman, 2011-2014
Revenue and Total Profit of Acon, 2007-2009
Gross Margin of Acon, 2007-2009
Total Assets and Liabilities of Acon, 2007-2009
Revenue and Total Profit of Wantai, 2007-2009
Gross Margin of Wantai, 2007-2009
Total Assets and Liabilities of Wantai, 2007-2009
Revenue and Total Profit of Rsbio, 2007-2009
Gross Margin of Rsbio, 2007-2009
Total Assets and Liabilities of Rsbio, 2007-2009
Revenue and Total Profit of PG Biotech, 2007-2008
Gross Margin of PG Biotech, 2007-2008
Total Assets and Liabilities of PG Biotech, 2007-2008
Revenue and Total Profit of Upper Bio-Tech, 2008-2009
Gross Margin of Upper Bio-Tech, 2008-2009
Total Assets and Liabilities of Upper Bio-Tech, 2008-2009
Revenue and Total Profit of Inverness Medical (Shanghai), 2007-2009
Gross Margin of Inverness Medical (Shanghai), 2007-2009
Total Assets and Liabilities of Inverness Medical (Shanghai), 2007-2009
Revenue and Total Profit of Blue Cross, 2007-2009
Gross Margin of Blue Cross, 2007-2009
Total Assets and Liabilities of Blue Cross, 2007-2009
Revenue and Total Profit of BNIBT, 2007-2009
Gross Margin of BNIBT, 2007-2009
Total Assets and Liabilities of BNIBT, 2007-2009
如果这份报告不能满足您的要求,我们还可以为您定制报告,请 留言说明您的详细需求。
|