|
|
|
报告导航:研究报告—
制造业—材料
|
|
2012-2015年中国塑料管材行业研究报告 |
 |
字数:3.3万 |
页数:85 |
图表数:141 |
|
中文电子版:8000元 |
中文纸版:4000元 |
中文(电子+纸)版:8500元 |
|
英文电子版:1900美元 |
英文纸版:2000美元 |
英文(电子+纸)版:2200美元 |
|
编号:CYH009
|
发布日期:2013-03 |
附件:下载 |
 |
|
|
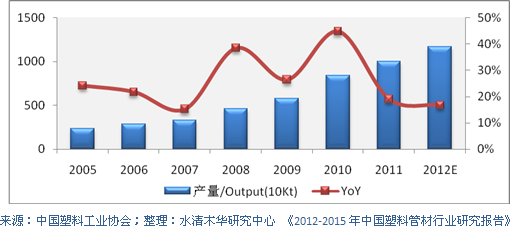
中国是全球塑料管材生产和消费最大的国家。2011年,中国塑料管材产量达1000万吨,同比增长19.0%;2012年中国塑料管材产量约1167万吨。 图:2005-2012年中国塑料管材产量及同比增长
目前中国塑料管仍以PVC管材为主,其产量占中国塑料管材产量的55%左右。但随着环境污染问题的日益严重以及政策的扶持,中国PE管材、PP管材的市场份额将快速增长。 中国塑料管材生产经营企业数量有3000多家,但产能达万吨级别的企业不多。2012年,中国联塑、沧州明珠、纳川股份、顾地科技等上市企业年生产能力处于行业领先地位。其中,中国联塑以产能175万吨/年的规模成为中国最大的塑料管材企业之一。在城镇化进程加速等利好因素的刺激下,中国各大塑料管材企业正积极融资扩产。 沧州明珠是国内PE燃气、给水管材龙头。截至2012年底,公司PE管材产能达到6.2万吨,其中4.7万吨产能分布于沧州本部,1.5 万吨分布于芜湖明珠子公司。2011年公司通过非公开增发的方式募集资金1.52亿元建设1.98万吨PE管材管件项目,预计2013年投产。 纳川股份是中国HDPE缠绕增强管及配套管件核心企业之一。2011年公司上市募集资金新增HDPE缠绕增强管生产线六条(新增产能1.44万吨),并于2013年初全部投产;至此,公司在泉州本部、天津和武汉三个生产基地共拥有HDPE缠绕增强管生产线11条,合计产能2.55万吨/年。此外,公司正计划新建2个生产基地(每个基地对应2条2400吨产能生产线),预计2014年底投产。 顾地科技是中国塑料管材主要生产企业之一,共有八个生产基地,产品涵盖PVC、PE和PP三大系列。2012年8月,顾地科技公司上市募集资金用于新建湖北顾地年产4.3万吨塑料管道项目(已于2012年底投产)和重庆顾地年产2.65万吨塑料管道项目。其中,重庆项目预计于2013年下半年竣工投产,届时公司塑料管总年产能可达23.2万吨。 水清木华研究中心《2012-2015年中国塑料管材行业研究报告》主要包括以下几个内容:- 中国塑料管材行业供需分析、进出口、产品结构、地区结构、竞争格局、价格及发展趋势等;
- 中国塑料管材行业细分市场供需分析、进出口、竞争格局、发展趋势等;
- 中国塑料管材行业下游产业发展状况、发展趋势等;
- 中国9家塑料管材生产企业的运营状况、塑料管材业务分析及发展前景等。
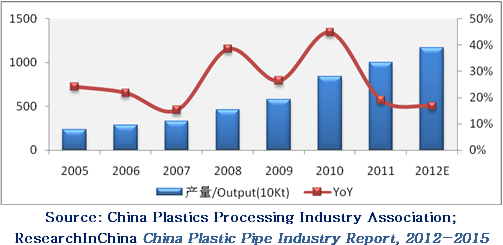
As the world’s largest producer and consumer of plastic pipe, China’s
output of plastic pipe reached 10 million tons in 2011 (a year-on-year
increase of 19.0%), and about 11.67 million tons in 2012. Output and YoY Growth Rate of Plastic Pipes in China, 2005-2012
In today’s China plastic pipe industry, PVC pipe still holds a dominant
position, with output accounting for approximately 55% of the total.
However, with the increasingly serious environmental pollution as well
as support policies, China’s PE and PP pipe market share will usher in
fast growth. There are more than 3,000 enterprises engaged in
the production and operation of plastic pipes in China, but only a few
with capacity up to the 10,000-ton level. In 2012, China Liansu Group
Holdings Limited, Cangzhou Mingzhu Plastic Co., Ltd., Fujian Newchoice
Pipe Technology Co., Ltd., Goody Technology Co.,Ltd and other listed
companies occupied leading positions in annual production capacity, of
which, China Liansu, by virtue of the 1.75 million tons/a scale, became
one of the country’s largest plastic pipe enterprises. Stimulated by the
accelerated process of urbanization and other favorable factors, major
domestic playersare actively seeking financing for expansion.
As a leader in domestic PE gas and water supply pipe industry, Cangzhou
Mingzhu Plastic realized PE pipe capacity of 62,000 tons as of the end
of 2012, of which, 47,000 tons was located in the Cangzhou headquarter,
15,000 tons in the Wuhu subsidiary. In 2011, it raised funds of RMB152
million by means of non-public issuance for the construction of the
19,800-ton PE Pipe & Fittings Project expected to be put into
production in 2013. Fujian Newchoice Pipe Technology is one of
China’s core enterprises of HDPE winding intensifier tubes and
auxiliary fittings. In 2011, it added six new HDPE winding intensifier
tube production lines (new capacity of 14,400 tons) with IPO funds, all
of which are to be put into production in early 2013. So far, the
company has possessed 11 HDPE winding intensifier tube production lines
in three production bases in Quanzhou (headquarter), Tianjin and Wuhan,
with aggregate productivity of 25,500 tons/a. In addition, it plans to
build two new production bases (each with two 2,400-ton production lines
) which are expected to go into operation by the end of 2014.
Being one of influential manufacturers of plastic pipes in China, Goody
Technology has a total of eight production bases, with products
covering PVC, PE and PP series. In August 2012, the company’s Hubei
Goody 43,000 tons/a Plastic Pipeline Project (already put into
production at end-2012) and Chongqing Goody 26,500 tons/a Plastic
Pipeline Project with IPO funds began construction, of which, the former
is expected to be completed and commissioned in the second half of
2013, when the company’s plastic pipe business might realize a total
annual capacity of 232,000 tons.
China Plastic Pipe Industry Report, 2012-2015 of ResearchInChina mainly covers the followings:  Supply
& demand, imports & exports, product structure, regional
structure, competition pattern, price, development trend, etc. of
Chinese plastic pipe industry; Supply
& demand, imports & exports, competition pattern, development
trend, etc. of Chinese plastic pipe industry market segments; Development status, development tendency, etc. of China’s downstream plastic pipe industry; Operation, plastic pipe business, development prospects, etc. of nine Chinese plastic pipe manufacturers.
第一章 塑料管材行业概述
1.1 定义
1.2 分类
第二章 中国塑料管材市场发展
2.1 全球塑料管材市场发展
2.2 中国塑料管材市场供给
2.3 中国塑料管材市场需求
2.4 中国塑料管材出口
2.5 中国塑料管材进口
2.6 产品结构
2.7 地区结构
2.8 竞争格局
2.9 价格
2.10 发展趋势
第三章 中国塑料管材细分市场发展
3.1 PVC管
3.1.1 市场供给
3.1.2 进口
3.1.3 出口
3.1.4 发展趋势
3.2 PE管
3.2.1 市场供需
3.2.2 进口
3.2.3 出口
3.2.4 发展趋势
3.3 PP管
3.3.1 市场供需
3.3.2 进口
3.3.3 出口
3.3.4 竞争格局
第四章 中国塑料管材下游行业发展
4.1 市政供水管材
4.1.1 发展现状
4.1.2 发展趋势
4.2 市政排水管材
4.3 市政燃气管材
4.4 其他
第五章 中国塑料管材重点生产企业
5.1 沧州明珠
5.1.1 企业简介
5.1.2 经营情况
5.1.3 营收构成
5.1.4 毛利率
5.1.5 客户与供应商
5.1.6 研发与投资
5.1.7 塑料管材业务
5.1.8 发展前景
5.2 伟星新材
5.2.1 企业简介
5.2.2 经营情况
5.2.3 营收构成
5.2.4 毛利率
5.2.5 客户与供应商
5.2.6 研发与投资
5.2.7 发展前景
5.3 纳川股份
5.3.1 企业简介
5.3.2 经营情况
5.3.3 营收构成
5.3.4 毛利率
5.3.5 客户与供应商
5.3.6 研发与投资
5.3.7 发展前景
5.4 青龙管业
5.4.1 企业简介
5.4.2 经营情况
5.4.3 营收构成
5.4.4 毛利率
5.4.5 客户与供应商
5.4.6 研发与投资
5.4.7 塑料管材业务
5.4.8 发展前景
5.5 国统股份
5.5.1 企业简介
5.5.2 经营情况
5.5.3 营收构成
5.5.4 毛利率
5.5.5 客户与供应商
5.5.6 研发
5.5.7 发展前景
5.6 永高股份
5.6.1 企业简介
5.6.2 经营情况
5.6.3 营收构成
5.6.4 毛利率
5.6.5 客户与供应商
5.6.6 研发与投资
5.6.7 发展前景
5.7 顾地科技
5.7.1 企业简介
5.7.2 经营情况
5.7.3 营收构成
5.7.4 毛利率
5.7.5 客户与供应商
5.7.6 研发与投资
5.7.7 产销量
5.7.8 发展前景
5.8 中国联塑
5.8.1 企业简介
5.8.2 经营情况
5.8.3 营收构成
5.8.4 塑料管材业务
5.8.5 发展前景
5.9 国通管业
5.9.1 企业简介
5.9.2 经营情况
5.9.3 营收构成
5.9.4 毛利率
5.9.5 客户
5.9.6 发展前景
1. Overview of Plastic Pipe Industry
1.1 Definition
1.2 Classification
2. China Plastic Pipe Market Development
2.1 Global Plastic Pipe Market Development
2.2 China Plastic Pipe Market Supply
2.3 China Plastic Pipe Market Demand
2.4 China Plastic Pipe Exports
2.5 China Plastic Pipe Imports
2.6 Product Structure
2.7 Regional Structure
2.8 Competition Pattern
2.9 Price
2.10 Development Trend
3. China Plastic Pipe Market Segments
3.1 PVC Pipe
3.1.1 Market Supply
3.1.2 Imports
3.1.3 Exports
3.1.4 Development Trend
3.2 PE Pipe
3.2.1 Market Supply and Demand
3.2.2 Imports
3.2.3 Exports
3.2.4 Development Trend
3.3 PP Pipe
3.3.1 Market Supply and Demand
3.3.2 Imports
3.3.3 Exports
3.3.4 Competition Pattern
4. China Downstream Plastic Pipe Industry
4.1 Municipal Water Supply Pipe
4.1.1 Development Status
4.1.2 Development Trend
4.2 Municipal Drainage Pipe
4.3 Municipal Gas Pipe
4.4 Others
5. Key Enterprises
5.1 Cangzhou Mingzhu Plastic Co., Ltd.
5.1.1 Profile
5.1.2 Operation
5.1.3 Revenue Structure
5.1.4 Gross Margin
5.1.5 Clients & Suppliers
5.1.6 R&D and Investment
5.1.7 Plastic Pipe Business
5.1.8 Development Prospect
5.2 Zhejiang Weixing New Building Materials Co., Ltd
5.2.1 Profile
5.2.2 Operation
5.2.3 Revenue Structure
5.2.4 Gross Margin
5.2.5 Clients & Suppliers
5.2.6 R&D and Investment
5.2.7 Development Prospect
5.3 Fujian Newchoice Pipe Technology Co., Ltd.
5.3.1 Profile
5.3.2 Operation
5.3.3 Revenue Structure
5.3.4 Gross Margin
5.3.5 Clients & Suppliers
5.3.6 R&D and Investment
5.3.7 Development Prospect
5.4 Ningxia Qinglong Pipes Industry Co.,Ltd.
5.4.1 Profile
5.4.2 Operation
5.4.3 Revenue Structure
5.4.4 Gross Margin
5.4.5 Clients & Suppliers
5.4.6 R&D and Investment
5.4.7 Plastic Pipe Business
5.4.8 Development Prospect
5.5 Xinjiang Guotong Pipeline Co., Ltd.
5.5.1 Profile
5.5.2 Operation
5.5.3 Revenue Structure
5.5.4 Gross Margin
5.5.5 Clients & Suppliers
5.5.6 R&D
5.5.7 Development Prospect
5.6 Yonggao Co., Ltd.
5.6.1 Profile
5.6.2 Operation
5.6.3 Revenue Structure
5.6.4 Gross Margin
5.6.5 Clients & Suppliers
5.6.6 R&D and Investment
5.6.7 Development Prospect
5.7 Goody Technology Co.,Ltd
5.7.1 Profile
5.7.2 Operation
5.7.3 Revenue Structure
5.7.4 Gross Margin
5.7.5 Clients & Suppliers
5.7.6 R&D and Investment
5.7.7 Output and Sales Volume
5.7.8 Development Prospect
5.8 China Liansu Group Holdings Limited
5.8.1 Profile
5.8.2 Operation
5.8.3 Revenue Structure
5.8.4 Plastic Pipe Business
5.8.5 Development Prospect
5.9 Anhui Guotong Hi-Tech Pipes Industry Co., Ltd
5.9.1 Profile
5.9.2 Operation
5.9.3 Revenue Structure
5.9.4 Gross Margin
5.9.5 Clients
5.9.6 Development Prospect
表:塑料管材(分材质)分类及用途
图:2009年全球塑料管材(分地区)市场需求占比
表:全球塑料管材(分部分国家/年份)产量及人均用量
图:2005-2012年中国塑料管材产能及同比增长
图:2005-2012年中国塑料管材产量及同比增长
图:2011年与2016年年中国塑料管材(分用途)市场需求量占比
图:2005-2012年中国塑料制管及其附件出口量及同比增长
图:2012年中国塑料管材(分国家)出口量占比
图:2009-2012年中国塑料管材进口量及同比增长
图:2012年中国塑料管材进口量(分国家)占比
图:2011年中国塑料管(分种类)产量占比
表:2001-2010年中国塑料管材前三大地区合计产量占比
表:2003-2010年中国塑料管材行业前20企业产量市场占有率
表:2009-2012年中国主要塑料管材企业营业收入
图:2012年中国塑料管材部分企业产能
表:2007-2012年中国塑料管材(分产品)指导价格
表:2011-2016年中国塑料管材产能与产量
表:中国塑料管材(分用途)产品发展趋势
图:2009-2012年中国PVC硬管进口量及同比增长
图:2009-2012年中国PVC硬管进口金额及同比增长
图:2009-2012年中国PVC硬管出口量及同比增长
图:2009-2012年中国PVC硬管出口金额及同比增长
表:1990-2010年全球HDPE管材(分地区)需求量
图:2009-2012年中国PE硬管进口量及同比增长
图:2009-2012年中国PE硬管进口金额及同比增长
图:2009-2012年中国PE硬管出口量及同比增长
图:2009-2012年中国PE硬管出口金额及同比增长
图:2008-2011年中国PP管材(分品种)市场需求量
图:2009-2012年中国PP硬管进口量及同比增长
图:2009-2012年中国PP硬管进口金额及同比增长
图:2009-2012年中国PP硬管出口量及同比增长
图:2009-2012年中国PP硬管出口金额及同比增长
表:2010年中国PP-R管材(分企业)产能与产量及原料来源
表:塑料管材下游应用
图:2002-2011年中国城市供水管材长度及同比增长
图:2002-2011年中国城市热水管材长度及同比增长
图:1990-2011年中国城市排水管材长度及排水管材密度
图:2002-2011年中国城市(分气体)管材长度
图:2012年沧州明珠股份公司子公司分布
图:2007-2012年沧州明珠公司营业收入及同比增长
图:2007-2012年沧州明珠公司净利润及同比增长
图:2007-2012年沧州明珠公司(分产品)营业收入
图:2007-2012年沧州明珠(分地区)营业收入
图:2007-2012年沧州明珠(分产品)毛利率
表:2009-2011年沧州明珠前5名供应商合计采购金额及占比
表:2009-2012年沧州明珠前5名客户合计营业收入贡献及占比
表:2012年沧州明珠前5名客户名称、营业收入贡献及占比
表:2009-2011年沧州明珠研发投入及占比
表:2011年沧州明珠在建工程
图:2005-2011年沧州明珠PE管材销量
表:2011-2015年沧州明珠营业收入与净利润
表:2012年伟星新材塑料管材业务子公司分布
表:2012年伟星新材产品种类及用途
表:2007-2012年伟星新材(分产品)产能
图:2007-2012年伟星新材公司营业收入及同比增长
图:2007-2012年伟星新材公司净利润及同比增长
图:2007-2012年伟星新材公司(分产品)营业收入
图:2007-2012年伟星新材公司(分地区)营业收入
图:2007-2012年伟星新材(分产品)毛利率
表:2009-2011年伟星新材前5名供应商合计采购金额占比
表:2009-2011年伟星新材前五名客户合计营业收入贡献及占比
表:2008-2012年伟星新材研发投入及占比
表:2012年伟星新材重点建设项目
表:2011-2015年伟星新材营业收入与净利润
表:2012年纳川股份子公司分布
表:2007-2012年纳川股份塑料管材(分基地)产能
图:2007-2012年纳川股份营业收入及同比增长
图:2007-2012年纳川股份净利润及同比增长
图:2007-2014年纳川股份HDPE缠绕增强管产能及同比增长
图:2007-2012年纳川股份(分产品)营业收入
图:2007-2012年纳川股份(分地区)营业收入
图:2007-2012年纳川股份(分产品)毛利率
表:2007-2010年纳川股份前五名供应商合计采购金额及占比
表:2007-2011年纳川股份前五名客户合计营业收入贡献及占比
表:2007-2011年纳川股份研发投入及占比
表:截止2012年9月底纳川股份在建工程
表:2011-2015年纳川股份营业收入与净利润
表:2012年青龙管业子公司
图:2007-2012年青龙管业营业收入及同比增长
图:2007-2012年青龙管业净利润及同比增长
图:2007-2012年青龙管业(分产品)营业收入
图:2007-2012年青龙管业(分地区)营业收入
图:2007-2012年青龙管业(分产品)毛利率
表:2007-2011年青龙管业前五名供应商合计采购金额及占比
图:2007-2012年青龙管业前五名客户合计营业收入贡献及占比
表:2012年青龙管业前5名客户名称、营业收入贡献及占比
表:2009-2011年青龙管业研发投入及占比
表:截止2012年6月底青龙管业主要在建工程
图:2007-2012年青龙管业塑料管材(分产品)营业收入及同比增长
表:2007-2009年青龙管业塑料管材(分产品)产能、产销量及均价
表:2011-2015年青龙管业营业收入与净利润
表:2012年国统股份子公司
图:2007-2012年国统股份营业收入及同比增长
图:2007-2012年国统股份净利润及同比增长
图:2007-2012年国统股份(分产品)营业收入
图:2007-2012年国统股份(分地区)营业收入
图:2007-2012年国统股份(分产品)毛利率
表:2011年国统股份前五名供应商名称、采购金额及占比
表:2010-2012年国统股份前五名客户合计营业收入贡献及占比
表:2008-2011年国统股份研发投入及占比
表:2011-2015年国统股份营业收入与净利润
表:2012年永高股份子公司
图:2008-2012年永高股份营业收入及同比增长
图:2008-2012年永高股份净利润及同比增长
表:2012年永高股份(分地区/分产品)产能
图:2008-2012年永高股份(分产品)营业收入
图:2008-2012年永高股份(分地区)营业收入
图:2008-2012年永高股份(分产品)毛利率
表:2008-2011年永高股份前五名供应商合计采购金额及占比
表:2008-2012年永高股份前五名客户合计营业收入贡献及占比
表:2008-2011年永高股份研发投入及占比
表:截止2012年6月底永高股份在建工程
表:2011-2015年永高股份营业收入与净利润
图:2009-2012年顾地科技营业收入及同比增长
图:2009-2012年顾地科技净利润及同比增长
图:2009-2011年顾地科技(分产品)营业收入
图:2009-2011年顾地科技(分地区)营业收入
图:2009-2011年顾地科技(分产品)毛利率
表:2009-2011年顾地科技前五名供应商合计采购金额及占比
表:2009-2011年顾地科技前五名客户合计营业收入贡献及占比
表:2009-2011年顾地科技研发投入及占比
表:2012年顾地科技在建项目
表:2009-2011年顾地科技(分产品)产能
表:2009-2011年顾地科技(分产品)产销量及产销率
表:2011-2015年顾地科技营业收入与净利润
图:中国联塑子公司
图:2007-2012年中国联塑营业收入及同比增长
图:2007-2011年中国联塑净利润及同比增长
图:2009-2012年中国联塑(分产品)营业收入
图:2009-2012年中国联塑(分地区)营业收入占比
图:2009-2012年中国联塑塑料管材(分产品)销量及同比增长
表:2010-2012年中国联塑塑料管材(分用途)营业收入及占比
表:2010-2015年中国联塑营业收入与净利润
图:2007-2012年国通管业营业收入及同比增长
图:2007-2012年国通管业净利润及同比增长
图:2007-2012年国通管业公司(分产品)营业收入
图:2007-2012年国通管业(分地区)营业收入
图:2007-2012年国通管业(分产品)毛利率
表:2010-2012年国通管业前5名客户合计营业收入贡献及占比
表:2011年国通管业前5名客户名称、营业收入贡献及占比
表:2011-2015年国通管业营业收入与净利润
Classification and Uses of Plastic Pipe (by Material)
Global Plastic Pipe Market Demand Structure (by Regions), 2009
Global Plastic Pipe Production and Per Capita Consumption (by Countries/Years)
China Plastic Pipe Capacity and YoY Growth Rate, 2005-2012
China Plastic Pipe Output and YoY Growth Rate, 2005-2012
China Plastic Pipe Market Demand Structure (by Applications), 2011 vs. 2016
Export Volume and YoY Growth Rate of China Plastic Pipe and Fittings, 2005-2012
China Plastic Pipe Export Volume Structure (by Countries), 2012
China Plastic Pipe Import Volume and YoY Growth Rate, 2009-2012
China Plastic Pipe Import Volume Structure (by Countries), 2012
China Plastic Pipe Output Structure (by Types), 2011
Proportion of Total Output of China’s Top Plastic Pipe Areas, 2001-2010
Output and Market Share of China’s Top 20 Plastic Pipe Enterprises, 2003-2010
Revenue of China’s Major Plastic Pipe Enterprises, 2009-2012
Capacity of China’s Plastic Pipe Enterprises, 2012 (Part)
China Plastic Pipe Guiding Price (by Products), 2007-2012
China Plastic Pipe Capacity and Output, 2011-2016E
Development Trends of China Plastic Pipe Products (by Applications)
China Rigid PVC Pipe Import Volume and YoY Growth Rate, 2009-2012
China Rigid PVC Pipe Import Value and YoY Growth Rate, 2009-2012
China Rigid PVC Pipe Export Volume and YoY Growth Rate, 2009-2012
China Rigid PVC Pipe Export Value and YoY Growth Rate, 2009-2012
Global HDPE Pipe Demand (by Regions), 1990-2010
China Rigid PE Pipe Import Volume and YoY Growth Rate, 2009-2012
China Rigid PE Pipe Import Value and YoY Growth Rate, 2009-2012
China Rigid PE Pipe Export Volume and YoY Growth Rate, 2009-2012
China Rigid PE Pipe Export Value and YoY Growth Rate, 2009-2012
China PP Pipe Market Demand (by Varieties), 2008-2011
China Rigid PP Pipe Import Volume and YoY Growth Rate, 2009-2012
China Rigid PP Pipe Import Value and YoY Growth Rate, 2009-2012
China Rigid PP Pipe Export Volume and YoY Growth Rate, 2009-2012
China Rigid PP Pipe Export Value and YoY, Growth Rate 2009-2012
China PP-R Pipe Capacity, Output and Raw Material Sources (by Enterprises), 2010
Downstream Application of Plastic Pipes
China Urban Water Supply Pipe Lengths and YoY Growth Rate, 2002-2011
China Urban Hot Water Pipe Length and YoY Growth Rate, 2002-2011
China Urban Drainage Pipe Length and Density, 1990-2011
China Urban Pipe Length (by Gases), 2002-2011
Distribution of Cangzhou Mingzhu Plastic’s Subsidiaries, 2012
Revenue and YoY Growth Rate of Cangzhou Mingzhu Plastic, 2007-2012
Net Income and YoY Growth Rate of Cangzhou Mingzhu Plastic, 2007-2012
Revenue Breakdown of Cangzhou Mingzhu Plastic by Products, 2007-2012
Revenue Breakdown of Cangzhou Mingzhu Plastic by Regions, 2007-2012
Gross Margin of Cangzhou Mingzhu Plastic by Products, 2007-2012
Cangzhou Mingzhu Plastic’s Procurement from Top 5 Suppliers and % of Total Procurement, 2009-2011
Cangzhou Mingzhu Plastic’s Revenue from Top 5 Clients and % of Total Revenue, 2009-2012
Name List and Revenue Contribution of Cangzhou Mingzhu Plastic’s Top 5 Clients, 2012
R&D Costs and % of Total Revenue of Cangzhou Mingzhu Plastic, 2009-2011
Cangzhou Mingzhu Plastic’s Projects under Construction, 2011
PE Pipe Sales Volume of Cangzhou Mingzhu Plastic, 2005-2011
Revenue and Net Income of Cangzhou Mingzhu Plastic, 2011-2015E
Distribution of Weixing NBM’s Plastic Pipe Subsidiaries, 2012
Types and Uses of Weixing NBM’s Products, 2012
Capacity of Weixing NBM by Products, 2007-2012
Revenue and YoY Growth Rate of Weixing NBM, 2007-2012
Net Income and YoY Growth Rate of Weixing NBM, 2007-2012
Revenue Breakdown of Weixing NBM by Products, 2007-2012
Revenue Breakdown of Weixing NBM by Regions, 2007-2012
Gross Margin of Weixing NBM by Products, 2007-2012
Weixing NBM’s Procurement from Top 5 Suppliers and % of Total Procurement, 2009-2011
Weixing NBM’s Revenue from Top 5 Clients and % of Total Revenue, 2009-2011
R&D Costs and % of Total Revenue of Weixing NBM, 2008-2012
Key Construction Projects of Weixing NBM, 2012
Revenue and Net Income of Weixing NBM, 2011-2015E
Distribution of Fujian Newchoice Pipe Technology’s Subsidiaries, 2012
Plastic Pipe Capacity of Fujian Newchoice Pipe Technology by Bases, 2007-2012
Revenue and YoY Growth Rate of Fujian Newchoice Pipe Technology, 2007-2012
Net Income and YoY Growth Rate of Fujian Newchoice Pipe Technology, 2007-2012
HDPE Winding Intensifier Tube Capacity and YoY Growth Rate of Fujian Newchoice Pipe Technology, 2007-2014E
Revenue Breakdown of Fujian Newchoice Pipe Technology by Products, 2007-2012
Revenue Breakdown of Fujian Newchoice Pipe Technology by Regions, 2007-2012
Gross Margin of Fujian Newchoice Pipe Technology by Products, 2007-2012
Fujian Newchoice Pipe Technology’s Procurement from Top 5 Suppliers and % of Total Procurement, 2007-2010
Fujian Newchoice Pipe Technology’s Revenue from Top 5 Clients and % of Total Revenue, 2007-2011
R&D Costs and % of Total Revenue of Fujian Newchoice Pipe Technology, 2007-2011
Fujian Newchoice Pipe Technology’s Projects under Construction by end-September 2012
Revenue and Net Income of Fujian Newchoice Pipe Technology, 2011-2015E
Subsidiaries of Ningxia Qinglong Pipes Industry, 2012
Revenue and YoY Growth Rate of Ningxia Qinglong Pipes Industry, 2007-2012
Net Income and YoY Growth Rate of Ningxia Qinglong Pipes Industry, 2007-2012
Revenue Breakdown of Ningxia Qinglong Pipes Industry by Products, 2007-2012
Revenue Breakdown of Ningxia Qinglong Pipes Industry by Regions, 2007-2012
Gross Margin of Ningxia Qinglong Pipes Industry by Products, 2007-2012
Ningxia Qinglong Pipes Industry’s Procurement from Top 5 Suppliers and % of Total Procurement, 2007-2011
Ningxia Qinglong Pipes Industry’s Revenue from Top 5 Clients and % of Total Revenue, 2007-2012
Name List and Revenue Contribution of Ningxia Qinglong Pipes Industry’s Top 5 Clients, 2012
R&D Costs and % of Total Revenue of Ningxia Qinglong Pipes Industry, 2009-2011
Ningxia Qinglong Pipes Industry’s Key Projects under Construction by end-June 2012
Plastic Pipe Revenue and YoY Growth Rate of Ningxia Qinglong Pipes Industry by Products, 2007-2012
Plastic Pipe Capacity, Output, Sales Volume and Average Price of Ningxia Qinglong Pipes Industry by Products, 2007-2009
Revenue and Net Income of Ningxia Qinglong Pipes Industry, 2011-2015E
Subsidiaries of Xinjiang Guotong Pipeline, 2012
Revenue and YoY Growth Rate of Xinjiang Guotong Pipeline, 2007-2012
Net Income and YoY Growth Rate of Xinjiang Guotong Pipeline, 2007-2012
Revenue Breakdown of Xinjiang Guotong Pipeline by Products, 2007-2012
Revenue Breakdown of Xinjiang Guotong Pipeline by Regions, 2007-2012
Gross Margin of Xinjiang Guotong Pipeline by Products, 2007-2012
Xinjiang Guotong Pipeline’s Procurement from Top 5 Suppliers and % of Total Procurement, 2011
Xinjiang Guotong Pipeline’s Revenue from Top 5 Clients and % of Total Revenue, 2010-2012
R&D Costs and % of Total Revenue of Xinjiang Guotong Pipeline, 2008-2011
Revenue and Net Income of Xinjiang Guotong Pipeline, 2011-2015E
Subsidiaries of Yonggao, 2012
Revenue and YoY Growth Rate of Yonggao, 2008-2012
Net Income and YoY Growth Rate of Yonggao, 2008-2012
Capacity of Yonggao by Regions/Products, 2012
Revenue Breakdown of Yonggao by Products, 2008-2012
Revenue Breakdown of Yonggao by Regions, 2008-2012
Gross Margin of Yonggao by Products, 2008-2012
Yonggao’s Procurement from Top 5 Suppliers and % of Total Procurement, 2008-2011
Yonggao’s Revenue from Top 5 Clients and % of Total Revenue, 2008-2012
R&D Costs and % of Total Revenue of Yonggao, 2008-2011
Yonggao’s Projects under Construction by end-June 2012
Revenue and Net Income of Yonggao, 2011-2015E
Revenue and YoY Growth Rate of Goody Technology, 2009-2012
Net Income and YoY Growth Rate of Goody Technology, 2009-2012
Revenue Breakdown of Goody Technology by Products, 2009-2011
Revenue Breakdown of Goody Technology by Regions, 2009-2011
Gross Margin of Goody Technology by Products, 2009-2011
Goody Technology’s Procurement from Top 5 Suppliers and % of Total Procurement, 2009-2011
Goody Technology’s Revenue from Top 5 Clients and % of Total Revenue, 2009-2011
R&D Costs and % of Total Revenue of Goody Technology, 2009-2011
Goody Technology’s Projects under Construction, 2012
Capacity Breakdown of Goody Technology by Products, 2009-2011
Output, Sales Volume and Sales-Output Ratio of Goody Technology by Products, 2009-2011
Revenue and Net Income of Goody Technology, 2011-2015E
Subsidiaries of China Liansu
Revenue and YoY Growth Rate of China Liansu, 2007-2012
Net Income and YoY Growth Rate of China Liansu, 2007-2011
Revenue Breakdown of China Liansu by Products, 2009-2012
Revenue Structure of China Liansu by Regions, 2009-2012
Plastic Pipe Sales Volume and YoY Growth Rate of China Liansu (by Products), 2009-2012
Plastic Pipe Revenue Structure of China Liansu (by Applications), 2010-2012
Revenue and Net Income of China Liansu, 2010-2015E
Revenue and YoY Growth Rate of Guotong Pipes, 2007-2012
Net Income and YoY Growth Rate of Guotong Pipes, 2007-2012
Revenue Breakdown of Guotong Pipes by Products, 2007-2012
Revenue Breakdown of Guotong Pipes by Regions, 2007-2012
Gross Margin of Guotong Pipes by Products, 2007-2012
Guotong Pipes’ Revenue from Top 5 Clients and % of Total Revenue, 2010-2012
Name List and Revenue Contribution of Guotong Pipes’ Top 5 Clients, 2011
Revenue and Net Income of Guotong Pipes, 2011-2015E
如果这份报告不能满足您的要求,我们还可以为您定制报告,请 留言说明您的详细需求。
|