|
|
|
报告导航:研究报告—
TMT产业—电子半导体
|
|
2012-2013年全球及中国先进硬PCB行业研究报告 |
 |
字数:3.7万 |
页数:178 |
图表数:202 |
|
中文电子版:9000元 |
中文纸版:4500元 |
中文(电子+纸)版:9500元 |
|
英文电子版:2600美元 |
英文纸版:2700美元 |
英文(电子+纸)版:2900美元 |
|
编号:ZYW142
|
发布日期:2013-03 |
附件:下载 |
 |
|
|
2012-2013年全球及中国先进硬PCB行业研究报告包括以下内容:1、PCB产业近况
2、全球与中国移动PC产业
3、全球与中国手机产业
4、PCB产业分析
5、31家PCB企业研究
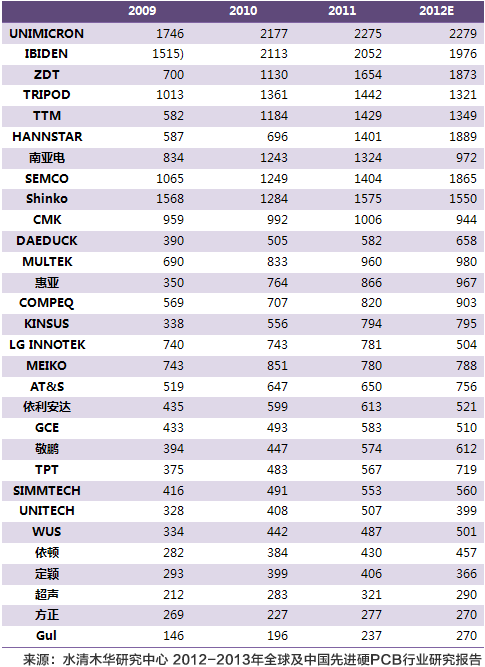
本报告只研究硬质PCB板。 2012年全球PCB产业产值受益于苹果、三星公司产品出货量高速增长,比2011年增加了7.0%,达到624亿美元,这对于已经很成熟的PCB产业来说很难得。不过2013年,这种高速增长不复存在,预计增幅放缓到2.7%。2012年如果客户名单里没有三星和苹果,大都难逃收入下滑的困境,2013年即使客户名单里有苹果也可能收入下滑。 2012年有一项重大收购,2012年6月惠亚(Viasystems)以2.67亿美元的价格收购了美国本土PCB制造厂家DDI。DDI在2011年收入263百万美元,净利润为25百万美元。 2012年PCB产业有两次大的火灾,一次是4月,金像电子常熟厂火灾,另一次是9月,惠亚广州厂火灾。而2013年2月,韩国SIMMTECH也发生了火灾。PCB产业是火灾高发区,每年都至少有两次大型火灾,这相当于产能天然减少,让PCB产业供需平衡保持的比较稳定。 2012年表现比较好的有鸿海旗下的ZDT。受益于最大客户苹果的大单,ZDT收入大增,尤其是软板收入。Hannstar PCB是全球最大的笔记本电脑用PCB厂家,受益于最大对手金像电子的火灾而收入大幅度增加。 SEMCO则受益于母公司三星的订单大幅度增加。COMPEQ受益于大客户苹果的订单增加。表现比较差的有南亚电路板,其大客户Intel有一个季度未给予订单。LG INNOTEK则受到大客户LG手机出货量锐减影响。中国大陆PCB企业表现还不错,基本持平。 2009-2012年全球PCB硬板企业收入前30名
单位:(百万美元)
The report highlights the followings:1. Recent developments of PCB Industry 2. Global and China Mobile PC Industry 3. Global and China Mobile Phone Industry 4. PCB Industry 5. 31 PCB Companies The
report only focuses on rigid PCB. In 2012, global PCB industry saw a
jump in terms of output value, benefitting in a large part from the
rapid growth in the shipment of Apple and Samsung, up 7.0% over 2011 to
USD62.4 billion. It was not always the truth for the full-blown PCB
industry. However, there is no such possibility of huge jump in 2013,
and the expected growth rate will slow down to 2.7%. For most rigid PCB
vendors, it was doomed for them to face revenue dive in 2012 unless both
Samsung and Apple were included in their client lists, while in 2013
their revenue is likely to drop even if Apple is among the clients. The
big acquisition event in 2012 was Viasystems’ takeover of America-based
PCB producer DDI at a cost of USD267 million in June. In 2011, DDI’s
revenue reached USD263 million, and its net income hit USD25 million. In
2012, two massive fire accidents took place in PCB industry. One
happened in Apr. to the Changshu plant under Gold Circuit Electronics,
the other was in Sep. with the sufferer coming to the Guangzhou plant
under Viasystems. In Feb.2013, South Korean SIMMTECH was also on fire.
PCB industry is vulnerable to fire accidents which break out twice
annually at least. This leads to the natural reduction of capacity,
balancing out the supply and demand. In 2012, ZDT under Hon Hai
Precision Ind. Co., Ltd. performed better, due to sizeable orders from
Apple, the largest client. As a result, the revenue of ZDT witnessed
huge jump, especially its revenue from flexible PCB. Hannstar PCB, as
the world’s largest notebook PCB vendor, saw a substantial surge in
revenue following the fire accident inflicting Gold Circuit Electronics,
its largest rival. SEMCO saw big rise in orders thanks to its
parent company Samsung which won considerable orders, and COMPEQ also
did a good job due to the growing orders from the big client Apple.
However, Nanya PCB dwarfed in this regard, since its failure to get
orders from the big client Intel for one quarter long. And it was the
same story for LG INNOTEK, the mobile phone shipment of whose big client
LG presented a steep drop. As for counterparts in Mainland China, they
leveled out in this regard. Top 30 Rigid PCB Vendors Worldwide by Revenue, 2009-2012 (USD mln)
第一章、PCB产业概况
1.1、全球PCB产业产值
1.2、PCB产业近况与未来趋势
1.3、台湾PCB产业
1.4、中国大陆PCB产业
1.4.1、中国大陆PCB产业规模
1.4.2、中国大陆PCB政策
1.5、欧洲PCB产业
第二章、PCB下游市场
2.1、手机
2.1.1、全球手机市场规模
2.1.2、手机品牌市场占有率
2.1.3、智能手机市场与产业
2.1.4、中国手机产业地域分布
2.1.5、中国手机出口
2.2、笔记本电脑
2.2.1、笔记本电脑产业
2.2.2、笔记本电脑代工
2.2.3、平板电脑产业
2.2.4、中国移动PC产业
第三章、PCB产业分析
3.1、手机PCB产业
3.1.1、手机PCB厂家排名
3.1.2、手机PCB配套关系
3.2、内存模块PCB
3.3、光电板
3.4、汽车电子PCB
3.5、笔记本电脑PCB
3.6、全球PCB企业排名
第四章、主要PCB企业研究
4.1、欣兴
4.2、华通
4.3、瀚宇博德
4.4、金像电子
4.5、健鼎
4.6、名幸MEIKO
4.7、CMK
4.7.1、无锡希门凯
4.7.2、瑞升科技
4.7.3、旗利得电子
4.8、IBIDEN
4.9、大德电子
4.10、TTM
4.11、耀华
4.12、AT&S
4.13、建滔
4.13.1、依利安达
4.13.2、科惠线路板
4.13.3、扬宣电子
4.14、SIMMTECH
4.15、志超T.P.T
4.16、依顿电子
4.17、敬鹏
4.18、LG INNOTEK
4.19、SEMCO
4.20、方正电路板
4.21、高德电子
4.22、定颖
4.23、惠亚
4.24、南亚电路板
4.25、深南电路
4.26、沪士电子
4.27、超声电子
4.28、臻鼎ZDT
4.29、MULTEK
4.30、景硕
4.31、Shinko
1.Overview of PCB Industry
1.1. Output Value of Global PCB Industry
1.2. Recent Developments and Future Trends of PCB Industry
1.3. Taiwan PCB Industry
1.4. Chinese Mainland PCB Industry
1.4.1 Industrial Scale
1.4.2. Policy on PCB
1.5. European PCB Industry
2. PCB Downstream Market
2.1 Mobile Phone
2.1.1 Global Mobile Phone Market Size
2.1.2 Market Share of Mobile Phone by Brand
2.1.3 Smartphone Market and Industry
2.1.4 China Mobile Phone Industry by Region
2.1.5 Mobile Phone Export in China
2.2 Notebook Computer
2.2.1 Notebook Computer Industry
2.2.2 Notebook Computer Foundry
2.2.3 Tablet PC Industry
2.2.4 China Mobile PC Industry
3. Analysis of PCB Industry
3.1. Mobile Phone PCB Industry
3.1.1 Ranking of PCB Companies for Mobile Phone
3.1.2 Supporting Relationship of Mobile Phone PCB
3.2 Memory Module PCB
3.3 Photonics PCB
3.4 PCB For Automotive Electronics
3.5 PCB for Notebook Computer
3.6 Ranking of Global PCB Companies
4. Major PCB Companies
4.1 Unimicron
4.2 Compeq
4.3 Hannstar Broad PCB
4.4 Gold Circuit Electronics
4.5 Tripod Technology
4.6 Meiko
4.7 CMK
4.7.1 WUXI CMK
4.7.2 CMK GBM
4.7.3 CMKC DONGGUAN
4.8 IBIDEN
4.9 DAEDUCK
4.10 TTM
4.11 Unitech PCB
4.12 AT&S
4.13 Kingboard
4.13.1 Elec&Eltek
4.13.2 Tech-Wise Circuit
4.13.3 Express Electronics
4.14 SIMMTECH
4.15 T.P.T
4.16 Ellington Electronics
4.17 Chinpoon Industrial
4.18 LG INNOTEK
4.19 SEMCO
4.20 Founder PCB
4.21 Gul Technologies
4.22 Dynamic PCB
4.23 Viasystems
4.24 Nanya PCB
4.25 Shennan Circuit
4.26 WUS Electronics
4.27 Guangdong Goworld
4.28 ZDT
4.29 Multek
4.30 Kinsus
4.31 Shinko
2006-2013年PCB产业产值
PCB产业链
2009-2015年PCB产业收入分布(分技术)
2012年传统PCB收入产品分布
2000-2012年全球PCB产业收入地域分布
2010-2012年全球PCB产业收入地域分布
2010-2012年全球PCB产业收入下游分布
2005-2011年台湾PCB产业收入产品分布
2005-2012年台湾PCB产业收入产品分布
2000-2010年台湾PCB产业进出口值
2009-2010年台湾PCB产业收入下游应用分布
2001-2012年中国PCB产业产值
2004-2011年台湾PCB厂家大陆产值产品分布
2009-2010年台湾PCB厂家大陆产值下游应用分布
2005年3季度-2011年3季度台湾地区与中国大陆每季度激光钻孔机销量
2010-2011年中国大陆PCB企业投资结构
2011-2012年大陆PCB产业产值技术分布
2010年欧洲PCB厂家收入国别分布
2010年欧洲TOP50 -PCB厂家
2007-2014年全球手机出货量
2010-2013年全球CDMA/WCDMA手机出货量地域分布
2011、2012年全球主要手机厂家销量
2012年4季度全球主要手机厂家销量
2012年4季度韩国主要手机厂家市场占有率
2012年4季度美国主要手机厂家市场占有率
2012、2013年全球主要智能手机厂家销量
2012年4季度全球智能手机操作系统分布
2011年1-11月中国手机产量各省分布
2012年11月中国手机分省市产量数据表
2011年1月-2012年12月我国手机月度出口量价走势图
2012年我手机出口前10大市场情况表
2010-2013年笔记本电脑主要品牌出货量
2006、2008年主要笔记本电脑代工厂家市场占有率
2010年全球笔记本电脑品牌厂家与代工厂家之间配套关系及出货比例
2011年全球笔记本电脑品牌厂家与代工厂家之间配套关系及出货比例
2012、2013年全球笔记本电脑品牌厂家与代工厂家之间配套关系及出货比例
2012、2013年平板电脑主要厂家产量
2004-2012年中国笔记本电脑(包括平板电脑)产量
2010-2012年中国笔记本电脑产量(包括平板电脑)地域分布
2010-2012年手机PCB厂家排名
2010-2012年NOKIA手机PCB供应商供应比例
2010-2012年SAMSUNG手机PCB供应商供应比例
2010-2012年LG手机PCB供应商供应比例
2010-2012年ZTE手机PCB供应商供应比例
2010-2012年RIM手机PCB供应商供应比例
2010-2011年APPLE手机PCB供应商供应比例
2010-2012年内存PCB厂家市场占有率
2006\2010\2011\2012年中国光电板主要厂家市场占有率
2010-2012年汽车电子PCB厂家收入市场占有率
2011-2012年笔记本电脑PCB板主要厂家市场占有率(按出货量)
2009-2012年全球PCB硬板厂家收入前30名
2003-2013年欣兴收入与毛利率
2011年1季度-2012年4季度欣兴每季度收入与毛利率
2010-2012年欣兴收入产品分布
2010-2011年欣兴收入下游应用分布
欣兴制造基地分布
欣兴历年合并
欣兴电子控股企业关系图
欣兴主要子公司2009-2011年财务数据
2006-2013年华通收入与毛利率
2011年1月-2013年1月华通每月收入与增幅
2009-2011年华通主要子公司财务数据
瀚宇博德关系企业图
2006-2013年瀚宇博德收入与毛利率
2011年1月-2013年1月瀚宇博月度收入与增幅
2009-2012年瀚宇博收入下游应用分布
2009-2012年瀚宇博收入Layer分布
2011年瀚宇博德主要子公司财务数据
2005-2013年金像电子收入与毛利率
2011年1月-2013年1月金像电子 每月收入与增幅
2010-2012年金像电子收入产品分布
2006-2013年健鼎收入与毛利率
2011年1月-2013年1月健鼎每月收入与增幅
2006-2011年健鼎产能
2006-2013财年名幸电子收入与运营利润率
2009-2012财年名幸电子大陆子公司收入与运营利润率
2010财年-2013财年上半年名幸电子收入下游应用分布
2010财年-2013财年上半年名幸电子收入技术分布by layer
2005-2013财年CMK收入与运营利润率
2007-2015财年CMK收入下游应用分布
2007-2013财年 CMK收入by layer
2007-2015财年 CMK收入地域分布
2003-2010年无锡希门凯收入与产量
2006-2013财年IBIDEN收入与运营利润率
2006-2013财年3季度IBIDEN收入业务分布
2009-2013财年3季度IBIDEN运营利润业务分布
2008-2012年IBIDEN HDI板产量
2007-2011年揖斐电电子收入
2005-2013年大德电子收入与运营利润率
2009-2013年大德电子收入by bunesiss
2005-2013年大德GDS收入与运营利润率
2010-2013年大德GDS收入业务分布
2004-2008年美维收入与运营利润
2005-2012年TTM收入与运营利润率
2008-2012年TTM收入下游应用分布
2008-2012年TTM收入地域分布
2006-2013年耀华收入与毛利率
2011年1月-2013年1月耀华每月收入与增幅
硬板技术路线图
软硬板技术路线图
2006-2013财年AT&S收入与EBITDA
AT&S基地全球一览
2011年AT&S各基地收入产品分布
2011年AT&S各基地产能
2006-2012财年 AT&S产值地域分布
2011-2013财年 AT&S收入地域分布
2009-2013财年 AT&S收入下游应用分布
建滔集团组织结构
2002-2012年建滔集团收入与股东应占利润率
2008-2012年建滔集团收入业务分布
依利安达组织结构
2005-2011年依利安达收入与运营利润率
2006-2011年依利安达收入地域分布
2006-2011年依利安达收入技术分布by layer
2010年底依利安达各厂产能
依利安达技术能力
2004-2009年扬宣多层板产量
2004-2009年扬宣双面板产量
2010年扬宣制程能力
2004-2013年SIMMTECH收入与运营利润率
2010年1季度-2012年4季度 SIMMTECH收入与运营利润率
2012年1季度-2013年4季度SIMM TECH收入产品分布
2012年1季度-2013年4季度SIMM TECH Substrate收入产品分布
2004-2010年SIMMTECH客户分布
SIMMTECH厂区
2005-2013年志超收入与毛利率
2011年1月-2013年1月志超每月收入与增幅
2012年志超客户结构
2012年志超收入下游分布
2007-2011年志超各厂产能
依顿电子股权结构
2007-2011年依顿电子收入与毛利率
2007-2012年2季度 依顿电子产量
2009-2012年H1 依顿电子收入Layer分布
2001-2010年依顿电子收入技术分布by layer
2007-2010年3季度 依顿电子收入by application
2009-2012H1 依顿电子收入by application
2007-2010年3季度 依顿电子收入by region
2009-2012H1 依顿电子收入by Region
2007-2012年 依顿电子收入客户结构
2005-2013年敬鹏收入与毛利率
2011年1月-2013年1月敬鹏每月收入与增幅
2007-2010敬鹏各厂产能月产能(K SF)
2006-2013年LG INNOTEK收入与运营利润率
2011年1季度-2012年4季度LG INNOTEK收入与运营利润率
2011-2013年LG INNOTEK 收入业务分布
2011-2013年LG INNOTEK 运营利润业务分布
2011年4季度-2012年4季度LG INNOTEK收入业务分布
2010-2013年SEMCO收入部门分布
2010-2013年SEMCO运营利润部门分布
2011年1季度-2012年4季度SEMCO ACI事业部收入与运营利润
2011年1季度-2012年4季度SEMCO ACI事业部收入产品分布
2007-2012年方正PCB收入与运营利润率
2010年方正PCB下游应用分布
方正重庆厂产能
珠海方正一厂产能
珠海方正三厂产能
珠海方正五厂产能
方正杭州二厂产能by technology
珠海方正四厂产能
方正HDI技术能力
2005-2012年高德电子收入与运营利润
高德电子关系企业
2006-2013年定颖收入与毛利率
2011年1月-2013年1月定颖每月收入与增幅
2009-2012年定颖产能
2006-2013年惠亚收入与运营利润率
2008-2012年惠亚收入业务分布
惠亚全球分布
2008-2011年惠亚集团收入下游应用分布
2008-2011年惠亚主要客户
惠亚主要客户
2010-2012年惠亚集团收入
DDI收入地域和终端市场分布
DDI工厂分布
DDI主要客户
2006-2012年南亚电路板收入与毛利率
2011年1月-2013年1月南亚电路板每月收入与增幅
南亚电路板产能与全球分布
2010年南亚电路板客户结构
深南电路技术能力
2007-2012年沪士电子收入与运营利润
2007-2009年沪士电子出货量by layer
2007-2009年沪士电子收入
2007-2011年沪士电子收入下游分布
2010年沪士电子主要客户
2005-2012年超声电子收入与运营利润率
超声电子组织结构
2007-2012年超声电子收入业务分布
2007-2011年超声电子产量
臻鼎组织结构
臻鼎全球分布
2008-2013年臻鼎收入与运营利润率
2006-2011年1月底臻鼎员工数量
2011年11月-2013年1月臻鼎月度收入与增幅
2011-2013年Multek ELIC技术路线图
2011-2013年Multek 软硬板 技术路线图
2011-2013年Multek Microvias技术路线图
2003-2013年景硕收入与毛利率
2011年1月-2013年1月景硕每月收入与增幅
2011-2012年景硕收入产品分布
2011年景硕收入下游应用分布
2007-2013财年Shinko收入与净利润
2011-2012财年Shinko收入业务分布
Output Value of PCB Industry, 2006-2013
PCB Industry Chain
Revenue of PCB Industry by Technology, 2009-2015E
Revenue of Traditional PCB Products, 2012
Revenue of Global PCB Industry by Region, 2000-2012
Revenue of Global PCB Industry by Region, 2010-2012
Revenue of Global PCB Industry by Application, 2010-2012
Revenue of PCB Industry in Taiwan by Product, 2005-2011
Revenue of PCB Industry in Taiwan by Product, 2005-2012
Import/Export Value of Taiwan PCB Industry, 2000-2010
Revenue of Taiwan PCB Industry by Application, 2009-2010
Output Value of China PCB Industry, 2001-2012
Revenue of Taiwanese PCB Vendors on Chinese Mainland by Product, 2004-2011
Output Value of Taiwanese PCB Vendors on Chinese Mainland by Application, 2004-2010
Quarterly Sales Volume of Laser Drilling Machine in Taiwan and Chinese Mainland, 2005Q3-2011Q3
Investment Structure of PCB Companies in Mainland China, 2010-2011
Output Value of PCB Industry in Mainland China by Technology, 2011-2012
Revenue of European PCB Vendors by Country, 2010
TOP 50 PCB Vendors in Europe, 2010
Global Mobile Phone Shipment, 2007-2014E
Global CDMA/WCDMA Mobile Phone Shipment by Region, 2010-2013
Sales Volume of Major Mobile Phone Vendors Worldwide, 2011 vs.2012
Sales Volume of Major Mobile Phone Vendors Worldwide, 2012Q4
Market Share of Major Mobile Phone Vendors in South Korea, 2012Q4
Market Share of Major Mobile Phone Vendors in America, 2012Q4
Sales Volume of Major Smartphone Vendors Worldwide, 2012 vs.2013
Smartphone Operating System Distribution Worldwide, 2012Q4
Mobile Phone Output of China by Province, Jan.-Nov., 2011
Mobile Phone Output of China by Region, Nov.2012
Monthly Mobile Phone Export Volume/Price of China, Jan.2011-Dec.2012
Top 10 Mobile Phone Export Destinations of China, 2012
Notebook Shipment by Brand, 2010-2013
Market Share of Major Notebook Foundries, 2006 vs.2008
Supporting Relationship between Notebook Brands and their Foundries and Shipment Proportion Worldwide, 2010
Supporting Relationship between Notebook Brands and their Foundries and Shipment Proportion Worldwide, 2011
Supporting Relationship between Notebook Brands and their Foundries and Shipment Proportion Worldwide, 2012 vs.2013
Output of Major Tablet PC Vendors, 2012 vs.2013
Output of Notebook Computer (Including Tablet PC) in China, 2004-2012
Output of Notebook Computer (Including Tablet PC) in China by Region, 2010-2012
Ranking of Mobile Phone PCB Vendors, 2010-2012
Supply (%) of PCB for NOKIA Mobile Phone by Supplier, 2010-2012
Supply (%) of PCB for SAMSUNG Mobile Phone by Supplier, 2010-2012
Supply (%) of PCB for LG Mobile Phone by Supplier, 2010-2012
Supply (%) of PCB for ZTE Mobile Phone by Supplier, 2010-2012
Supply (%) of PCB for RIM Mobile Phone by Supplier, 2010-2011
Supply (%) of PCB for Apple Mobile Phone by Supplier, 2010-2011
Market Share of Memory PCB Businesses, 2010-2012
Market Share of Major PV Panel Businesses in China, 2006/2010/2011/2012
Market Share of Automotive Electronic PCB Businesses, 2010-2012
Market Share of Major Notebook PCB Vendors by Shipment, 2011-2012
Top 30 Rigid PCB Vendors Worldwide by Revenue, 2009-2012
Revenue and Gross Margin of Unimicron, 2003-2013
Quarterly Revenue and Gross Margin of Unimicron, 2011Q1-2012Q4
Revenue of Unimicron by Product, 2010-2012
Revenue of Unimicron by Application, 2010-2011
Production Base Distribution of Unimicron
M&A History of Unimicron
Affiliated Holding Companies of Unimicron
Financial Data of Major Subsidiaries under Unimicron, 2009-2011
Revenue and Gross Margin of Compeq, 2006-2013
Monthly Revenue and Growth Rate of Compeq, Jan.2011-Jan.2013
Financial Data of Major Subsidiaries under Compeq, 2009-2011
Affiliated Companies of Hannstar Broad PCB
Revenue and Gross Margin of Hannstar Broad PCB, 2006-2013
Monthly Revenue and Growth Rate of Hannstar Broad PCB, Jan.2011-Jan.2013
Revenue of Hannstar Broad PCB by Application, 2009-2012
Revenue of Hannstar Broad PCB by Layer, 2009-2012
Financial Data of Major Subsidiaries under Hannstar Broad PCB, 2011
Revenue and Gross Margin of Gold Circuit Electronics, 2005-2013
Monthly Revenue and Growth Rate of Gold Circuit Electronics, Jan.2011-Jan.2013
Revenue of Gold Circuit Electronics by Product, 2010-2012
Revenue and Gross Margin of Tripod Technology, 2006-2013
Monthly Revenue and Growth Rate ofTripod Technology, Jan.2011-Jan.2013
Capacity of Tripod Technology, 2006-2011
Revenue and Operating Margin of Meiko, FY2006-FY2013
Revenue and Operating Margin of Chinese Mainland Subsidiaries under Meiko, FY2009-FY2012
Revenue of Meiko by Application, FY2010-FY2013
Revenue of Meiko by Layer, FY2010-FY2013H1
Revenue and Operating Margin of CMK, FY2005-FY2013
Revenue of CMK by Application, FY2007-FY2015
Revenue of CMK by Layer, FY2007-FY2013
Revenue of CMK by Region, FY2007-FY2015
Revenue and Output of WUXI CMK, 2003-2010
Revenue and Operating Margin of IBIDEN, FY2006-FY2013Q3
Revenue of IBIDEN by Business, FY2006-FY2013Q3
Operating Profit of IBIDEN by Business, FY2009-FY2013
HDI Output of IBIDEN, 2008-2012
Revenue of IBIDEN, 2007-2011
Revenue and Operating Margin of GDS, 2005-2013
Revenue of GDS by Business, 2009-2013
Revenue and Operating Margin of GDS, 2005-2013
Revenue of GDS by Business, 2010-2013
Revenue and Operating Profit of TTM, 2004-2008
Revenue and Operating Margin of TTM, 2005-2012
Revenue of TTM by Application, 2008-2012
Revenue of TTM by Region, 2008-2012
Revenue and Gross Margin of Unitech PCB, 2006-2013
Monthly Revenue and Growth Rate of Unitech PCB, Jan.2011-Jan.2013
Technology Roadmap of Rigid PCB
Technology Roadmap of Flexible/Rigid PCB
Revenue and EBITDA of AT&S, FY2006-FY2013
Worldwide Bases under AT&S
Revenue of Bases under AT&S by Product, 2011
Capacities of Bases under AT&S, 2011
Output Value of AT&S by Region, FY2006-FY2012
Revenue of AT&S by Region, FY2011-FY2013
Revenue of AT&S by Application, FY2009-FY2013
Organization of Kingboard
Revenue and Profit Margin Attributable to Shareholders of Kingboard, 2002-2012
Revenue of Kingboard by Business, 2008-2012
Organization of Elec&Eltek
Revenue and Operating Margin of Elec&Eltek, 2005-2011
Revenue of Elec&Eltek by Region, 2006-2011
Revenue of Elec&Eltek by Layer, 2006-2011
Capacity of Plants under Elec&Eltek, Late 2010
Technology Capability of Elec&Eltek
Multi-Layer Board Output of Express Electronics, 2004-2009
Double-Sided Board Output of Express Electronics, 2004-2009
Processing Capability of Express Electronics, 2010
Revenue and Operating Margin of SIMMTECH, 2004-2013
Revenue and Operating Margin of SIMMTECH, 2010Q1-2012Q4
Revenue of SIMM TECH by Product, 2012Q1-2013Q4
Revenue of SIMM TECH Substrate by Product, 2012Q1-2013Q4
Client Distribution of SIMMTECH, 2004-2010
Plants under SIMMTECH
Revenue and Gross Margin of T.P.T, 2005-2013
Monthly Revenue and Growth Rate of T.P.T, Jan.2011-Jan.2013
Client Structure of T.P.T, 2012
Revenue of T.P.T by Application, 2012
Capacity of Plants under T.P.T, 2007-2011
Equity Structure of Ellington Electronics
Revenue and Gross Margin of Ellington Electronics, 2007-2011
Output of Ellington Electronics, 2007-2012Q2
Revenue of Ellington Electronics by Layer, 2009-2012H1
Revenue of Ellington Electronics by Layer, 2001-2010
Revenue of Ellington Electronics by Application, 2007-2010Q3
Revenue of Ellington Electronics by Application, 2009-2012H1
Revenue of Ellington Electronics by Region, 2007-2010Q3
Revenue of Ellington Electronics by Region, 2009-2012H1
Revenue of Ellington Electronics by Client, 2007-2012
Revenue and Gross Margin of Chin-Poon Industrial, 2005-2013
Monthly Revenue and Growth Rate of Chin-Poon Industrial, Jan.2011-Jan.2013
Monthly Capacity of Plants under Chin-Poon Industrial,2007-2010
Revenue and Operating Margin of LG INNOTEK, 2006-2013
Revenue and Operating Margin of LG INNOTEK, 2011Q1-2012Q4
Revenue of LG INNOTEK by Business, 2011-2013
Operating Profit of LG INNOTEK by Business, 2011-2013
Revenue of LG INNOTEK by Business, 2011Q4-2012Q4
Revenue of SEMCO by Division, 2010-2013
Operating Profit of SEMCO by Division, 2010-2013
Revenue and Operating Profit of SEMCO ACI Business Division, 2011Q1-2012Q4
Revenue of SEMCO ACI Business Division by Product, 2011Q1-2012Q4
Revenue and Operating Margin of Founder PCB, 2007-2012
PCB Downstream Application of Founder PCB, 2010
Capacity of Chongqing Plant under Founder PCB by Technology
Capacity of No.1 Plant under Zhuhai Founder PCB by Technology
Capacity of No.3 Plant under Zhuhai Founder PCB by Technology
Capacity of No.5 Plant under Zhuhai Founder PCB by Technology
Capacity of No.2 Plant under Hangzhou Founder PCB by Technology
Capacity of No.4 Plant under Zhuhai Founder PCB by Technology
HDI Technology Capability of Founder PCB
Revenue and Operating Profit of Gul Technologies, 2005-2012
Affiliated Businesses of Gul Technologies
Revenue and Gross Margin of Dynamic PCB, 2006-2013
Monthly Revenue and Growth Rate of Dynamic PCB, Jan.2011-Jan.2013
Capacity of Dynamic PCB, 2009-2012
Revenue and Operating Margin of Viasystems, 2006-2013
Revenue of Viasystems by Business, 2008-2012
Global Distribution of Viasystems
Revenue of Viasystems by Application, 2008-2011
Major Clients of Viasystems, 2008-2011
Major Clients of Viasystems
Revenue of Viasystems, 2010-2012
Distribution of DDI by Region and Terminal Market
Plants Distribution Of DDI
Major Clients of DDI
Revenue and Gross Margin of Nanya PCB, 2006-2012
Monthly Revenue and Growth Rate of Nanya PCB, JAN.2011-JAN.2013
Capacity and Global Distribution of Nanya PCB
Client Structure of Nanya PCB, 2010
Technology Capabilities of Shennan Circuit
Revenue and Operating Margin of WUS Electronics, 2007-2009
Shipment of Wus Electronics by Layer, 2007-2009
Revenue of Wus Electronics, 2007-2009
Revenue of Wus Electronics by Application, 2007-2011
Major Clients of WUS Electronics
Revenue and Operating Margin of Guangdong Goworld, 2005-2012
Organization of Guangdong Goworld
Revenue of Guangdong Goworld by Business, 2007-2012
Output of Guangdong Goworld, 2007-2011
Organization OF ZDT
Global Distribution of ZDT
Revenue and Operating Margin of ZDT, 2008-2013
Workforce of ZDT, 2006-Late Jan.2011
Monthly Revenue and Growth Rate of ZDT, Nov.2011-Jan.2013
Technology Roadmap of Multek ELIC, 2011-2013
Technology Roadmap of Flexible/ Rigid PCB of Multek, 2011-2013
Technology Roadmap of Multek Microvias, 2011-2013
Revenue and Gross Margin of Kinsus, 2003-2013
Monthly Revenue and Growth Rate of Kinsus, Jan.2011-Jan.2013
Revenue of Kinsus by Product, 2011-2012
Revenue of Kinsus by Application, 2011
Revenue and Net Income of Shinko, FY2007-FY2013
Revenue of Shinko By Business, FY2011-FY2012
如果这份报告不能满足您的要求,我们还可以为您定制报告,请 留言说明您的详细需求。
|