|
|
|
报告导航:研究报告—
制造业—化工
|
|
2012-2015年全球及中国粘胶纤维行业研究报告 |
 |
字数:3.8万 |
页数:103 |
图表数:93 |
|
中文电子版:8000元 |
中文纸版:4000元 |
中文(电子+纸)版:8500元 |
|
|
|
|
|
编号:HK029
|
发布日期:2013-03 |
附件:下载 |
 |
|
|
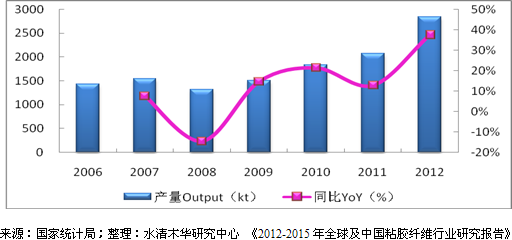
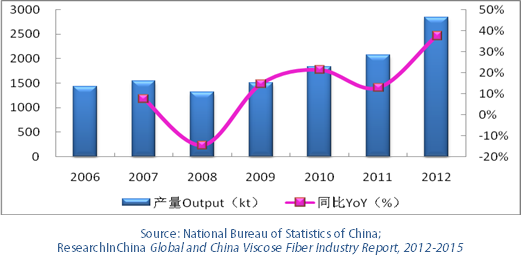
粘胶纤维是以自然界中的木材、竹片、棉短绒等为原料,经加工制成的人造纤维素纤维,主要应用于纺织业。粘胶纤维包括粘胶长丝和粘胶短纤两类,其中粘胶短纤产量较大,约占粘胶纤维总产量的90%左右。 进入21世纪以来,欧美等发达国家因劳动成本过高、环保要求严格等影响,粘胶纤维生产逐步向亚太地区转移。目前全球粘胶纤维产量约80%来源于亚太地区的发展中国家。其中中国已成为全球最大的粘胶纤维产地,2012年中国粘胶纤维产量约占全球总量的62%。 2006-2012年,中国粘胶纤维产量保持着较快的增长速度,年均复合增长率达12.1%。2012年中国粘胶纤维产量增长至258.8万吨,主要分布在华东地区、华北地区和西北地区。中国粘胶纤维品种多为普通粘胶纤维,高端粘胶纤维品种如Lyocell纤维、Modal纤维等主要依赖于进口。
图:2006-2012年中国粘胶纤维产量及同比增长
2012年,全球最大的粘胶纤维生产商是印度博拉集团,粘胶纤维产能达80万吨左右,在印度、泰国、印尼、中国等设有生产基地;其次为奥地利兰精公司,粘胶纤维产能为77万吨(2011年),在奥地利、印尼、中国、英国和美国设有工厂,且在Lyocell纤维、Modal纤维方面具有垄断地位。除二者外,全球粘胶纤维产能较大的厂商主要集中在中国。 中国粘胶纤维行业集中度较高,2012年排名前10的粘胶纤维生产企业的产能之和占中国粘胶纤维总产能的77.3%。富丽达是中国最大的粘胶短纤生产企业,新乡化纤和丝丽雅集团是中国最大的粘胶长丝生产企业。 吉林化纤是中国最大的竹浆纤维生产企业,2012年其竹浆短纤和竹浆长丝的产能分别为4.8万吨/年和7000吨/年。公司目前正在扩建竹浆粕及竹浆短纤产能,以保持竹浆纤维市场的主导地位。 水清木华研究中心《2012-2015年全球及中国粘胶纤维行业研究报告》主要包括以下几个内容:
- 全球粘胶纤维行业供需分析、竞争格局及发展趋势等;
- 中国粘胶纤维行业发展历程、行业运营及相关政策等;
- 中国粘胶纤维行业供需分析、进出口分析、价格走势及供需预测等;
- 中国竹浆纤维细分市场现状及竞争格局等;
- 全球及中国13家粘胶纤维行业生产企业的经营状况、粘胶纤维业务分析及发展预测等。
Viscose fiber is a type of artificial cellulose fiber made of such raw materials as wood, bamboo and cotton linters, mainly used in the textile industry. Viscose fiber includes viscose filament yarn and viscose staple fiber, especially the viscose staple fiber output accounts for about 90% of the total viscose fiber output. Since the 21st century, due to high labor costs and strict environmental requirements, Europe, the United States and other developed countries have transferred their viscose fiber production to Asia-Pacific region. Currently about 80% of the global viscose fiber output comes from the developing countries in Asia-Pacific. China has become the world's largest viscose fiber producer, and its output accounted for roughly 62% of global total in 2012. In 2006-2012, China’s viscose fiber output grew quickly at the average compound annual growth rate of 12.1%. In 2012, the output rose to 2.588 million tons, which was mainly distributed in East China, North China and Northwest China. China mainly produces general viscose fiber, while it needs to import high-end viscose fiber such as lyocell fiber and modal fiber.
Viscose Fiber Output and YoY Growth Rate in China, 2006-2012
In 2012, Aditya Birla Group was the world's largest manufacturer of viscose fiber with the capacity of 800,000 tons or so and production bases in countries like India, Thailand, Indonesia and China. Austrian Lenzing ranked the second with the viscose fiber capacity of 770,000 tons (2011) and plants in Austria, Indonesia, China, the United Kingdom and the United States; besides, it occupies a monopolistic position in lyocell fiber and modal fiber. In addition to the above two companies, large viscose fiber manufacturers are mainly located in China. Chinese viscose fiber industry features high concentration. In 2012, top 10 viscose fiber producers contributed 77.3% to national total viscose fiber capacity. Fulida Group is the largest viscose staple fiber manufacturer in China, Xinxiang Chemical Fiber and Grace Group act as the biggest Chinese producers of viscose filament yarn. Jilin Chemical Fiber is the largest bamboo fiber production enterprise in China, with its capacity of bamboo staple fiber and bamboo filament yarn reaching48,000 tons/a and 7,000 tons/a respectively in 2012. The company is currently expanding the bamboo pulp and bamboo staple fiber capacity, in order to maintain the dominating position in the bamboo fiber market. The report highlights the followings: Supply & demand, competition pattern and development trends of the global viscose fiber industry; Development course, operation and policies of China viscose fiber industry; Supply & demand, import & export and price trend of China viscose fiber industry; Status quo and competition patterns of Chinese bamboo fiber market segments; Operation, viscose fiber business and development forecast of 13 global and Chinese viscose fiber producers.
第一章 粘胶纤维概述
1.1 定义及特性
1.2 分类及用途
1.3 产业链
第二章 全球粘胶纤维行业分析
2.1 发展历史
2.2 纤维总体发展情况
2.3 产量分析
2.4 竞争格局
2.5 发展趋势
第三章 中国粘胶纤维行业运营情况
3.1 发展历史
3.2 行业运营情况
3.3 政策
第四章 中国粘胶纤维市场分析
4.1 纤维总体发展情况
4.2 产能分析
4.3 产量分析
4.4 进出口分析
4.5 价格分析
4.6 发展及预测
第五章 中国竹浆纤维市场概况
5.1 竹浆纤维介绍
5.2 竹浆纤维优势
5.3 市场概况
第六章 国外重点企业分析
6.1 奥地利兰精
6.1.1 公司介绍
6.1.2 经营情况
6.1.3 纤维部门经营情况
6.1.4 粘胶纤维业务
6.1.5 在华业务
6.1.6 发展情况
6.2 印度博拉集团
6.2.1 公司介绍
6.2.2 Grasim经营情况
6.2.3 Grasim粘胶短纤业务
6.2.4 在华业务
6.3 新加坡赛得利
6.3.1 公司介绍
6.3.2 经营情况
6.3.3 营收构成
6.3.4 毛利率
6.3.5 粘胶短纤业务
6.3.6 在华业务
第七章 中国重点企业分析
7.1 山东海龙
7.1.1 公司介绍
7.1.2 经营情况
7.1.3 营收构成
7.1.4 毛利率
7.1.5 客户
7.1.6 粘胶纤维业务
7.1.7 预测与展望
7.2 澳洋科技
7.2.1 公司介绍
7.2.2 经营情况
7.2.3 营收构成
7.2.4 毛利率
7.2.5 粘胶纤维业务
7.2.6 预测与展望
7.3 新乡化纤
7.3.1 公司简介
7.3.2 经营情况
7.3.3 营收构成
7.3.4 毛利率
7.3.5 客户
7.3.6 粘胶纤维业务
7.3.7 预测与展望
7.4 南京化纤
7.4.1 公司介绍
7.4.2 经营情况
7.4.3 营收构成
7.4.4 毛利率
7.4.5 客户
7.4.6 粘胶纤维业务
7.4.7 预测与展望
7.5 吉林化纤
7.5.1 公司简介
7.5.2 经营情况
7.5.3 营收构成
7.5.4 毛利率
7.5.5 客户
7.5.6 粘胶纤维业务
7.5.7 预测与展望
7.6 保定天鹅
7.6.1 公司介绍
7.6.2 经营情况
7.6.3 营收构成
7.6.4 毛利率
7.6.5 客户
7.6.6 粘胶纤维业务
7.6.7 预测与展望
7.7 三友化工
7.7.1 公司介绍
7.7.2 经营情况
7.7.3 营收构成
7.7.4 毛利率
7.7.5 客户
7.7.6 粘胶纤维业务
7.7.7 预测与展望
7.8 湖北金环
7.8.1 公司介绍
7.8.2 经营情况
7.8.3 营收构成
7.8.4 毛利率
7.8.5 客户
7.8.6 预测与展望
7.9 富丽达股份
7.9.1 公司介绍
7.9.2 经营情况
7.9.3 粘胶纤维业务
7.10 丝丽雅集团
7.10.1 公司介绍
6.13.2 经营情况
6.13.3 粘胶纤维业务
1 Overview of Viscose Fiber
1.1 Definition and Properties
1.2 Classification and Usage
1.3 Industry Chain
2 Global Viscose Fiber Industry
2.1 History
2.2 Overview
2.3 Output
2.4 Competition Pattern
2.5 Development Trends
3 Operation of China Viscose Fiber Industry
3.1 History
3.2 Operation
3.3 Policy
4 China Viscose Fiber Market
4.1 Overview
4.2 Capacity
4.3 Output
4.4 Import and Export
4.5 Price Analysis
4.6 Development and Forecast
5 Chinese Bamboo Fiber Market
5.1 Introduction
5.2 Advantages
5.3 Market
6 Key Foreign Companies
6.1 Lenzing Group
6.1.1 Profile
6.1.2 Operation
6.1.3 Operation of Fiber Division
6.1.4 Viscose Fiber Business
6.1.5 Business in China
6.1.6 Development
6.2 Aditya Birla Group
6.2.1 Profile
6.2.2 GrasimOperation
6.2.3 Grasim Viscose Staple Fiber Business
6.2.4 Business in China
6.3 Sateri
6.3.1 Profile
6.3.2 Operation
6.3.3 Revenue Structure
6.3.4 Gross Margin
6.3.5 Viscose Staple Fiber Business
6.3.6 Business in China
7 Key Enterprises in China
7.1 Shandong Helon
7.1.1 Profile
7.1.2 Operation
7.1.3 Revenue Structure
7.1.4 Gross Margin
7.1.5 Clients
7.1.6 Viscose Fiber Business
7.1.7 Forecast and Outlook
7.2 Aoyang Technology
7.2.1 Profile
7.2.2 Operation
7.2.3 Revenue Structure
7.2.4 Gross Margin
7.2.5 Viscose Fiber Business
7.2.6 Forecast and Outlook
7.3 Xinxiang Chemical Fiber
7.3.1 Profile
7.3.2 Operation
7.3.3 Revenue Structure
7.3.4 Gross Margin
7.3.5 Clients
7.3.6 Viscose Fiber Business
7.3.7 Forecast and Outlook
7.4 Nanjing Chemical Fiber
7.4.1 Profile
7.4.2 Operation
7.4.3 Revenue Structure
7.4.4 Gross Margin
7.4.5 Clients
7.4.6 Viscose Fiber Business
7.4.7 Forecast and Outlook
7.5 Jilin Chemical Fiber
7.5.1 Profile
7.5.2 Operation
7.5.3 Revenue Structure
7.5.4 Gross Margin
7.5.5 Clients
7.5.6 Viscose Fiber Business
7.5.7 Forecast and Outlook
7.6 Baoding Swan
7.6.1 Profile
7.6.2 Operation
7.6.3 Revenue Structure
7.6.4 Gross Margin
7.6.5 Clients
7.6.6 Viscose Fiber Business
7.6.7 Forecast and Outlook
7.7 Sanyou Chemical
7.7.1 Profile
7.7.2 Operation
7.7.3 Revenue Structure
7.7.4 Gross Margin
7.7.5 Clients
7.7.6 Viscose Fiber Business
7.7.7 Forecast and Outlook
7.8 Hubei Golden Ring
7.8.1 Profile
7.8.2 Operation
7.8.3 Revenue Structure
7.8.4 Gross Margin
7.8.5 Clients
7.8.6 Forecast and Outlook
7.9 Fulida Group
7.9.1 Profile
7.9.2 Operation
7.9.3 Viscose Fiber Business
7.10 Grace Group
7.10.1 Profile
6.13.2 Operation
6.13.3 Viscose Fiber Business
图:粘胶纤维产业链
图:2006-2012年全球纤维总产量及增长率
表:2011年全球主要纤维品种产量及其占比
图:2006-2012年全球粘胶纤维产量及增长率
图:2011年全球粘胶纤维产量地区分布
表:2012年全球前十大粘胶纤维生产商及其产能
图:1960-2020E全球不同纤维品种发展情况预测
图:2006-2012年中国纤维素纤维原料及纤维制造业主营业务收入及同比增长率
图:2006-2012年中国纤维素纤维原料及纤维制造业利润总额及同比增长率
表:符合《粘胶纤维行业准入条件》企业名单(第一批)
表:2012年中国主要纤维品种产量及其占比
图:2006-2012年中国化学纤维制造业主营业务收入及同比增长率
表:2012年中国粘胶纤维主要生产厂家及产能
图:2012年中国粘胶短纤主要生产企业及其产能占比
图:2012年中国粘胶长丝主要生产企业及其产能占比
图:2006-2012年中国粘胶纤维产量及同比增长
图:2011-2012年中国粘胶纤维(分产品)产量占比
表:2010年中国粘胶纤维产量地区分布
图:2008-2012年中国粘胶短纤进出口量
图:2008-2012年中国粘胶短纤进出口平均价格
图:2012年中国粘胶短纤出口目的地分布(按出口量)
图:2012年中国粘胶短纤进口来源分布(按进口量)
图:2012年中国主要粘胶短纤出口城市的出口量占比
图:2012年中国主要粘胶短纤进口城市的进口量占比
图:2008-2013年中国粘胶短纤和粘胶长丝市场价格
图:2011-2016年中国粘胶纤维行业供需预测
图:竹浆纤维工艺路线图
表:竹浆纤维和普通粘胶纤维性能比较
图:2008-2012年兰精公司销售收入及EBITDA
图:2010-2012年兰精公司(分部门)销售收入占比
图:2009-2012年兰精公司纤维部门销售收入及EBITDA
表:2011年兰精公司粘胶纤维相关子公司及其产能
图:2008-2011年兰精公司纤维总产量及增长率
图:2009-2011年兰精公司纤维部门纤维业务销售收入占比(分产品)
图:2008-2011年兰精(南京)纤维营业收入及净利润
图:FY2009-FY2013 Grasim净收入及净利润
图:FY2008-FY2012 Grasim粘胶短纤产量、销量及产销率
图:FY2009-FY2013 Grasim粘胶短纤业务净收入及增长率
图:赛得利产品链及产品用途
图:2008-2012年赛得利营业收入和净利润
图:2010-2012年赛得利(分产品)营业收入占比
图:2010-2012年赛得利(分地区)营业收入占比
图:2010-2012年赛得利主营产品毛利率
图:2010-2012年赛得利粘胶短纤产能及产量
图:2010-2012年赛得利粘胶短纤销量及产销率
图:2010-2012年赛得利粘胶短纤及溶解木浆的平均售价
表:2012年山东海龙主营产品产能
图:2008-2012年山东海龙营业收入和净利润
图:2010-2012年山东海龙(分产品)营业收入占比
图:2010-2012年山东海龙(分地区)营业收入占比
图:2009-2012年山东海龙粘胶纤维产品毛利率
表:2011年山东海龙粘胶纤维业务相关子公司情况
图:2008-2012年澳洋科技营业收入和净利润
图:2010-2012年澳洋科技(分产品)营业收入占比
图:2010-2012年澳洋科技(分地区)营业收入占比
图:2008-2012年澳洋科技粘胶短纤毛利率
图:2009-2012年玛纳斯澳洋营业收入及净利润
图:2009-2012年阜宁澳洋营业收入及净利润
图:2009-2012年新澳特纤营业收入及净利润
图:2011-2015年澳洋科技营业收入及净利润预测
图:2009-2012年新乡化纤粘胶纤维产品产量
图:2008-2012年南京化纤营业收入和净利润
图:2010-2012年南京化纤(分产品)营业收入占比
图:2010-2012年南京化纤(分地区)营业收入占比
图:2008-2012年南京化纤粘胶纤维产品毛利率
图:2009-2011年南京化纤粘胶纤维产量
图:2009-2011年南京化纤粘胶纤维销量
表:2011年南京化纤粘胶纤维业务相关子公司及其营业收入和净利润
图:2008-2012年吉林化纤营业收入和净利润
图:2010-2012年吉林化纤(分产品)营业收入占比
图:2010-2012年吉林化纤(分地区)营业收入占比
表:2008-2012年吉林化纤主营产品毛利率
表:2012年吉林化纤主营产品产能
表:2011年南京化纤粘胶纤维业务相关子公司及其经营情况
图:2008-2012年保定天鹅营业收入和净利润
图:2010-2012年保定天鹅(分产品)营业收入占比
图:2010-2012年保定天鹅(分地区)营业收入占比
表:2009-2012年保定天鹅主营产品毛利率
表:2012年保定天鹅主营产品产能
图:2009-2011H1保定天鹅粘胶长丝业务收入结构(分地区)
图:2008-2012年三友化工营业收入和净利润
图:2010-2012年三友化工(分产品)营业收入占比
图:2010-2012年三友化工(分地区)营业收入占比
图:2010-2012年三友化工主营产品毛利率
图:2011年兴达纤维子公司情况
图:2008-2011年兴达化纤营业收入和净利润
表:2012年湖北金环主营产品产能
图:2008-2012年湖北金环营业收入及净利润
图:2010-2012年湖北金环(分产品)营业收入占比
图:2008-2012年湖北金环粘胶纤维相关业务毛利率
图:2009-2010年富丽达股份营业收入和净利润
图:2007-2009年丝丽雅股份主营业务收入和利润总额
表:2011年丝丽雅集团粘胶纤维产能
Viscose Fiber Industry Chain
Global Fiber Output and Growth Rate, 2006-2012
Output of Major Fiber Varieties and Their Proportion in the World, 2011
Global Viscose Fiber Output and Growth Rate, 2006-2012
Global Viscose Fiber Output by Region, 2011
Top 10 Viscose Fiber Producers and Their Capacity in the World, 2012
Development of Global Various Fiber Varieties, 1960-2020E
Revenue and YoY Growth Rate of China Cellulose Fiber Raw Materials and Fiber Manufacturing Industry, 2006-2012
Total Profit and YoY Growth Rate of China Cellulose Fiber Raw Materials and Fiber Manufacturing Industry, 2006-2012
Enterprises Complying with Entry Conditions for Viscose Fiber Industry (First Batch)
Output and Proportion of Major Fiber Varieties in China, 2012
Revenue and YoY Growth Rate of China Chemical Fiber Industry, 2006-2012
Major Viscose Fiber Enterprises and Their Capacity Proportion in China, 2012
Major Viscose Staple Fiber Enterprises and Their Capacity Proportion in China, 2012
Major Viscose Filament Yarn Enterprises and Their Capacity Proportion in China, 2012
Viscose Fiber Output and YoY Growth Rate in China, 2006-2012
Viscose Fiber Output of China by Product, 2011-2012
Viscose Fiber Output of China by Region, 2010
Viscose Staple Fiber Import and Export Volume in China, 2008-2012
Import and Export Average Prices of Viscose Staple Fiber in China, 2008-2012
Export Destinations of Chinese Viscose Staple Fiber (by Export Volume), 2012
Import Sources of Viscose Staple Fiber in China (by Import Volume), 2012
Export Volume of Major Export Destinations of Chinese Viscose Staple Fiber by Proportion, 2012
Import Volume of Import Sources of Viscose Staple Fiber in China, 2012
Market Prices of Viscose Staple Fiber and Viscose Filament Yarn in China, 2008-2013
Supply and Demand in China Viscose Fiber Industry, 2011-2016E
Bamboo Fiber Technology Roadmap
Performance Comparison between Bamboo Fiber and Ordinary Viscose Fiber
Revenue and EBITDA of Lenzing, 2008-2012
Revenue Breakdown of Lenzing (by Division), 2010-2012
Revenue and EBITDA of Lenzing’s Fiber Division, 2009-2012
Viscose Fiber Subsidiaries and Their Capacity of Lenzing, 2011
Fiber Output and Growth Rate of Lenzing, 2008-2011
Revenue of Lenzing’s Fiber Division (by Product), 2009-2011
Revenue and Net Income of Lenzing (Nanjing) Fiber, 2008-2011
Net Revenue and Net Income of Grasim, FY2009-FY2013
Output, Sales Volume and Sales/Output Ratio of Grasim’s Viscose Staple Fiber, FY2008-FY2012
Net Income and Growth Rate of Grasim’s Viscose Staple Fiber Business, FY2009-FY2013
Product Chain and Product Usage of Sateri
Revenue and Net Income of Sateri, 2008-2012
Revenue Breakdown of Sateri (by Product), 2010-2012
Revenue Breakdown of Sateri (by Region), 2010-2012
Gross Margin of Main Products of Sateri, 2010-2012
Capacity and Output of Sateri’s Viscose Staple Fiber, 2010-2012
Sales Volume and Sales/Output Ratio of Sateri’s Viscose Staple Fiber, 2010-2012
Average Selling Prices of Sateri’s Viscose Staple Fiber and Dissolving Wood Pulp, 2010-2012
Capacity of Main Products of Shandong Helon, 2012
Revenue and Net Income of Shandong Helon, 2008-2012
Revenue Breakdown of Shandong Helon (by Product), 2010-2012
Revenue Breakdown of Shandong Helon (by Region), 2010-2012
Viscose Fiber Gross Margin of Shandong Helon, 2009-2012
Viscose Fiber Subsidiaries of Shandong Helon, 2011
Revenue and Net Income of Aoyang Technology, 2008-2012
Revenue Breakdown of Aoyang Technology (by Product), 2010-2012
Revenue Breakdown of Aoyang Technology (by Region), 2010-2012
Viscose Staple Fiber Gross Margin of Aoyang Technology, 2008-2012
Revenue and Net Income of Manas Aoyang, 2009-2012
Revenue and Net Income of Funing Aoyang, 2009-2012
Revenue and Net Income of Xin’Ao Special Fiber, 2009-2012
Revenue and Net Income of Aoyang Technology, 2011-2015E
Viscose Fiber Output of Xinxiang Chemical Fiber, 2009-2012
Revenue and Net Income of Nanjing Chemical Fiber, 2008-2012
Revenue Breakdown of Nanjing Chemical Fiber (by Product), 2010-2012
Revenue Breakdown of Nanjing Chemical Fiber (by Region), 2010-2012
Viscose Fiber Gross Margin of Nanjing Chemical Fiber, 2008-2012
Viscose Fiber Output of Nanjing Chemical Fiber, 2009-2011
Viscose Fiber Sales Volume of Nanjing Chemical Fiber, 2009-2011
Viscose Fiber Subsidiaries and Their Revenue and Net Income of Nanjing Chemical Fiber, 2011
Revenue and Net Income of Jilin Chemical Fiber, 2008-2012
Revenue Breakdown of Jilin Chemical Fiber (by Product), 2010-2012
Revenue Breakdown of Jilin Chemical Fiber (by Region), 2010-2012
Gross Margin of Main Products of Jilin Chemical Fiber, 2008-2012
Capacity of Main Products of Jilin Chemical Fiber, 2012
Viscose Fiber Subsidiaries and Their Operation of Nanjing Chemical Fiber, 2011
Revenue and Net Income of Baoding Swan, 2008-2012
Revenue Breakdown of Baoding Swan (by Product), 2010-2012
Revenue Breakdown of Baoding Swan (by Region), 2010-2012
Gross Margin of Main Products of Baoding Swan, 2009-2012
Capacity of Main Products of Baoding Swan, 2012
Viscose Filament Yarn Revenue of Baoding Swan (by Region), 2009-2011H1
Revenue and Net Income of Sanyou Chemical, 2008-2012
Revenue Breakdown of Sanyou Chemical (by Product), 2010-2012
Revenue Breakdown of Sanyou Chemical (by Region), 2010-2012
Gross Margin of Main Products of Sanyou Chemical, 2010-2012
Subsidiaries of Xingda Chemical Fiber, 2011
Revenue and Net Income of Xingda Chemical Fiber, 2008-2011
Capacity of Main Products of Hubei Golden Ring, 2012
Revenue and Net Income of Hubei Golden Ring, 2008-2012
Revenue Breakdown of Hubei Golden Ring (by Product), 2010-2012
Gross Margin of Viscose Fiber Business of Hubei Golden Ring, 2008-2012
Revenue and Net Income of Fulida, 2009-2010
Revenue and Total Profit of Grace, 2007-2009
Viscose Fiber Capacity of Grace Group, 2011
如果这份报告不能满足您的要求,我们还可以为您定制报告,请 留言说明您的详细需求。
|