|
|
|
报告导航:研究报告—
生命科学—制药医疗
|
|
2012-2015年中国医院行业发展与投资研究报告 |
 |
字数:5.7万 |
页数:120 |
图表数:131 |
|
中文电子版:8500元 |
中文纸版:4250元 |
中文(电子+纸)版:9000元 |
|
英文电子版:2300美元 |
英文纸版:2400美元 |
英文(电子+纸)版:2600美元 |
|
编号:XJT029
|
发布日期:2013-03 |
附件:下载 |
 |
|
|
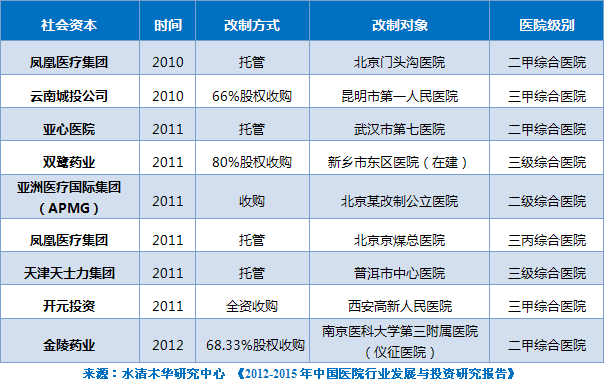
由于市场需求的刺激和国家的稳定投入,近年来中国医院行业一直保持稳定发展。截至2011年底,中国医院总数达到21979所,2005-2011年均增长率为2.7%,其中非公立医院占比增长至39.4%。2011年,中国医院行业总收入达12451亿元,2005-2011年均复合增长率高达19.7%;但毛利率水平较低,2011年仅为3.8%。 近年来,中国政府出台了一系列推动公立医院改革、鼓励和引导社会资本不断进入医院行业的利好政策,中国医院行业投资运作模式进一步成熟。2010年以来,民营资本如凤凰医疗集团、云南城投公司、双鹭药业、开元投资、金陵药业等通过托管、收购等方式大举进入公立医院改制。外资则主要采取合作经营、参股、合资建设经营新医院(外资主导)的方式在华运营,其主要定位于中国高端医疗市场,如美中互利和睦家医院、新加坡百汇医疗等。 表:2010-2012年中国社会资本进入公立医院部分案例
目前中国专科医院市场化趋势较为明确,政策风险相对较低,是社会资本投资重点之一。2011年,中国专科医院数量由2005年的2682所快速增长至4283所,其中民营占比达到59.4%;总收入达到1391亿元,2005-2011收入年均复合增长率为22.2%。专科医院的平均毛利率达到12.1%,其中眼科医院、美容医院毛利率分别达到14.7%、12.8%。2011年,中国经营较为成功的民营专科爱尔眼科、通策医疗、马应龙毛利率分别高达55.3%、47.2%、39.4%。 《2012-2015年中国医院行业发展与投资研究报告》的内容主要包括以下几方面:- 中国医院行业市场概况,包括各类医院数量变化情况、经营情况、医疗服务现状、竞争格局等;
- 中国专科医院发展现状,包括专科医院总体运行情况和眼科、口腔、整形外科、美容、妇产、儿童、肿瘤等专科医院经营现状、发展前景等;
- 中国医院行业发展预测,包括中国医疗保障现状、推进城镇化对中国医疗市场影响以及2015年医疗资源供给与需求预测等;
- 中国医院行业投资分析,包括社会资本进入医院行业相关政策、民营医院与公立医院运营效率对比、专科医院及公立医院投资机会、外资医院在华经营模式选择等。
- 中国4家主要民营专科医院、6家进入医院行业的上市企业、2家外资医院经营现状、投资和并购及发展预测等。
China hospital industry has maintained stable growth in recent years,
thanks to the market demand stimulus and stable influx of national
investment. As of late 2011, China had a total of 21,979 hospitals, with
the AAGR of 2.7% during 2005-2011. In particular, the proportion of
non-public hospitals grew to 39.4%. In 2011, the revenue of China
hospital industry totaled RMB1.2451 trillion, with the CAGR as high as
19.7%, while the gross margin was no more than 3.8%. In recent
years, Chinese government has unveiled a series of favorable policies to
boost the reform of public hospitals, encourage and guide social
capitals to rush into hospital industry. This move resulted in further
maturity of investment operation mode of China hospital industry. Since
2010, privately-owned hospitals including Hong Kong Phoenix
International Investment Group, YMCI, SL PHARM, Xi'an Kaiyuan Investment
Group Company Limited and Jinling Pharmaceutical Company Limited have
been restructured through trusteeship and M&A by public hospitals,
while foreign enterprises have run their business in China via joint
business, joint stock and joint venture, with orientation to Chinese
top-grade medical market. Cases in point include United Family Hospital
and ParkwayHealth. Cases of Social Capital Flowing to Public Hospitals, 2010-2012
At
present, the specialized hospitals in China are much favored in the
marketization trend and little exposed to policy risk, thus, they are
one of highlights when it comes to social capital investment. In 2011,
the number of specialized hospitals in China surged from 2,682 in 2005
to 4,283, among which privately-owned ones accounting for 59.4%. And the
revenue generated by the specialized hospitals amounted to
RMB139.1bilion, with the CAGR in 2005-2011 reached 22.2% while the
average gross margin realized 12.1%. In particular, the gross margin
generated by ophthalmic hospitals and Cosmetic hospitals claimed 14.7%
and 12.8%, respectively. In 2011, the gross margin of Aier Eye Hospital
Group, TC Medical, and Mayinglong Pharm, the leading privately-run
specialized hospitals in China, reported 55.3%, 47.2% and 39.4%,
respectively. The report highlights the followings: 
China hospital industry market overview: number of hospitals of all
sorts, operation, status quo of medical service, competition pattern,
etc.
current development of specialized hospitals in China: overall
operation, operation of ophthalmic hospitals, stomatological hospitals,
plastic surgery hospitals, beauty hospitals, maternity hospitals,
Children’s hospitals, and tumour hospitals as well as their development
outlook;
development prediction of China hospital industry: status quo of China
medical security, boosting urbanization’s influence on China healthcare
market, supply and demand of medical resources in 2015;
investment in China hospital industry: related polices on social
capital flowing into the hospital industry, operational efficiency
comparison between privately-owned hospitals and public ones;
present operation, investment, mergers and development prediction of
four major privately-owned specialized hospitals in China, six listed
companies that have accessed into the hospital industry, and two foreign
hospitals.
第一章 中国医院行业概述
1.1 定义
1.2 分类
1.3 产业链
第二章 中国医院行业市场概况
2.1 医院数量
2.1.1 医院数量稳步增长
2.1.2 民营医院增长速度较快
2.1.3 医院分布地域差异显著
2.2 营业收入
2.2.1 营业总收入快速增长
2.2.2 综合医院收入占比最大
2.2.3 综合医院药品收入占比缓慢下降
2.3 利润水平
2.3.1 平均毛利率维持在较低水平
2.3.2 综合医院毛利率最低
2.4 医疗服务
2.4.1 医疗资源使用状况紧张
2.4.2 医疗人员不足影响行业增长
2.5 竞争格局
第三章 中国专科医院发展现状
3.1 专科医院运行情况
3.1.1 非公立专科医院比例明显增加
3.1.2 专科医院收入呈快速增长趋势
3.1.3 专科医院毛利率较上年明显增长
3.2 各类专科医院现状
3.2.1 眼科医院
3.2.2 口腔医院
3.2.3 整形外科和美容医院
3.2.4 妇产医院
3.2.5 儿童医院
3.2.6 肿瘤医院
第四章 中国医院行业发展预测分析
4.1 中国医疗保障现状
4.1.1 医保体系
4.1.2 医保覆盖率接近饱和
4.1.3 城乡居民大病医保
4.2 城镇化推动医院行业发展
4.2.1 中国城镇化现状
4.2.2 城镇化将优化医疗保健体系
4.2.3 异地医保结算有望率先实现
4.2.4 城镇化通过医疗保障体系贡献增量
4.2.5 医保基金结余率有望进一步降低
4.2.6 县医院医疗资源供给能力将提升
4.2.7 城镇化将推动政府投资城市医疗资源
第五章 中国医院行业投资分析
5.1 政策环境转暖
5.2 民营医院竞争优势
5.2.1 公立医院规模效应有限
5.2.2 民营医院运营效率较高
5.3 社会资本投资机会
5.3.1 专科医疗领域
5.3.2 综合性公立医院
5.4 外资医院发展方向及经营模式
5.4.1 外资医院在华现状
5.4.2 外资医院发展方向
5.4.3 外资医院经营方式
第六章 中国民营医院主要企业
6.1 爱尔眼科
6.1.1 企业简介
6.1.2 经营情况
6.1.3 营收构成分析
6.1.4 毛利率分析
6.1.5 医疗业务分析
6.1.6 预测与展望
6.2 通策医疗
6.2.1 企业简介
6.2.2 经营情况
6.2.3 营收构成分析
6.2.4 毛利率分析
6.2.5 医疗业务分析
6.2.6 预测与展望
6.3 马应龙
6.3.1 企业简介
6.3.2 经营情况
6.3.3 营收构成分析
6.3.4 毛利率分析
6.3.5 医疗业务分析
6.3.6 预测与展望
6.4 复星医药
6.4.1 企业简介
6.4.2 经营情况
6.4.3 营收构成分析
6.4.4 毛利率分析
6.4.5 研发和投资分析
6.4.6 医疗业务分析
6.4.7 预测与展望
6.5 金陵药业
6.5.1 企业简介
6.5.2 经营情况
6.5.3 营收构成分析
6.5.4 毛利率分析
6.5.5 医疗业务分析
6.5.6 预测与展望
6.6 新华医疗
6.6.1 企业简介
6.6.2 经营情况
6.6.3 营收构成分析
6.6.4 毛利率分析
6.6.5 医疗业务分析
6.6.6 预测与展望
6.7 开元投资
6.7.1 企业简介
6.7.2 经营情况
6.7.3 营收构成分析
6.7.4 毛利率分析
6.7.5 医疗业务分析
6.7.6 预测与展望
6.8 福瑞股份
6.8.1 企业简介
6.8.2 经营情况
6.8.3 营收构成分析
6.8.4 毛利率分析
6.8.5 医疗业务分析
6.8.6 预测与展望
6.9 武汉健民
6.9.1 企业简介
6.9.2 经营情况
6.9.3 营收构成分析
6.9.4 毛利率分析
6.9.5 医疗业务分析
6.9.6 预测与展望
6.10 泰和城
6.10.1 企业简介
6.10.2 经营情况
6.10.3 毛利率分析
6.10.4 医疗业务分析
6.11 和睦家
6.11.1 企业简介
6.11.2 经营情况
6.11.3 医疗业务分析
6.12 百汇医疗
6.12.1 企业简介
6.12.2 经营情况
6.12.3 医疗业务分析
1. Overview of China Hospital Industry
1.1 Definition
1.2 Classification
1.3 Industry Chain
2. Overview of China Hospital Market
2.1 Hospital Quantities
2.1.1 Number of Hospitals Grows Steadily
2.1.2 Privately-Owned Hospitals Show Faster Growth Rate
2.1.3 Distinct Difference in Regional Distribution of Hospitals
2.2 Revenue
2.2.1 Total Revenue Surges Rapidly
2.2.2 Revenue of General Hospitals Occupies A Lion’s Share
2.2.3 Proportion of Revenue from Medicine of General Hospitals On A Slow Decline
2.3 Profit Level
2.3.1 Average Gross Margin Maintains a Low Level
2.3.2 Gross Margin of General Hospitals Records the Lowest
2.4 Medical Service
2.4.1 Short Supply of Medical Resources
2.4.2 Medical Personal Inadequacy Impacts the Development of Hospital Industry
2.5 Competition Pattern
3. Current Development of Specialized Hospitals in China
3.1 Operation
3.1.1 Proportion of Non-Public Specialized Hospitals Witnesses Steep Increase
3.1.2 Revenue Generated by Specialized Hospitals Sees Rapid Growth
3.1.3 Gross Margin of Specialized Hospitals Presents Sharp Rise against Last Year
3.2 Status Quo of Specialized Hospitals of All Kinds
3.2.1 Ophthalmic Hospital
3.2.2 Stomatological Hospital
3.2.3 Plastic Surgery & Cosmetic Hospital
3.2.4 Maternity Hospital
3.2.5 Children’s Hospital
3.2.6 Tumour Hospital
4. Development Forecast of China Hospital Industry
4.1 Status Quo of China Medical Insurance
4.1.1 Medical Insurance System
4.1.2 Medical Insurance Nearly Realizes 100% Coverage
4.1.3 Medical Insurance for Serious Illness of Urban and Rural Residents
4.2 Urbanization Bolsters Development of the Hospital Industry
4.2.1 Status Quo of Urbanization in China
4.2.2 Urbanization Expects to Optimize Medical Insurance System
4.2.3 Trans-regional Medical Insurance Settlement Is Expected to Realize Initiatively
4.2.4 Urbanization Incrementation Depends on the Contribution of Medical Insurance System
4.2.5 Medical Insurance Fund Balance Rate Will See Further Decrease
4.2.6 Medical Resource Supply of County-Level Hospitals Will Improve
4.2.7 Urbanization Will Encourage Central Government to Invest in Urban Medical Resources
5. Investment in China Hospital Industry
5.1 Policy Environment Becomes Warm
5.2 Competitiveness of Privately-Owned Hospitals
5.2.1 Limited Size Effect of Public Hospitals
5.2.2 Privately-Owned Hospitals See Higher Efficiency of Operation
5.3 Investment Opportunities of Social Capital
5.3.1 Specialized Medical Field
5.3.2 General Public Hospitals
5.4 Development Direction and Operation Mode of Foreign Hospitals
5.4.1 Status Quo of Foreign Hospitals in China
5.4.2 Development Direction of Foreign Hospitals
5.4.3 Operation Mode of Foreign Hospitals
6. Major Privately-Owned Hospitals in China
6.1 Aier Eye Hospital Group
6.1.1 Profile
6.1.2 Operation
6.1.3 Revenue Structure
6.1.4 Gross Margin
6.1.5 Medical Business
6.1.6 Prediction and Outlook
6.2 TC Medical
6.2.1 Profile
6.2.2 Operation
6.2.3 Revenue Structure
6.2.4 Gross Margin
6.2.5 Medical Business
6.2.6 Prediction and Outlook
6.3 Mayinglong Pharm
6.3.1 Profile
6.3.2 Operation
6.3.3 Revenue Structure
6.3.4 Gross Margin
6.3.5 Medical Business
6.3.6 Prediction and Outlook
6.4 Shanghai Fosun Pharmaceutical (Group)
6.4.1 Profile
6.4.2 Operation
6.4.3 Revenue Structure
6.4.4 Gross Margin
6.4.5 R&D and Investment
6.4.6 Medical Business
6.4.7 Prediction and Outlook
6.5 Jinling Pharmaceutical Company Limited
6.5.1 Profile
6.5.2 Operation
6.5.3 Revenue Structure
6.5.4 Gross Margin
6.5.5 Medical Business
6.5.6 Prediction and Outlook
6.6 Shinva Medical
6.6.1 Profile
6.6.2 Operation
6.6.3 Revenue Structure
6.6.4 Gross Margin
6.6.5 Medical Business
6.6.6 Prediction and Outlook
6.7 Xi'an Kaiyuan Investment Group Company Limited
6.7.1 Profile
6.7.2 Operation
6.7.3 Revenue Structure
6.7.4 Gross Margin
6.7.5 Medical Business
6.7.6 Prediction and Outlook
6.8 Inner Mongolia Free Han & Mongolia Pharmaceutical Co.,Ltd.
6.8.1 Profile
6.8.2 Operation
6.8.3 Revenue Structure
6.8.4 Gross Margin
6.8.5 Medical Business
6.8.6 Prediction and Outlook
6.9 Wuhan Jianmin Pharmaceutical Groups Corp. Ltd
6.9.1 Profile
6.9.2 Operation
6.9.3 Revenue Structure
6.9.4 Gross Margin
6.9.5 Medical Business
6.9.6 Prediction and Outlook
6.10 CMS Holdings Ltd.
6.10.1 Profile
6.10.2 Operation
6.10.3 Gross Margin
6.10.4 Medical Business
6.11 United Family Hospital
6.11.1 Profile
6.11.2 Operation
6.11.3 Medical Business
6.12 ParkwayHealth
6.12.1 Profile
6.12.2 Operation
6.12.3 Medical Business
表:中国医院类型及简介
图:中国医院行业产业链
图:2005-2011年中国医院数量
图:2006-2011年中国医院数量(按等级)
图:2006-2011年中国医院数量(按经济类型)
图:2006-2011年中国医院数量(按管理类别)
表:2006-2011年中国医院数量(按机构类别)
表:2011年中国各地区医院数量
图:2005-2011年中国医院行业总收入
图:2011年中国医院总收入构成(按收入来源)
图:2011年中国医院行业总收入构成(按机构类别)
图:2005-2011年中国平均每所综合医院总收入
图:2005-2011年中国平均每所综合医院业务收入(分业务)
图:2005-2011年中国平均每所综合医院药品净收入及药品加价率
图:2005-2011年中国医院平均毛利率
图:2011年中国医院平均毛利率(按机构类别)
图:2005-2011年中国医院诊疗人次
图:2005-2011年中国医院病床数
图:2005-2011年中国医院病床使用率
图:2005-2011年中国医院执业医师和注册护士数量
图:2005-2011年中国医科毕业人数
图:2011年中国各医疗领域公立和非公立医院比例
图:2005-2011年中国专科医院数量
图:2005-2011年中国专科医院数量结构(按经济类型)
表:2010-2011年中国各类专科医院数量
图:2005-2011年中国专科医院总收入
表:2010-2011年中国各类专科医院总收入
图:2011年中国各类专科医院毛利率
图:2006-2011年中国眼科医院数量
表:2006-2011年中国眼科专科医院收入和利润
表:2006-2011年中国眼科专科医院病床使用率和医师服务效率情况
图:2006-2011年中国口腔医院数量
表:2006-2011年中国口腔专科医院收入和利润
表:2006-2011年中国口腔专科医院病床使用率和医师服务效率情况
表:通策医疗、佳美口腔、瑞尔齿科竞争对比
图:2006-2011年中国整形外科和美容医院数量
表:2006-2011年中国整形外科和美容专科医院收入和利润
图:2006-2011年中国妇产医院数量
表:2006-2011年中国妇产专科医院收入和利润
表:2006-2011年中国妇产专科医院病床使用率和医师服务效率情况
图:2006-2011年中国儿童医院数量
表:2006-2011年中国儿童专科医院收入和利润
表:2006-2011年中国儿童专科医院病床使用率和医师服务效率情况
图:2006-2011年中国肿瘤医院数量
表:2006-2011年中国肿瘤专科医院收入和利润
表:2006-2011年中国肿瘤专科医院病床使用率和医师服务效率情况
表:中国医保体系构成
图:2005-2011年中国医保覆盖人口情况
图:2005-2011年中国医保总覆盖率
图:2009-2011年中国三种医疗保险人均支出
图:2000-2011年中国城镇化率
图:2005-2011年中国医疗保健支出构成
图:2005-2011年中国城镇职工基本保险及新农合人均筹资状况
图:2005-2011年中国城镇职工医保与新农合基金结余率
表:2009-2012年县级医院建设扶持政策
图:2015年深度城镇化对医疗服务影响
表:1985-2012年中国社会资本进入医疗服务领域里程碑事件
表:2009-2012年中国社会资本进入医疗服务领域的相关政策
表:民营医院与公立医院政策方面差别
图:中国公立医院委托代理链
表:2012年民营医院与公立医院人均治疗费用
表:2011年苏北三县及神木县医疗基本情况
表:主要医疗服务专科项目比较
表:中国医疗服务体系市场化趋势
表:公立医院既有产权制度改革模式
表:1999-2012年中国社会资本试水公立医院改制部分案例
表:中国部分中外合作经营医院合作方及主要医疗服务
表:中国部分外资主导合资医院合作方及主要服务
图:2008-2012年爱尔眼科营业收入及净利润
表:2008-2012年爱尔眼科(分产品)营业收入
表:2008-2012年爱尔眼科(分地区)营业收入
表:2008-2012年爱尔眼科毛利率(分产品)
表:2011-2015年爱尔眼科营业收入和净利润
图:2008-2012年通策医疗营业收入及净利润
图:2008-2012年通策医疗(分产品)营业收入
图:2008-2012年通策医疗(分地区)营业收入
表:2008-2012年通策医疗毛利率(分产品)
图:通策医疗客户定位
表:2011年通策医疗各子公司现状
表:2011-2015年通策医疗营业收入和净利润
图:2008-2012年马应龙营业收入及净利润
表:2008-2012年马应龙(分产品)营业收入
表:2008-2012年马应龙(分地区)营业收入
表:2008-2012年马应龙毛利率(分产品)
图:马应龙肛肠连锁医院发展历史
表:马应龙旗下肛肠医院建立方式及股权占比
表:2011年马应龙旗下肛肠医院净利润
表:马应龙肛肠专科医院与爱尔眼科和通策医疗对比
表:2011-2015年马应龙营业收入和净利润
图:2008-2012年复星医药营业收入及净利润
图:2008-2012年复星医药(分产品)营业收入
图:2008-2012年复星医药(分地区)营业收入
表:2008-2011年复星医药毛利率(分产品)
图:2008-2012年复星医药研发支出及占营业收入比例
图:2012年和睦家已布局地区及预计布局地区
表:2011-2014年复星医药营业收入和净利润
图:2008-2012年金陵药业营业收入及净利润
表:2008-2012年金陵药业(分产品)营业收入
表:2008-2012年金陵药业(分地区)营业收入
表:2008-2012年金陵药业毛利率(分产品)
表:2011-2015年金陵药业营业收入和净利润
图:2008-2012年新华医疗营业收入及净利润
图:2008-2012年新华医疗(分产品)营业收入
图:2008-2012年新华医疗(分地区)营业收入
表:2008-2012年新华医疗毛利率(分产品)
表:2011-2014年新华医疗营业收入和净利润
图:2008-2012年开元投资营业收入及净利润
表:2008-2012年开元投资(分行业)营业收入
表:2008-2012年开元投资(分地区)营业收入
表:2008-2012年开元投资毛利率(分产品)
表:2011-2015年开元投资营业收入和净利润
图:2008-2012年福瑞股份营业收入及净利润
表:2010-2012年福瑞股份(分产品)营业收入
表:2009-2012年福瑞股份(分地区)营业收入
表:2008-2012年福瑞股份毛利率(分产品)
表:福瑞股份连锁医院投入资金及运营时间
表:2011-2015年福瑞股份营业收入和净利润
图:2008-2012年武汉健民营业收入及净利润
表:2008-2012年武汉健民(分产品)营业收入
表:2008-2012年武汉健民(分地区)营业收入
表:2008-2012年武汉健民毛利率(分产品)
表:2011-2015年武汉健民营业收入和净利润
图:2008-2012年泰和城营业收入及净利润
图:2008-2012年泰和城毛利率(分产品)
图:2012年泰和城服务网络覆盖地区
图:2008-2012年和睦家医院营业收入
表:2013年和睦家医院、诊所数(按地区)
图:2006-2010年百汇医疗营业收入
图:2006-2009年百汇医疗在华营业收入
图:2006-2009年百汇医疗在华总资产
表:百汇医疗在华医疗中心及服务
Types and Brief Introduction of Hospitals in China
China Hospital Industry Chain
Number of Hospitals in China, 2005-2011
Number of Hospitals in China by Level, 2006-2011
Number of Hospitals in China by Economic Type, 2006-2011
Number of Hospitals in China by Management Mode, 2006-2011
Number of Hospitals in China by Institution Nature, 2006-2011
Number of Hospitals in China by Region, 2011
Total Revenue of China Hospital Industry, 2005-2011
Revenue Structure in China Hospital Industry by Source of Revenue, 2011
Structure of Total Revenue of China Hospital Industry by Institution Nature, 2011
Average Total Revenue of Each General Hospital in China, 2005-2011
Average Revenue of Each General Hospital in China by Business, 2005-2011
Average Net Income from Drugs of Each General Hospital in China and Makeup Percentage of Drugs, 2005-2011
Average Gross Margin of China’s Hospitals, 2005-2011
Average Gross Margin of China’s Hospitals by Institution Nature, 2011
Outpatient Visits of China’s Hospitals, 2005-2011
Number of Hospital Beds of China’s Hospitals, 2005-2011
Utilization of Beds in China’s Hospitals, 2005-2011
Number of Certified Doctors and Registered Nurses of China’s Hospitals, 2005-2011
Number of Medical Graduates of China’s Hospitals, 2005-2011
Proportion of Public and Non-Public Hospitals in Various Medical Fields of China, 2011
Number of Specialized Hospitals in China, 2005-2011
Number of Specialized Hospitals in China by Economic Type, 2005-2011
Number of Specialized Hospitals in China by Classification, 2010-2011
Total Revenue of Specialized Hospitals in China, 2005-2011
Total Revenue of Specialized Hospitals in China by Classification, 2010-2011
Gross Margin of Specialized Hospitals in China by Classification, 2011
Number of Ophthalmic Hospitals in China, 2006-2011
Revenue and Profit of Ophthalmic Hospitals in China, 2006-2011
Utilization of Hospital Beds and Service Efficiency of Doctors of China’s Ophthalmic Hospitals, 2006-2011
Number of Stomatological Hospitals in China, 2006-2011
Revenue and Profit of Stomatological Hospitals in China, 2006-2011
Utilization of Hospital Beds and Service Efficiency of Doctors of China’s Stomatological Hospitals, 2006-2011
Competition Comparison: TC Medical vs. Jiamei Stomatological vs. ARRAIL Dental
Number of Plastic Surgery and Cosmetic Hospitals in China, 2006-2011
Revenue and Profit of Plastic Surgery and Cosmetic Hospitals in China, 2006-2011
Number of Maternity Hospitals in China, 2006-2011
Revenue and Profit of Maternity Hospitals in China, 2006-2011
Utilization of Hospital Beds and Service Efficiency of Doctors of China’s Maternity Hospitals, 2006-2011
Number of Children’s Hospitals in China, 2006-2011
Revenue and Profit of Children’s Hospitals in China, 2006-2011
Utilization of Hospital Beds and Service Efficiency of Doctors of China’s Children’s Hospitals, 2006-2011
Number of Tumour Hospitals in China, 2006-2011
Revenue and Profit of Tumour Hospitals in China, 2006-2011
Utilization of Hospital Beds and Service Efficiency of Doctors of China’s Tumour Hospitals, 2006-2011
Composition of China Medical Insurance System
Population Coverage of Medical Insurance System in China, 2005-2011
Coverage of China Medical Insurance System, 2005-2011
Per Capita Expenditure of Three Kinds of Medical Insurances in China, 2009-2011
Urbanization Rate of China, 2000-2011
Healthcare Expenditure Structure of China, 2005-2011
Basic Insurances of China’s Urban Workers and Average Per Capita Fundraising of New Rural Cooperative Medical System, 2005-2011
Medical Insurances of China’s Urban Workers and Balance Rate of New Rural Cooperative Medical System, 2005-2011
Favorable Polices on the Construction of County-Level Hospitals, 2009-2012
Influence of In-Depth Urbanization to Medical Service, 2015
Landmark Cases on Social Capitals Flowing to Medical Service Field in China, 1985-2012
Policies Regarding Social Capitals Flowing to Medical Service Field in China, 2009-2012
Policy Differences between Privately-owned Hospitals and Public Hospitals
Entrustment Chain of Public Hospitals in China
Average Per Capita Treatment Expenditure of Privately-owned Hospitals and Public Hospitals, 2012
Brief Introduction to Medical Treatment in Northern Suzhou and Shenmu County, 2011
Major Specialized Medical Services
Marketization Trend of China Medical Service System
Reform Mode of Established Property Rights System of Public Hospitals
Pilot Cases of China’s Social Capitals Contributing to Public Hospital Restructuring, 1999-2012
Partners and Major Medical Treatment Services of Sino-Foreign Joint Ventures in China Hospital Industry
Partners and Major Services of Sino-Foreign Joint Ventures in China Hospital Industry
Revenue and Net Income of Aier Eye Hospital Group, 2008-2012
Revenue of Aier Eye Hospital Group by Product, 2008-2012
Revenue of Aier Eye Hospital Group by Region, 2008-2012
Gross Margin of Aier Eye Hospital Group by Product, 2008-2012
Revenue and Net Income of Aier Eye Hospital Group, 2011-2015E
Revenue and Net Income of TC Medical, 2008-2012
Revenue of TC Medical by Product, 2008-2012
Revenue of TC Medical by Region, 2008-2012
Gross Margin of TC Medical by Product, 2008-2012
Client Orientation of TC Medical
Status Quo of Subsidiaries under TC Medical
Revenue and Net Income of TC Medical, 2011-2015E
Revenue and Net Income of Mayinglong Pharm, 2008-2012
Revenue of Mayinglong Pharm by Product, 2008-2012
Revenue of Mayinglong Pharm by Region, 2008-2012
Gross Margin of Mayinglong Pharm by Product, 2008-2012
Development History of Mayinglong Pharm Anorectum Chain Hospitals
Establishment Mode and Equity Structure of Anorectum Hospitals under Mayinglong Pharm
Net Income of Anorectum Hospitals under Mayinglong Pharm, 2011
Comparison: Anorectum Hospitals under Mayinglong Pharm vs. Aier Eye Hospital Group vs. TC Medical
Revenue and Net Income of Mayinglong Pharm, 2011-2015
Revenue and Net Income of Shanghai Fosun Pharmaceutical (Group), 2008-2012
Revenue of Shanghai Fosun Pharmaceutical (Group)by Product, 2008-2012
Revenue of Shanghai Fosun Pharmaceutical (Group)by Region, 2008-2012
Gross Margin of Shanghai Fosun Pharmaceutical (Group) by Product, 2008-2011
R&D Costs and % of Total Revenue of Shanghai Fosun Pharmaceutical (Group), 2008-2012
Established Regions and Expected Expansion of United Family Hospital, 2012
Revenue and Net Income of Shanghai Fosun Pharmaceutical (Group), 2011-2014
Revenue and Net Income of Jinling Pharmaceutical Company Limited, 2008-2012
Revenue of Jinling Pharmaceutical Company Limited by Product, 2008-2012
Revenue of Jinling Pharmaceutical Company Limited by Region, 2008-2012
Gross Margin of Jinling Pharmaceutical Company Limited by Product, 2008-2012
Revenue and Net Income of Jinling Pharmaceutical Company Limited, 2011-2015E
Revenue and Net Income of Shinva Medical, 2008-2012
Revenue of Shinva Medical by Product, 2008-2012
Revenue of Shinva Medical by Region, 2008-2012
Gross Margin of Shinva Medical by Product, 2008-2012
Revenue and Net Income of Shinva Medical, 2011-2014E
Revenue and Net Income of Xi'an Kaiyuan Investment Group Company Limited, 2008-2012
Revenue of Xi'an Kaiyuan Investment Group Company Limited by Sector, 2008-2012
Revenue of Xi'an Kaiyuan Investment Group Company Limited by Region, 2008-2012
Gross Margin of Xi'an Kaiyuan Investment Group Company Limited by Product, 2008-2012
Revenue and Net Income of Xi'an Kaiyuan Investment Group Company Limited, 2011-2015
Revenue and Net Income of Inner Mongolia Free Han & Mongolia Pharmaceutical Co.,Ltd., 2008-2012
Revenue of Inner Mongolia Free Han & Mongolia Pharmaceutical Co.,Ltd.by Product, 2010-2012
Revenue of Inner Mongolia Free Han & Mongolia Pharmaceutical Co.,Ltd.by Region, 2009-2012
Gross Margin of Inner Mongolia Free Han & Mongolia Pharmaceutical Co.,Ltd. by Product, 2008-2012
Investment and Operation Date of Inner Mongolia Free Han & Mongolia Pharmaceutical’s Chain Hospitals
Revenue and Net Income of Inner Mongolia Free Han & Mongolia Pharmaceutical Co.,Ltd., 2011-2015E
Revenue and Net Income of Wuhan Jianmin Pharmaceutical Groups Corp. Ltd, 2008-2012
Revenue of Wuhan Jianmin Pharmaceutical Groups Corp. Ltd by Product, 2008-2012
Revenue of Wuhan Jianmin Pharmaceutical Groups Corp. Ltd by Region, 2008-2012
Gross Margin of Wuhan Jianmin Pharmaceutical Groups Corp. Ltd by Product, 2008-2012
Revenue and Net Income of Wuhan Jianmin Pharmaceutical Groups Corp. Ltd, 2011-2015E
Revenue and Net Income of CMS, 2008-2012
Gross Margin of CMS by Product, 2008-2012
Service Network Coverage Regions of CMS, 2012
Revenue of United Family Hospital, 2008-2012
Number of United Family Hospital’s Outlets by Region, 2013
Revenue of ParkwayHealth, 2006-2010
Revenue of ParkwayHealth in China, 2006-2010
Total Assets of ParkwayHealth in China, 2006-2009
Medical Treatment Centers and Services of ParkwayHealth in China
如果这份报告不能满足您的要求,我们还可以为您定制报告,请 留言说明您的详细需求。
|