|
|
|
报告导航:研究报告—
TMT产业—电子半导体
|
|
2012-2013年全球及中国CMOS相机模组行业研究报告 |
 |
字数:3.1万 |
页数:170 |
图表数:158 |
|
中文电子版:9000元 |
中文纸版:4500元 |
中文(电子+纸)版:9500元 |
|
英文电子版:2700美元 |
英文纸版:2800美元 |
英文(电子+纸)版:3000美元 |
|
编号:ZYW143
|
发布日期:2013-03 |
附件:下载 |
 |
|
|
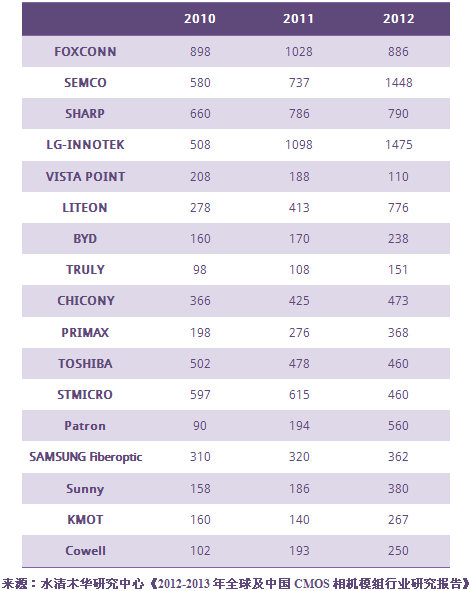
2012-2013年全球及中国CMOS相机模组行业研究报告包括以下内容:1、 Image Sensor图像传感器、Optical Lens光学镜头、Camera Module相机模组行业格局 2、CMOS相机模组下游市场 3、7家Image Sensor图像传感器厂家研究 4、16家Optical Lens光学镜头厂家研究 5、12家Camera Module相机模组厂家研究 6、4家AFA厂家研究 CMOS相机模组产业链相当复杂,主要环节包括传感器、光学镜头、AFA、过滤片和模组(CMOS Sensor、Optical Lens、AFA、Filter、Module)5个环节。2012年每个环节所占的市场规模比例为:传感器占大约52%,光学镜头占大约19%,AFA占大约6%,过滤片占大约3%,模组占大约20%。 2012年CMOS相机模组行业市场规模大约108亿美元,比2011增长24.1%。智能手机照相像素大幅度提高是推动市场发展的主要动力,这种动力延续到2013年。2013年主流智能手机照相像素将从5MP提高到8MP,高端智能手机将进一步提高到13MP。 2013年所有智能手机都将配备AFA,同时高端智能手机将增加OIS(光学防抖)功能,这种功能在数码相机上已经普及,但是手机领域还相当罕见,预计2013年会有大幅度增长。OIS的出现使得手机的拍照性能进一步提高,视频拍摄性能提高幅度更大。手机要实现OIS,需要添加一个陀螺仪Gyrscope(主要供应商是Invensense),和一个OIS驱动IC(供应商通常是三洋或者ROHM)。13MP和OIS是推动2013年手机相机模组市场增长的主要动力,预计2013年CMOS相机模组市场规模达到133亿美元,比2012年增加23.1%。 Image Sensor图像传感器领域,Omnivision在2012年下半年奋起直追,降低价格拉动销售,出货量大幅度增长50%,险守非数码相机领域CMOS Image Sensor霸主位置,三星电子与索尼紧追在后。尤其是索尼最早进军13MP领域,市场占有率超过70%。中国的 格科微(Galaxy Core)依靠SMIC几乎垄断中国中低端市场,2012年出货量超过6亿单元。 随着手机相机像素的大幅度提升,光学镜头厂家开始出现两极分化。技术优秀且主攻高端市场的厂家市场份额快速扩大,技术落后且主攻中低端市场的厂家市场份额无法取得增长。800万像素的技术门槛已经很高,而1300万像素的技术门槛更高,虽然很多厂家能够生产1300万像素的光学镜头,关键是良率Yield Rate不够。良率达到90%以上才能保持足够盈利,技术优秀的厂家可以享受到高利润率,最佳例子就是大立光。大立光的毛利率从未低于40%,高端产品超过50%,而大部分厂家只有10-15%左右的毛利率,技术落后的厂家只有5%。于是很多厂家放弃了高端市场。 排在第二梯队的厂家有Fujinon、KMOT和Digital Optics。Fujinon重心在利润更丰厚的专业级摄像机镜头和DC用镜头,对手机领域兴趣很小,因此其收入逐年下滑。KMOT也有DC用镜头业务,还有DVD的OPU业务,但是对手机领域很有兴趣,业务飞速增长,KMOT可能会挑战大立光的地位。Digital Optics是韩国厂家,成长很快,主要业务集中于高端市场。 相机模组领域,LG-INNOTEK依靠大客户苹果拉动,收入大幅度增加。SEMCO依靠三星手机强力驱动,收入几乎增长100%,与LG-INNOTEK收入几乎相差无几。大陆厂家Sunny Optical受益于Huawei、ZTE手机出货量大增而收入翻番。增长最快的是韩国厂家Patron,首次进入三星供应链 ,增幅高达189%。垂头丧气的厂家有富士康,遭遇舜宇之类的专业厂家抢夺订单,市场占有率下降,同时其大客户Nokia出货量锐减也拖累其收入。和富士康同样遭遇的还有STMicroelectronics。 2010-2012年全球主要CMOS相机模组厂家收入(单位:百万美元)
Global and China CMOS Camera Module Industry Report, 2012-2013 mainly covers the followings: 1. Image sensor / optical lens / camera module industry pattern; 2. CMOS camera module downstream market; 3. 7 image sensor companies; 4. 16 optical lens companies; 5. 12 camera module vendors; 6. 4 AFA companies The
CMOS camera module industry chain is quite complex, with key links
covering CMOS sensor, optical lens, AFA, filter and module, which
accounted for about 52%, 19%, 6%, 3% and 20% of the market size in 2012,
respectively. The CMOS camera module industry market size in
2012 was approximately US$10.8 billion, an increase of 24.1% over 2011,
mainly driven by the great improvement in smartphone camera pixels,
which extended into 2013, whereupon the mainstream smartphone camera
pixels will be raised from 5MP to 8MP, and the high-end smartphone as
high as 13MP. In 2013, all smartphones will be equipped with
AFA, and high-end ones given with the OIS (optical image stabilisation)
function, which has been popular in digital cameras but fairly rare in
mobile phones, and will see significant growth. The emergence of OIS not
only promotes the function of mobile phone photography further, but
also improves the video shooting function to a greater extent. To
achieve this, a gyroscope (Invensense as the main supplier) and an OIS
driver IC (SANYO or ROHM as the main supplier) are of the essence. 13MP
and OIS constitute the main driving force for the mobile phone camera
module market growth. It is expected that in 2013 CMOS camera module
market size will climb 23.1% over 2012 to US$13.3 billion. In
the field of image sensor, Omnivision did all it could do to catch up
from the second half of 2012 by lowering prices to stimulate sales. The
consequent substantial growth of 50% in shipment narrowly kept its
dominant position in the field of non-digital camera CMOS image sensor,
followed closely by Samsung Electronics and Sony, especially Sony, the
first to enter 13MP field and with more than 70% market share. China’s
Galaxy Core relying on SMIC almost monopolizes the domestic low- and
medium-end market, with shipment in 2012 exceeding 600 million units. With
the dramatic advancements in mobile phone camera pixels, optical lens
companies have shown signs of polarization. Technically-excellent
companies focusing on the high-end market are getting swelling market
share, while technically laggard peers targeting the low- and medium-end
market cannot make any progress. The 8-megapixel technical threshold
has been already high, not to mention the 13-megapixel, although many
companies are able to produce 13-megapixel optical lens, the key is the
low yield rate, only going beyond 90% can the high profit margins be
guaranteed. The best example is Largan Precision Co., Ltd. whose gross
margin has never been less than 40%, and high-end products outnumber
50%. By comparison, a majority of companies only have a 10-15% gross
margin, even 5% for ones with backward technology. As a result, many of
them abandoned the high-end market. Fujinon, KMOT and Digital
Optics are the second-tier members. Fujinon pays close attention to the
more lucrative professional-grade camera lens and DC lens rather than
mobile phones, which causes an annual revenue decline. With DC lens and
DVD OPU business, KMOT shows great interest in the field of mobile
phones, and may challenge Largan Precision’s status by virtue of rapid
business growth. As a South Korean company, Digital Optics has witnessed
fast-growing developments, with principle activities concentrated on
the high-end market. With respect to the camera module field,
LG-INNOTEK, pulled by the big customer Apple, saw a substantial increase
in revenue; SEMCO’s revenue increased by almost 100% relying on the
strong drive of Samsung mobile phones, very nearly the same as
LG-INNOTEK’s; benefiting from the greatly increased shipments of Huawei
and ZTE mobile phone, the Mainland vendor Sunny Optical doubled revenue.
South Korea-based Patron displayed the fastest growth, entering
Samsung’s supply chain for the first time, with an increase of up to
189%. Downhearted vendors include Foxconn, whose market share shrank
resulting from order-robbing by the specialized enterprises like Sunny
Optical Technology, and revenue was dragged down by the sharply dropped
shipments of its big customer Nokia; so did STMicroelectronics. Revenue of the World’s Leading CMOS Camera Module Vendors, 2010-2012 (Unit: US$M) 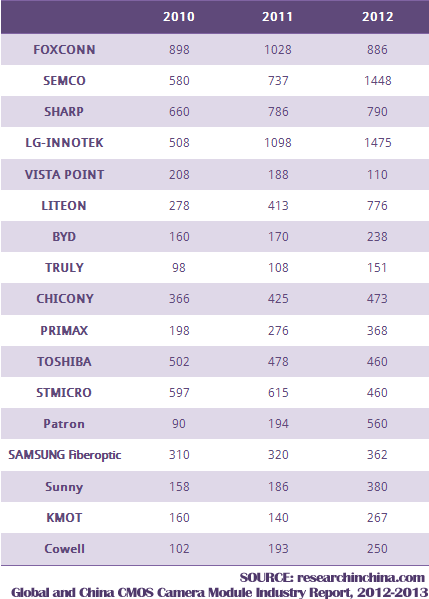
第一章、CMOS相机模组产业
1.1、CMOS相机模组产业链
1.2、CMOS图像传感器行业
1.3、图像传感器市场
1.4、光学镜头行业
1.5、CMOS相机光学镜头与品牌厂家供应关系
1.6、CMOS相机模组行业
1.7、CMOS相机模组与品牌厂家供应关系
1.8、AFA(VCM)简介
1.9、AFA行业格局
1.10、OIS简介
1.11、手机OIS现状
第二章、CMOS相机模组市场
2.1、CMOS相机模组市场规模
2.2、手机市场
2.2.1、全球手机市场规模
2.2.2、手机品牌市场占有率
2.2.3、智能手机市场与产业
2.2.4、中国手机产业地域分布
2.2.5、中国手机出口
2.3、笔记本电脑与平板电脑
2.3.1、笔记本电脑产业
2.3.2、笔记本电脑代工
2.3.3、平板电脑产业
2.3.4、中国移动PC产业
第三章、CMOS图像传感器厂家研究
3.1、三星电子
3.2、OMNIVISION
3.3、APTINA
3.4、索尼
3.5、东芝
3.6、格科微电子
3.7、思比科微电子
第四章、光学镜头厂家研究
4.1、大立光电
4.2、玉晶光电
4.3、亚洲光学
4.4、新巨科技
4.5、先进光电
4.6、KANTATSU
4.7、日立万胜
4.8、DIOSTECH
4.9、SEKONIX
4.10、高丽光学
4.11、FUJINON
4.12、光耀光电
4.13、和光光学
4.14、KMOT
4.15、DIGITAL OPTICS
4.16、OPTRONTEC
第五章、相机模组厂家研究
5.1、群光
5.2、VISTA POINT TECHNOLOGIES
5.3、鸿海
5.3.1、全亿大科技
5.3.2、佛山普立华
5.3.3、富晋精密工业晋城
5.4、LG INNOTEK
5.5、三美电机
5.6、信利光电
5.7、比亚迪光电
5.8、光宝科技
5.9、致伸科技
5.10、SEMCO
5.11、PATRON
5.12、SUNNY OPTICAL
第六章、AFA厂家研究
6.1、SHICOH
6.2、HYSONIC
6.3、电产三协
6.4、韩国磁化电子JAHWA
1. CMOS Camera Module Industry
1.1 Industry Chain
1.2 CMOS Image Sensor Industry
1.3 Image Sensor Market
1.4 Optical Lens Industry
1.5 Supply Relationship between CMOS Camera Optical Lens and Brand Company
1.6 CMOS Camera Module Sector
1.7 Supply Relationship between CMOS Camera Module and Brand Vendor
1.8 Introduction to AFA (VCM)
1.9 AFA Industry Structure
1.10 Introduction to OIS
1.11 Status of OIS in Mobile Phones
2. CMOS Camera Module Market
2.1 Market Size
2.2 Mobile Phone Market
2.2.1 Market Size of Global Mobile Phone
2.2.2 Market Share of Mobile Phone by Brand
2.2.3 Smartphone Market and Industry
2.2.4 China Mobile Phone Industry by Region
2.2.5 China Mobile Phone Exports
2.3 Laptop and Tablet PC
2.3.1 Laptop Industry
2.3.2 Laptop OEM
2.3.3 Tablet PC Industry
2.3.4 China Mobile PC Industry
3. CMOS Image Sensor Companies
3.1 SAMSUNG
3.2 OMNIVISION
3.3 APTINA
3.4 SONY
3.5 TOSHIBA
3.6 GALAXY CORE
3.7 SUPERPIX
4. Optical Lens Companies
4.1 LARGAN PRECISION
4.2 GENIUS ELECTRONIC OPTICAL
4.3 ASIA OPTICAL
4.4 NEWMAX
4.5 ABILITY OPTO-ELECTRONICS
4.6 KANTATSU
4.7 HITACHI MAXELL
4.8 DIOSTECH
4.9 SEKONIX
4.10 KOLEN OPTICAL
4.11 FUJINON
4.12 GLORY
4.13 HOKUGANG
4.14 KMOT
4.15 DIGITAL OPTICS
4.16 OPTRONTEC
5. Camera Module Vendors
5.1 CHICONY
5.2 VISTA POINT TECHNOLOGIES
5.3 HONHAI
5.3.1 CHAMP TECH OPTICAL
5.3.2 FOSHAN PREMIER
5.3.3 FUJIN PRECISION INDUSTRIAL (JINCHENG)
5.4 LG INNOTEK
5.5 MITSUMI
5.6 TRULY
5.7 BYD
5.8 LITE-ON
5.9 PRIMAX
5.10 SEMCO
5.11 PATRON
5.12 SUNNY OPTICAL
6. AFA Companies
6.1 SHICOH
6.2 HYSONIC
6.3 NIDEC SANKYO
6.4 JAHWA
CMOS相机模组产业链
IMAGE SENSOR厂家供应链
2010年全球主要CMOS IMAGE SENSOR厂家市场占有率
2011年全球主要CMOS IMAGE SENSOR厂家市场占有率
2012年全球主要CMOS IMAGE SENSOR厂家市场占有率
2012年全球主要CMOS IMAGE SENSOR厂家市场占有率(量)
2012年PC领域全球主要CMOS IMAGE SENSOR厂家市场占有率(量)
2011-2013年全球主要CMOS相机光学镜头厂家收入排名
2012年诺基亚手机相机光学镜头供应商分布
2012年三星光学镜头供应商分布
2012年苹果光学镜头供应商分布
2010-2012年全球主要CMOS相机模组厂家收入
2012年诺基亚相机模组供应商分布
2012年三星相机模组供应商分布
2012年苹果相机模组供应商分布
2012年LG相机模组供应商分布
2012年ZTE相机模组供应商分布
2012年华为相机模组供应商分布
VCM直观图
VCM剖面图
AFA与相机模组厂家之间供应关系
2012年全球主要AFA厂家市场占有率
光宝8M OIS模块
光宝的13M OIS模块
2010-2015年全球CMOS相机模组市场出货量与金额
2010-2015年全球CMOS相机模组出货量下游分布
2010-2015年全球CMOS相机模组出货量像素分布
2010-2015年全球手机用CMOS相机(MAIN CAMERA)模组出货量像素分布
2007-2014年全球手机出货量
2010-2013年全球CDMA/WCDMA手机出货量地域分布
2011、2012年全球主要手机厂家销量
2012年4季度全球主要手机厂家销量
2012年4季度韩国主要手机厂家市场占有率
2012年4季度美国主要手机厂家市场占有率
2012、2013年全球主要智能手机厂家销量
2012年4季度全球智能手机操作系统分布
2011年1-11月中国手机产量各省分布
2012年11月中国手机分省市产量数据表
2010-2013年笔记本电脑主要品牌出货量
2006、2008年主要笔记本电脑代工厂家市场占有率
2010年全球笔记本电脑品牌厂家与代工厂家之间配套关系及出货比例
2011年全球笔记本电脑品牌厂家与代工厂家之间配套关系及出货比例
2012、2013年全球笔记本电脑品牌厂家与代工厂家之间配套关系及出货比例
2012、2013年平板电脑主要厂家产量
2004-2012年中国笔记本电脑(包括平板电脑)产量
2010-2012年中国笔记本电脑产量(包括平板电脑)地域分布
三星 CMOS IMAGE SENSOR产品一览
2005-2013财年OMNIVISION收入与毛利率
2005-2013财年OMNIVISION收入与运营利润率
2002-2013财年OMNIVISION出货量
2009-2012财年OMNIVISION收入地域分布
2009-2012财年OMNIVISION资产地域分布
OMNINVISION 供应链
APTINA产品一览
索尼半导体事业部组织结构
索尼图像传感器产能扩展计划
2004-2013年大立光收入与毛利率
2004-2013年大立光收入与运营利润率
2011年1季度-2012年4季度大立光季度收入与净利率
2011年1月-2013年1月大立光月度收入
2011年1季度-2013年1季度大立光季度收入像素分布
2010-2012年大立光收入客户分布
2005-2013年玉晶光电收入与毛利率
2005-2013年玉晶广电收入与运营利润率
2011年1月-2013年1月玉晶光月度收入
2012年玉晶光电收入产品分布
2004-2012年亚光收入与毛利率
2004-2012年亚光收入与运营利润率
2007-2012年亚光收入产品分布
亚光手机相机模组产品一览
2007-2013年新钜科技收入与毛利率
2010年1季度-2011年4季度新巨科技收入产品分布
2011年1月-2013年1月新钜科技月度收入
2006-2012年先进光电收入与毛利率
2011年1月-2013年1月先进光电每月收入
KANTATSU手机相机模组产品一览
DIOSTECH组织结构
DIOSTECH生产线
DIOSTECH客户
2012年DIOSTECH收入像素分布
2002-2013年SEKONIX收入与运营利润率
2009-2013年SEKONIX收入产品分布
2011年1季度-2012年3季度SEKONIX收入像素分布
SEKNOIX手机相机模组产品一览
2007-2013年高丽光学收入与运营利润率
高丽光学路线图
2006-2012年光耀科技收入与运营利润率
2011年1月-2013年1月光耀科技每月收入
2006-2012年和光光学收入毛利率
2011年1月-2013年1月和光光学每月收入
2011-2012财年 KMOT OPTICAL UNITS FOR CELL PHONES 收入
2007-2013年DIGITAL OPTICS收入与运营利润率
2010-2013年DIGITAL OPTICS收入像素分布
2009-2013年DIGITAL OPTICS CAPEX
2009-2013年DIGITAL OPTICS产能
OPTRONTEC组织结构
2010-2014年OPTRONTEC收入与运营利润率
BLUE FILTER制造流程
OPTRONTEC BLUE FILTER产量
2010年1季度-2012年4季度OPTRONTEC收入产品分布
2011-2013年OPTRONTEC收入产品分布
2005-2013年群光收入与毛利率
2005-2013年群光收入与运营利润率
2011\2012年群光收入产品分布
2010年群光大陆子公司财务数据
2011年群光大陆子公司财务数据
鸿海光学领域主要子公司2010年财务数据
鸿海光学领域主要子公司2011年财务数据
2006-2013年LG INNOTEK收入与运营利润率
2011年1季度-2012年4季度LG INNOTEK收入与运营利润率
2011-2013年LG INNOTEK 收入业务分布
2011-2013年LG INNOTEK 运营利润业务分布
2011年4季度-2012年4季度LG INNOTEK收入业务分布
2011年1季度-2012年4季度LG INNOTEK OPTICAL季度收入
2006-2011财年三美电机收入与运营利润率
2006-2013财年三美电机收入产品分布
2012年信利半导体收入业务分布
信利光电产能
信利光电CSP能力
信利光电COB能力
信利光电手机相机模组路线图
信利光电笔记本电脑相机模组路线图
信利光电汽车用CMOS相机模组产品路线图
比亚迪相机模组产品一览
光宝集团
光宝收入业务分布
光宝广州科技园
2003-2013年光宝CCM出货量
2011年3季度-2013年4季度光宝CCM产能扩展计划
光宝 AF /FF CCM比例
光宝CCM技术路线图
光宝的OIS CONCEPT
2005-2013年光宝收入与运营利润率
致伸科技KEY MILESTONE
2008-2012年致伸科技收入与营业利润率
2007-2012年致伸科技收入部门分布
2011年1月-2013年1月致伸科技每月收入
致伸全球分布
致伸科技产品范围
2010-2013年SEMCO收入部门分布
2010-2013年SEMCO运营利润部门分布
2011年1季度-2012年SEMCO收入与运营利润率
2010-2014年SEMCO相机模组业务收入像素分布
2010年1季度-2013年4季度SEMCO相机模组ASP
2007-2013年PATRON收入与运营利润率
2011年1季度-2012年4季度PATRON收入产品分布
2004-2011年舜宇收入与毛利率
舜宇主要客户
2010-2012年舜宇收入部门分布
2010-2012年舜宇收入下游分布
2010-2012年舜宇各部门毛利率
舜宇工厂分布
2005-2011年思考电机收入与营业利润率
2006-2013年HYSONIC收入与运营利润
2012-2013年HYSONIC收入客户分布
2004-2012财年日本电产三协收入与运营利润率
2010-2011财年电产三协收入产品分布
2005-2012年磁化电子收入与运营利润率
2008-2013年JAHWA收入产品分布
2012年1季度-2013年4季度JAHWA AFA产品收入像素分布
磁化电子海外子公司一览
CMOS Camera Module Industry Chain
Image Sensor Companies Supply Chain
Market Share of Global Leading CMOS Image Sensor Companies, 2010
Market Share of Global Leading CMOS Image Sensor Companies, 2011
Market Share of Global Leading CMOS Image Sensor Companies, 2012
Market Share (Volume) of Global Leading CMOS Image Sensor Companies, 2012
Market Share (Volume) of Global Leading CMOS Image Sensor Companies in PC Field, 2012
Ranking of Global Leading CMOS Camera Optical Lens Companies by Revenue, 2011-2013
Distribution of Nokia Mobile Phone Camera Optical Lens Suppliers, 2012
Distribution of Samsung Optical Lens Suppliers, 2012
Distribution of Apple Optical Lens Suppliers, 2012
Revenue of Global Leading CMOS Camera Module Vendors, 2010-2012
Distribution of Nokia Camera Module Suppliers, 2012
Distribution of Samsung Camera Module Suppliers, 2012
Distribution of Apple Camera Module Suppliers, 2012
Distribution of LG Camera Module Suppliers, 2012
Distribution of ZTE Camera Module Suppliers, 2012
Distribution of Huawei Camera Module Suppliers, 2012
VCM Illustrative Diagram
VCM Profile Map
Supply Relationship between AFA and Camera Module Vendor
Market Share of Global Leading AFA Companies, 2012
LITE-ON 8M OIS Module
LITE-ON 13M OIS Module
Shipments and Amount of Global CMOS Camera Module Market, 2010-2015
Global CMOS Camera Module Shipment by Application, 2010-2015
Global CMOS Camera Module Shipment by Pixel, 2010-2015
Global Mobile Phone CMOS Camera (Main Camera) Module Shipments by Pixel, 2010-2015
Global Mobile Phone Shipment, 2007-2014
Global CDMA/WCDMA Mobile Phone Shipment by Region, 2010-2013
Sales Volume of Global Leading Mobile Phone Vendors, 2011-2012
Sales Volume of Global Leading Mobile Phone Vendors, Q4 2012
Market Share of South Korea’s Leading Mobile Phone Vendors, Q4 2012
Market Share of America’s Leading Mobile Phone Vendors, Q4 2012
Sales Volume of Global Leading Smartphone Vendors, 2012-2013
Global Smartphone Operating System Distribution, Q4 2012
China’s Mobile Phone Output by Province, Jan-Nov 2011
China’s Mobile Phone Output by Province/City, Nov 2012
Shipments of Top Laptop Brands, 2010-2013
Market Share of Top Laptop OEMs, 2006 vs. 2008
Supporting Relationship and Shipment Ratio between Global Laptop Brand Vendors and OEMs, 2010
Supporting Relationship and Shipment Ratio between Global Laptop Brand Vendors and OEMs, 2011
Supporting Relationship and Shipment Ratio between Global Laptop Brand Vendors and OEMs, 2012-2013
Output of Top Table PC Vendors, 2012-2013
China’s Laptop (Including Tablet PC) Output, 2004-2012
China’s Laptop (Including Tablet PC) Output by Region, 2010-2012
CMOS Image Sensor Product of SAMSUNG
Revenue and Gross Margin of OMNIVISION, FY2005-FY2013
Revenue and Operating Margin of OMNIVISION, FY2005-FY2013
Shipments of OMNIVISION, FY2002-FY2013
Revenue Breakdown of OMNIVISION by Region, FY2009-FY2012
Assets Breakdown of OMNIVISION by Region, FY2009-FY2012
Supply Chain of OMNIVISION
APTINA Product
Organizational Structure of Sony Semiconductor Group
SONY Image Sensor Capacity Expansion Planning
Revenue and Gross Margin of LARGAN PRECISION, 2004-2013
Revenue and Operating Margin of LARGAN PRECISION, 2004-2013
Quarterly Revenue and Net Profit Margin of LARGAN PRECISION, Q1 2011-Q4 2012
Monthly Revenue of LARGAN PRECISION, Jan 2011-Jan 2013
Quarterly Revenue of LARGAN PRECISION by Pixel, Q1 2011-Q1 2013
Revenue Breakdown of LARGAN PRECISION by Customer, 2010-2012
Revenue and Gross Margin of GENIUS ELECTRONIC OPTICAL, 2005-2013
Revenue and Operating Margin of GENIUS ELECTRONIC OPTICAL, 2005-2013
Monthly Revenue of GENIUS ELECTRONIC OPTICAL, Jan 2011-Jan 2013
Revenue Breakdown of GENIUS ELECTRONIC OPTICAL by Product, 2012
Revenue and Gross Margin of ASIA OPTICAL, 2004-2012
Revenue and Operating Margin of ASIA OPTICAL, 2004-2012
Revenue Breakdown of ASIA OPTICAL by Product, 2007-2012
Mobile Phone Camera Module Product of ASIA OPTICAL
Revenue and Gross Margin of NEWMAX, 2007-2013
Revenue Breakdown of NEWMAX by Products, Q1 2010-Q4 2011
Monthly Revenue of NEWMAX, Jan 2011-Jan 2013
Revenue and Gross Margin of ABILITY OPTO-ELECTRONICS, 2006-2012
Monthly Revenue of ABILITY OPTO-ELECTRONICS, Jan 2011-Jan 2013
Mobile Phone Camera Module Product of KANTATSU
Organizational Structure of DIOSTECH
Production Line of DIOSTECH
DIOSTECH’s Clients
Revenue Breakdown of DIOSTECH by Pixel, 2012
Revenue and Operating Margin of SEKONIX, 2002-2013
Revenue Breakdown of SEKONIX by Product, 2009-2013
Revenue Breakdown of SEKONIX by Pixels, Q1 2011-Q3 2012
Mobile Phone Camera Module Product of SEKNOIX
Revenue and Operating Margin of KOLEN OPTICAL, 2007-2013
Roadmap of KOLEN OPTICAL
Revenue and Operating Margin of GLORY, 2006-2012
Monthly Revenue of GLORY, Jan 2011-Jan 2013
Revenue and Gross Margin of HOKUGANG, 2006-2012
Monthly Revenue of HOKUGANG, Jan 2011-Jan 2013
Revenue of KMOT Optical Units for Cell Phones, FY2011-FY2012
Revenue and Operating Margin of DIGITAL OPTICS, 2007-2013
Revenue Breakdown of DIGITAL OPTICS by Pixel, 2010-2013
CAPEX of DIGITAL OPTICS, 2009-2013
Capacity of DIGITAL OPTICS, 2009-2013
Organizational Structure of OPTRONTEC
Revenue and Operating Margin of OPTRONTEC, 2010-2014
Manufacturing Process of Blue Filter
Blue Filter Output of OPTRONTEC
Revenue Breakdown of OPTRONTEC by Product, Q1 2010-Q4 2012
Revenue Breakdown of OPTRONTEC by Product, 2011-2013
Revenue and Gross Margin of CHICONY, 2005-2013
Revenue and Operating Margin of CHICONY, 2005-2013
Revenue Breakdown of CHICONY by Product, 2011 vs. 2012
Financial Data of CHICONY’s Subsidiaries in Mainland, 2010
Financial Data of CHICONY’s Subsidiaries in Mainland, 2011
Financial Data of HONHAI’s Major Optical Subsidiaries, 2010
Financial Data of HONHAI’s Major Optical Subsidiaries, 2011
Revenue and Operating Margin of LG INNOTEK, 2006-2013
Revenue and Operating Margin of LG INNOTEK, Q1 2011-Q4 2012
Revenue Breakdown of LG INNOTEK by Business, 2011-2013
Operating Income of LG INNOTEK by Business, 2011-2013
Revenue Breakdown of LG INNOTEK by Business, Q4 2011-Q4 2012
Quarterly Revenue of LG INNOTEK OPTICAL, Q1 2011-Q4 2012
Revenue and Operating Margin of MITSUMI, FY2006-FY2011
Revenue Breakdown of MITSUMI by Product, FY2006-FY2013
Revenue Breakdown of TRULY SEMICONDUCTORS by Business, 2012
Capacity of TRULY OPTO-ELECTRONICS
CSP Capacity of TRULY OPTO-ELECTRONICS
COB Capacity of TRULY OPTO-ELECTRONICS
TRULY OPTO-ELECTRONICS Mobile Phone Camera Module Roadmap
TRULY OPTO-ELECTRONICS Laptop Camera Module Roadmap
Roadmap to TRULY OPTO-ELECTRONICS CMOS Camera Module Products for Automotive Applications
BYD Camera Module Product
Lite-On Group
Revenue Breakdown of LITE-ON by Business
Guangzhou Science Park of LITE-ON
CCM Shipments of LITE-ON, 2003-2013
CCM Capacity Expansion Planning of LITE-ON, Q3 2011-Q4 2013
AF/FF CCM Ratio of LITE-ON
CCM Technology Roadmap of LITE-ON
OIS Concept of LITE-ON
Revenue and Operating Margin of LITE-ON, 2005-2013
Key Milestones for PRIMAX
Revenue and Operating Margin of PRIMAX, 2008-2012
Revenue Breakdown of PRIMAX by Division, 2007-2012
Monthly Revenue of PRIMAX, Jan 2011-Jan 2013
Global Distribution of PRIMAX
Product Range of PRIMAX
Revenue Breakdown of SEMCO by Division, 2010-2013
Operating Income of SEMCO by Division, 2010-2013
Revenue and Operating Margin of SEMCO, Q1 2011-2012
Revenue of SEMCO Camera Module Business by Pixel, 2010-2014
ASP of SEMCO Camera Module, Q1 2010-Q4 2013
Revenue and Operating Margin of PATRON, 2007-2013
Revenue Breakdown of PATRON by Products, Q1 2011-Q4 2012
Revenue and Gross Margin of SUNNY OPTICAL, 2004-2011
Main Clients of SUNNY OPTICAL
Revenue Breakdown of SUNNY OPTICAL by Divisions, 2010-2012
Revenue Breakdown of SUNNY OPTICAL by Applications, 2010-2012
Gross Margin of SUNNY OPTICAL by Divisions, 2010-2012
SUNNY OPTICAL Factory Distribution
Revenue and Operating Margin of SHICOH, 2005-2011
Revenue and Operating Income of HYSONIC, 2006-2013
Revenue Breakdown of HYSONIC by Clients, 2012-2013
Revenue and Operating Margin of NIDEC SANKYO, FY2004-FY2012
Revenue Breakdown of NIDEC SANKYO by Product, FY2010-FY2011
Revenue and Operating Margin of JAHWA, 2005-2012
Revenue Breakdown of JAHWA by Product, 2008-2013
Revenue Breakdown of JAHWA’s AFA Products by Pixel, Q1 2012-Q4 2013
Overseas Subsidiaries of JAHWA
如果这份报告不能满足您的要求,我们还可以为您定制报告,请 留言说明您的详细需求。
|