|
|
|
报告导航:研究报告—
制造业—化工
|
|
2012-2015年中国印染助剂行业研究报告 |
 |
字数:3.0万 |
页数:82 |
图表数:105 |
|
中文电子版:7500元 |
中文纸版:3750元 |
中文(电子+纸)版:8000元 |
|
英文电子版:1950美元 |
英文纸版:2050美元 |
英文(电子+纸)版:2250美元 |
|
编号:HK030
|
发布日期:2013-03 |
附件:下载 |
 |
|
|
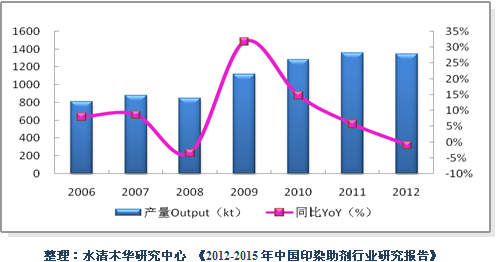
印染助剂指纺织品在印花、染色加工中,为了改善加工工艺、提高操作效率、提升纺织品质量和性能而加入的一些辅助化学品。印染助剂是纺织助剂的一种,主要品种有匀染剂、消泡剂、分散剂、粘合剂、固色剂等。 1990年以来,随着欧美国家人力成本及污染治理成本的上升,全球印染产业逐步从传统的美国、西欧、日本等地区向亚太地区发展中国家转移,目前亚太地区已经是全球最大的印染助剂产地。 2006-2012年,中国印染助剂产量总体呈上升趋势,年均复合增长率达8.8%。2012年,中国印染助剂产量为134.6万吨,占全球总产量的30%左右。中国印染助剂行业对外依存度不高,自给率达85%以上,但是专用和高档印染助剂对进口的依赖程度仍较大。 图:2006-2012年中国印染助剂产量及同比增长率
中国印染助剂生产企业有2000-3000家,市场高度分散。其中民营企业占据主导地位,合资和外商独资企业占10%左右。中国印染助剂行业龙头企业为传化股份和德美化工,2012年二者印染助剂产能分别为16万吨和13万吨。随着中国印染助剂产业结构调整的加速进行,高档、环保型纺织助剂成为行业可持续发展的关键,而生产工艺较先进且研发实力较强的外资企业和国内印染助剂龙头具有明显的优势。 印染助剂用于纺织品的印染加工过程,印染行业的发展状况和景气度直接影响印染助剂的市场状况。2006-2012年,中国印染布产量的年均复合增长率为4.7%,2012年达566亿米。中国印染布生产地较集中,产量前五的地区分别为浙江、福建、江苏、广东和山东,产量占比高达90%以上。 中国印染行业生产企业也较多,市场竞争激烈。2010年以来,中国加速淘汰部分生产规模小、设备落后的印染企业,使得行业集中度逐步提高。目前,中国印染行业主要企业有航民股份、众和股份、三房巷等,其中航民股份为中国印染行业龙头,在生产技术、产能、研发能力等方面均处于行业领先地位。 水清木华研究中心《2012-2015年中国印染助剂行业研究报告》主要包括以下几个内容:- 中国印染助剂行业政策分析、供需分析、竞争格局、进出口分析及发展预测等;
- 中国印染行业运营分析、供需分析、投资分析、进出口分析及发展预测等;
- 中国9家印染助剂生产企业的经营状况、印染助剂业务分析及发展预测等;
- 中国3家印染加工企业的经营状况、印染业务分析及发展预测等。
Printing and dyeing auxiliaries refer to the auxiliary chemicals added
during textile printing and dyeing to improve the processing technology,
operational efficiency, textile quality and performance. Printing and
dyeing auxiliaries fall into the category of textile auxiliaries, with
major varieties including leveling agent, defoamer, dispersant, binding
agent, fixing agent, etc. Since 1990, with the rise in the cost
of labor and pollution control in the United States and Europe, the
global printing and dyeing industry has gradually transferred from the
United States, Western Europe and Japan to the developing countries in
the Asia-Pacific region. At present, the Asia-Pacific region is already
the world's largest producing area of printing and dyeing auxiliaries. In
2006-2012, China’s printing and dyeing auxiliary output generally
showed an upward trend, with a CAGR of 8.8%. In 2012, the output was
1.346 million tons, accounting for about 30% of the global output.
China’s printing and dyeing auxiliary industry has a self-sufficiency
rate of over 85%, but still relies heavily on the import of dedicated
and high-end printing and dyeing auxiliaries. China Printing and Dyeing Auxiliary Output and YoY Growth Rate, 2006-2012
There
are 2,000-3,000 printing and dyeing auxiliary producers in China. The
market is highly fragmented, private enterprises occupy a dominant
position, while joint ventures and foreign wholly-owned enterprises each
hold about 10%. Zhejiang Transfar and Dymatic Chemicals are leading
enterprises in China’s printing and dyeing auxiliary industry, with an
annual capacity of 160 kilotons and 130 kilotons in 2012 respectively.
With the accelerated structural adjustment of China’s printing and
dyeing auxiliary industry, high-end, eco-friendly textile auxiliaries
have become the key to the sustainable development of the industry, and
the foreign-funded enterprises and domestic leading enterprises with
advanced production technology and strong R&D strength have obvious
advantage. As printing and dyeing auxiliaries are used for
textile printing and dyeing, the development and prosperity of the
printing and dyeing industry directly affect the market of printing and
dyeing auxiliaries. In 2006-2012, China’s printing and dyeing cloth
output maintained a CAGR of 4.7%, and reached 56.6 billion meters in
2012. China’s printing and dyeing cloth production is quite
concentrated, with top five producing regions (Zhejiang, Fujian,
Jiangsu, Guangdong and Shandong) accounting for more than 90% of the
national output. There are many enterprises in China’s printing
and dyeing industry, and the market competition is intense. Since 2010,
China has accelerated the elimination of small and backward printing and
dyeing enterprises, gradually enhancing the industry concentration. At
present, Hangmin, Zhonghe and Sanfangxiang are major enterprises in
China’s printing and dyeing industry. Hangmin is an industry leader in
terms of production technology, capacity and R & D capabilities. China Printing and Dyeing Auxiliary Industry Report, 2012-2015 of ResearchInChina includes the following contents:
Policy, supply and demand, competition pattern, import and export, and
development forecast of China printing and dyeing auxiliary industry; Operation, supply and demand, investment, import and export, and development forecast of China printing and dyeing industry;
Operation, printing and dyeing auxiliary business, and development
forecast of nine printing and dyeing auxiliary producers in China; Operation, printing and dyeing business, and development forecast of three printing and dyeing enterprises in China.
第一章 印染助剂行业概述
1.1 定义及作用
1.2 分类
1.3 产业链
1.4 行业概述
第二章 中国印染助剂行业分析
2.1 发展现状
2.2 政策环境
2.3 供需分析
2.4 竞争格局
2.5 进出口分析
2.6 发展及预测
2.6.1 发展趋势
2.6.2 供需预测
第三章 中国印染行业经济运行情况
3.1 运营分析
3.2 供给分析
3.3 投资情况
3.4 进出口分析
3.5 发展及预测
3.5.1 发展趋势
3.5.2 供给预测
第四章 中国主要生产企业
4.1 传化股份
4.1.1 公司简介
4.1.2 经营状况
4.1.3 营收构成
4.1.4 毛利率
4.1.5 客户
4.1.6 印染助剂业务
4.1.7 预测与展望
4.2 德美化工
4.2.1 公司简介
4.2.2 经营情况
4.2.3 营收构成
4.2.4 毛利率
4.2.5 客户及供应商
4.2.6 印染助剂业务
4.2.7 预测与展望
4.3 浙江龙盛
4.3.1 公司简介
4.3.2 经营情况
4.3.3 营收构成
4.3.4 毛利率
4.3.5 客户
4.3.6 印染助剂业务
4.3.7 预测与展望
4.4 闰土股份
4.4.1 公司简介
4.4.2 经营情况
4.4.3 营收构成
4.4.4 毛利率
4.4.5 客户
4.4.6 印染助剂业务
4.4.7 预测与展望
4.5 安诺其
4.5.1 公司简介
4.5.2 经营情况
4.5.3 营收构成
4.5.4 毛利率
4.5.5 客户
4.5.6 印染助剂业务
4.5.7 预测与展望
4.6 航民股份
4.6.1 公司简介
4.6.2 经营情况
4.6.3 营收构成
4.6.4 毛利率
4.6.5 客户
4.6.6 印染业务
4.6.7 预测与展望
4.7 众和股份
4.7.1 公司简介
4.7.2 经营情况
4.7.3 营收构成
4.7.4 毛利率
4.7.5 印染业务
4.7.6 预测与展望
4.8 三房巷
4.8.1 公司简介
4.8.2 经营情况
4.8.3 营收构成
4.8.4 毛利率
4.8.5 印染业务
4.8.6 预测与展望
4.9 恒星化工
4.9.1 公司简介
4.9.2 经营情况
4.9.3 印染助剂业务
4.10 美高化工
4.10.1 公司简介
4.10.2 经营情况
4.10.3 印染助剂业务
4.11 大祥化工
4.11.1 公司简介
4.11.2 经营情况
4.11.3 印染助剂业务
4.12 宏达化学
1. Overview of Printing and Dyeing Auxiliary Industry
1.1 Definition and Application
1.2 Classification
1.3 Industry Chain
1.4 Industry Overview
2. China Printing and Dyeing Auxiliary Industry
2.1 Development Status
2.2 Policy Environment
2.3 Supply and Demand
2.4 Competition Pattern
2.5 Import and Export
2.6 Development and Forecast
2.6.1 Development Trend
2.6.2 Supply and Demand Forecast
3. Economic Operation of China Printing and Dyeing Industry
3.1 Operation
3.2 Supply
3.3 Investment
3.4 Import and Export
3.5 Development and Forecast
3.5.1 Development Trend
3.5.2 Supply Forecast
4. Key Enterprises
4.1 Zhejiang Transfar Co., Ltd.
4.1.1 Profile
4.1.2 Operation
4.1.3 Revenue Structure
4.1.4 Gross Margin
4.1.5 Customers
4.1.6 Printing and Dyeing Auxiliary Business
4.1.7 Forecast and Prospect
4.2 Dymatic Chemicals Inc.
4.2.1 Profile
4.2.2 Operation
4.2.3 Revenue Structure
4.2.4 Gross Margin
4.2.5 Customers and Suppliers
4.2.6 Printing and Dyeing Auxiliary Business
4.2.7 Forecast and Prospect
4.3 Zhejiang Longsheng Group Co., Ltd.
4.3.1 Profile
4.3.2 Operation
4.3.3 Revenue Structure
4.3.4 Gross Margin
4.3.5 Customers
4.3.6 Printing and Dyeing Auxiliary Business
4.3.7 Forecast and Prospect
4.4 Zhejiang Runtu Co., Ltd.
4.4.1 Profile
4.4.2 Operation
4.4.3 Revenue Structure
4.4.4 Gross Margin
4.4.5 Customers
4.4.6 Printing and Dyeing Auxiliary Business
4.4.7 Forecast and Prospect
4.5 Shanghai Anoky Textile Chem Co., Ltd.
4.5.1 Profile
4.5.2 Operation
4.5.3 Revenue Structure
4.5.4 Gross Margin
4.5.5 Customers
4.5.6 Printing and Dyeing Auxiliary Business
4.5.7 Forecast and Prospect
4.6 Zhejiang Hangmin Co., Ltd.
4.6.1 Profile
4.6.2 Operation
4.6.3 Revenue Structure
4.6.4 Gross Margin
4.6.5 Customers
4.6.6 Printing and Dyeing Business
4.6.7 Forecast and Prospect
4.7 Zhonghe Co., Ltd.
4.7.1 Profile
4.7.2 Operation
4.7.3 Revenue Structure
4.7.4 Gross Margin
4.7.5 Printing and Dyeing Business
4.7.6 Forecast and Prospect
4.8 Jiangsu Sanfangxiang Industry Co., Ltd.
4.8.1 Profile
4.8.2 Operation
4.8.3 Revenue Structure
4.8.4 Gross Margin
4.8.5 Printing and Dyeing Business
4.8.6 Forecast and Prospect
4.9 Sunichem Group
4.9.1 Profile
4.9.2 Operation
4.9.3 Printing and Dyeing Auxiliary Business
4.10 Hangzhou Meigao Huayi Chemical Co., Ltd. (MG Chemical)
4.10.1 Profile
4.10.2 Operation
4.10.3 Printing and Dyeing Auxiliary Business
4.11 Shanghai Daxiang Chemical Industry Co., Ltd.
4.11.1 Profile
4.11.2 Operation
4.11.3 Printing and Dyeing Auxiliary Business
4.12 Zhejiang Hongda Chemicals Co., Ltd.
表:纺织助剂分类及主要产品
表:印染助剂主要产品及其作用
图:印染助剂产业链
图:2012年中国纺织助剂主要品种及其产量占比
图:2006-2012年中国印染助剂产量及同比增长率
表:2012年中国印染助剂行业主要企业及其产能
图:2008-2012年中国纺织助剂进出口量
图:2008-2012年中国纺织助剂进出口平均价格
图:2012年中国纺织助剂进口来源结构(按进口量)
图:2012年中国纺织助剂出口目的地分布(按出口量)
图:2012年中国纺织助剂主要进口城市及其进口量占比
图:2012年中国纺织助剂主要出口城市及其出口量占比
图:2012-2016年中国印染助剂产量预测
图:2006-2012年中国印染行业主营业务收入及增长率
图:2010-2012年中国印染行业(分产品)主营业务收入占比
图:2006-2012年中国印染行业利润总额及增长率
图:2010-2012年中国印染行业(分产品)利润总额占比
图:2006-2012年中国印染布产量及增长率
图:2012年中国印染布(分地区)产量占比
表:2010-2012年中国印染行业投资情况
表:2012中国印染产品进出口量、金额及平均价格
图:2010-2012年中国印染产品出口量及出口额
表:2011年中国印染6类产品出口量、出口额及平均价格
图:2011年中国印染产品出口目的地结构(按出口量)
图:2012-2016年中国印染布产量预测
表:传化股份产品系列
图:2008-2012年传化股份营业收入和净利润
表:2010-2012年传化股份(分产品)营业收入
表:2010-2012年传化股份(分产品)营业收入占比
表:2010-2012年传化股份(分地区)营业收入
表:2010-2012年传化股份(分地区)营业收入占比
图:2008-2012年传化股份主营产品毛利率
表:传化股份印染助剂产品分类
表:2012年传化股份印染助剂相关子公司及其主营业务
表:2012传化股份印染助剂相关子公司营业收入及净利润
图:2011-2015年传化股份营业收入及净利润预测
图:2008-2012年德美化工营业收入及净利润
表:2010-2012年德美化工(分产品)营业收入
表:2010-2012年德美化工(分产品)营业收入占比
表:2010-2012年德美化工(分地区)营业收入
表:2010-2012年德美化工(分地区)营业收入占比
图:2008-2012年德美化工主营产品毛利率
图:2009-2012年德美化工前五名供应商采购额及占比
表:2012年德美化工前五名供应商名称、采购金额及占比
表:德美化工印染助剂产品
图:2011-2015年德美化工营业收入及净利润预测
表:浙江龙盛主要产业及具体业务
图:2008-2012年浙江龙盛营业收入及净利润
表:2010-2012年浙江龙盛(分产品)营业收入
表:2010-2012年浙江龙盛(分产品)营业收入占比
表:2010-2012年浙江龙盛(分地区)营业收入
表:2010-2012年浙江龙盛(分地区)营业收入占比
图:2008-2012年浙江龙盛染料产品毛利率
图:2011-2015年德美化工营业收入及净利润预测
表:闰土股份主营业务及产品
图:2008-2012年闰土股份营业收入及净利润
表:2010-2012年闰土股份(分产品)营业收入
表:2010-2012年闰土股份(分产品)营业收入占比
表:2010-2012年闰土股份(分地区)营业收入
表:2010-2012年闰土股份(分地区)营业收入占比
图:2009-2012年闰土股份主营产品毛利率
表:2012年闰土股份印染助剂相关子公司及其主营业务
图:2011-2015年闰土股份营业收入及净利润预测
表:安诺其主营业务及产品
图:2008-2012年安诺其营业收入及净利润
表:2010-2012年安诺其(分产品)营业收入
表:2010-2012年安诺其(分产品)营业收入占比
表:2010-2012年安诺其(分地区)营业收入
表:2010-2012年安诺其(分地区)营业收入占比
图:2010-2012年安诺其主营产品毛利率
表:2012年安诺其助剂相关子公司及其主营业务
表:2010-2012年烟台安诺其营业收入及净利润
表:2010-2012年烟台安诺其营业收入及净利润
图:2011-2015年安诺其营业收入及净利润预测
图:2008-2012年航民股份营业收入及净利润
表:2010-2012年航民股份(分产品)营业收入
表:2010-2012年航民股份(分产品)营业收入占比
表:2010-2012年航民股份(分地区)营业收入
表:2010-2012年航民股份(分地区)营业收入占比
图:2008-2012年航民股份印染产品毛利率
表:2012航民股份印染相关子公司销售收入及净利润
图:2011-2015年航民股份营业收入及净利润预测
图:2008-2012年众和股份营业收入及净利润
表:2010-2012年众和股份(分产品)营业收入
表:2010-2012年众和股份(分产品)营业收入占比
表:2010-2012年众和股份(分地区)营业收入
表:2010-2012年众和股份(分地区)营业收入占比
图:2008-2012年众和股份纺织印染业务毛利率
图:2008-2012年厦门华印净利润
图:2011-2015年众和股份营业收入及净利润预测
图:2008-2012年三房巷营业收入及净利润
表:2010-2012年三房巷(分产品)营业收入
表:2010-2012年三房巷(分产品)营业收入占比
表:2010-2012年三房巷(分地区)营业收入
表:2010-2012年三房巷(分地区)营业收入占比
图:2008-2012年三房巷主营产品毛利率
表:2010-2012年三房巷印染布及棉纱产量
图:2011-2015年三房巷营业收入及净利润预测
表:2008-2009年恒星化工主营业务收入及利润总额
表:恒星化工印染助剂分类及产品
表:恒星化工印染助剂业务发展历程
表:2008-2009年美高化工主营业务收入及利润总额
表:美高化工印染助剂产品系列
表:2008-2009年大祥化工主营业务收入及利润总额
表:美高化工印染助剂产品系列
Textile Auxiliary Classification and Main Products
Printing and Dyeing Auxiliary Products and Applications
Printing and Dyeing Auxiliary Industry Chain
China Textile Auxiliary Output Structure by Variety, 2012
China Printing and Dyeing Auxiliary Output and YoY Growth Rate, 2006-2012
Major Enterprises and Their Capacities of China Printing and Dyeing Auxiliary Industry, 2012
China Textile Auxiliary Import and Export Volume, 2008-2012
China Textile Auxiliary Import and Export Prices, 2008-2012
China Textile Auxiliary Import Source Structure (by Import Volume), 2012
China Textile Auxiliary Export Destination Structure (by Export Volume), 2012
China Textile Auxiliary Import Volume by City, 2012
China Textile Auxiliary Export Volume by City, 2012
China Printing and Dyeing Auxiliary Output, 2012-2016E
Operating Revenue and Growth Rate of China Printing and Dyeing Industry, 2006-2012
Operating Revenue Structure of China Printing and Dyeing Industry (by Product), 2010-2012
Total Profit and Growth Rate of China Printing and Dyeing Industry, 2006-2012
Profit Structure of China Printing and Dyeing Industry (by Product), 2010-2012
China Printing and Dyeing Cloth Output and Growth Rate, 2006-2012
China Printing and Dyeing Cloth Output Structure (by Region), 2012
China Printing and Dyeing Industry Investment, 2010-2012
Import and Export Volume, Value and Average Prices of Printing and Dyeing Products of China, 2012
Export Volume and Value of Printing and Dyeing Products of China, 2010-2012
Export Volume, Export Value and Average Prices of Six Categories of Printing and Dyeing Products of China, 2011
China Printing and Dyeing Product Export Destination Structure (by Export Volume), 2011
China Printing and Dyeing Cloth Output, 2012-2016E
Product Series of Transfar
Revenue and Net Income of Transfar, 2008-2012
Revenue of Transfar by Product, 2010-2012
Revenue Structure of Transfar by Product, 2010-2012
Revenue of Transfar by Region, 2010-2012
Revenue Structure of Transfar by Region, 2010-2012
Gross Margin of Transfar by Product, 2008-2012
Printing and Dyeing Auxiliary Product Classification of Transfar
Printing and Dyeing Auxiliary Related Subsidiaries and Their Main Businesses of Transfar, 2012
Revenue and Net Income of Printing and Dyeing Auxiliary Related Subsidiaries of Transfar, 2012
Revenue and Net Income of Transfar, 2011-2015E
Revenue and Net Income of Dymatic Chemicals, 2008-2012
Revenue of Dymatic Chemicals by Product, 2010-2012
Revenue Structure of Dymatic Chemicals by Product, 2010-2012
Revenue of Dymatic Chemicals by Region, 2010-2012
Revenue Structure of Dymatic Chemicals by Region, 2010-2012
Gross Margin of Dymatic Chemicals by Product, 2008-2012
Procurement of Dymatic Chemicals from Top 5 Suppliers, 2009-2012
Name List, Procurement and % of Top 5 Suppliers of Dymatic Chemicals, 2012
Printing and Dyeing Auxiliary Products of Dymatic Chemicals
Revenue and Net Income of Dymatic Chemicals, 2011-2015E
Main Businesses of Zhejiang Longsheng
Revenue and Net Income of Zhejiang Longsheng, 2008-2012
Revenue of Zhejiang Longsheng by Product, 2010-2012
Revenue Structure of Zhejiang Longsheng by Product, 2010-2012
Revenue of Zhejiang Longsheng by Region, 2010-2012
Revenue Structure of Zhejiang Longsheng by Region, 2010-2012
Gross Margin of Dye Products of Zhejiang Longsheng, 2008-2012
Revenue and Net Income of Dymatic Chemicals, 2011-2015E
Main Businesses and Products of Zhejiang Runtu
Revenue and Net Income of Zhejiang Runtu, 2008-2012
Revenue of Zhejiang Runtu by Product, 2010-2012
Revenue Structure of Zhejiang Runtu by Product, 2010-2012
Revenue of Zhejiang Runtu by Region, 2010-2012
Revenue Structure of Zhejiang Runtu by Region, 2010-2012
Gross Margin of Zhejiang Runtu by Product, 2009-2012
Printing and Dyeing Auxiliary Related Subsidiaries and Main Businesses of Zhejiang Runtu, 2012
Revenue and Net Income of Zhejiang Runtu, 2011-2015E
Main Businesses and Products of Anoky
Revenue and Net Income of Anoky, 2008-2012
Revenue of Anoky by Product, 2010-2012
Revenue Structure of Anoky by Product, 2010-2012
Revenue of Anoky by Region, 2010-2012
Revenue Structure of Anoky by Region, 2010-2012
Gross Margin of Anoky by Product, 2010-2012
Auxiliary Related Subsidiaries and Their Main Businesses of Anoky, 2012
Revenue and Net Income of Yantai Anoky, 2010-2012
Revenue and Net Income of Anoky, 2011-2015E
Revenue and Net Income of Hangmin, 2008-2012
Revenue of Hangmin by Product, 2010-2012
Revenue Structure of Hangmin by Product, 2010-2012
Revenue of Hangmin by Region, 2010-2012
Revenue Structure of Hangmin by Region, 2010-2012
Gross Margin of Printing and Dyeing Products of Hangmin, 2008-2012
Sales and Net Income of Printing and Dyeing Related Subsidiaries of Hangmin, 2012
Revenue and Net Income of Hangmin, 2011-2015E
Revenue and Net Income of Zhonghe, 2008-2012
Revenue of Zhonghe by Product, 2010-2012
Revenue Structure of Zhonghe by Product, 2010-2012
Revenue of Zhonghe by Region, 2010-2012
Revenue Structure of Zhonghe by Region, 2010-2012
Gross Margin of Textile Printing and Dyeing Business of Zhonghe, 2008-2012
Net Income of Xiamen Hualun Printing & Dyeing, 2008-2012
Revenue and Net Income of Zhonghe, 2011-2015E
Revenue and Net Income of Sanfangxiang, 2008-2012
Revenue of Sanfangxiang by Product, 2010-2012
Revenue Structure of Sanfangxiang by Product, 2010-2012
Revenue of Sanfangxiang by Region, 2010-2012
Revenue Structure of Sanfangxiang by Region, 2010-2012
Gross Margin of Sanfangxiang by Product, 2008-2012
Printing and Dyeing Cloth and Cotton Yarn Output of Sanfangxiang, 2010-2012
Revenue and Net Income of Sanfangxiang, 2011-2015E
Operating Revenue and Total Profit of Sunichem, 2008-2009
Printing and Dyeing Auxiliary Classification and Products of Sunichem
Printing and Dyeing Auxiliary Business Development History of Sunichem
Operating Revenue and Total Profit of MG Chemical, 2008-2009
Printing and Dyeing Auxiliary Product Series of MG Chemical
Operating Revenue and Total Profit of Daxiang Chemical, 2008-2009
Printing and Dyeing Auxiliary Product Series of Hongda Chemicals
如果这份报告不能满足您的要求,我们还可以为您定制报告,请 留言说明您的详细需求。
|